
Crypto Market Overview: Bitcoin loses $63,000 amid tech sell-off – WLD, VVV tokens lead losses
Ni Vishal Dixit
Na-update: 24 Jun 2026


Sikat na Artikulo

Bitcoin (BTC) edges below $63,000 at press time on Wednesday, amid a global sell-off of tech stocks, including AI and chip stocks.
- Bitcoin hovers below $63,000 on Wednesday amid a global tech sell-off.
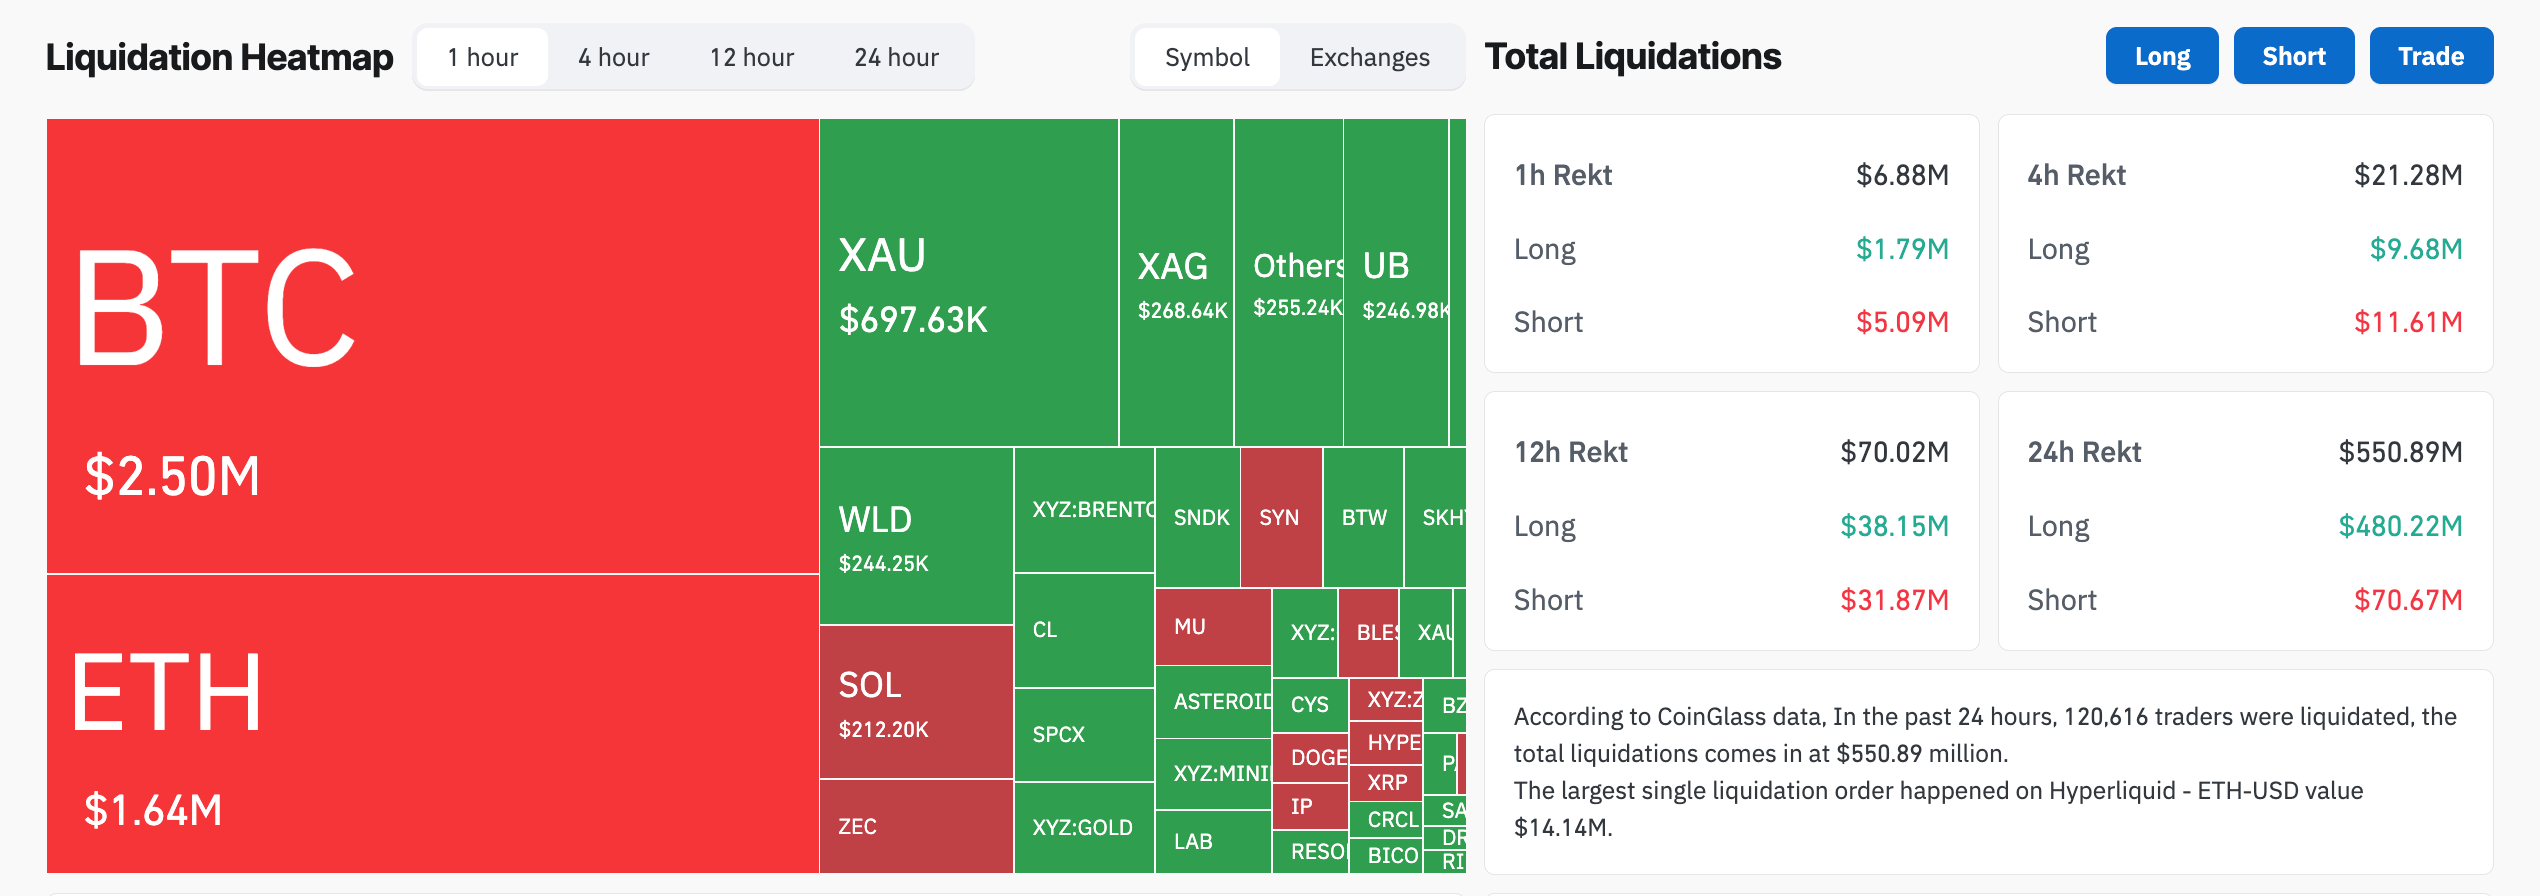
- Total liquidation hits $550 million over the last 24 hours, led by long liquidations signaling a sell-side dominance.
- Worldcoin and Venice Token led losses over the last 24 hours.
Bitcoin (BTC) edges below $63,000 at press time on Wednesday, amid a global sell-off of tech stocks, including AI and chip stocks. The broader crypto market recorded $550 million in total liquidations, primarily driven by long liquidations, suggesting sell-side dominance, with Worldcoin (WLD) and Venice Token (VVV) leading losses.
Sellers dominate the crypto trading ground amid the global tech sell-off
The broader cryptocurrency market experiences a fresh surge in selling pressure as global tech stocks lose ground. US tech stocks, including Micron Technology Inc., Marvell Technology Inc., and On Semiconductor Corp., fell between 10% to 13% on Tuesday, while South Korea's Kospi Index is extending losses on Wednesday.
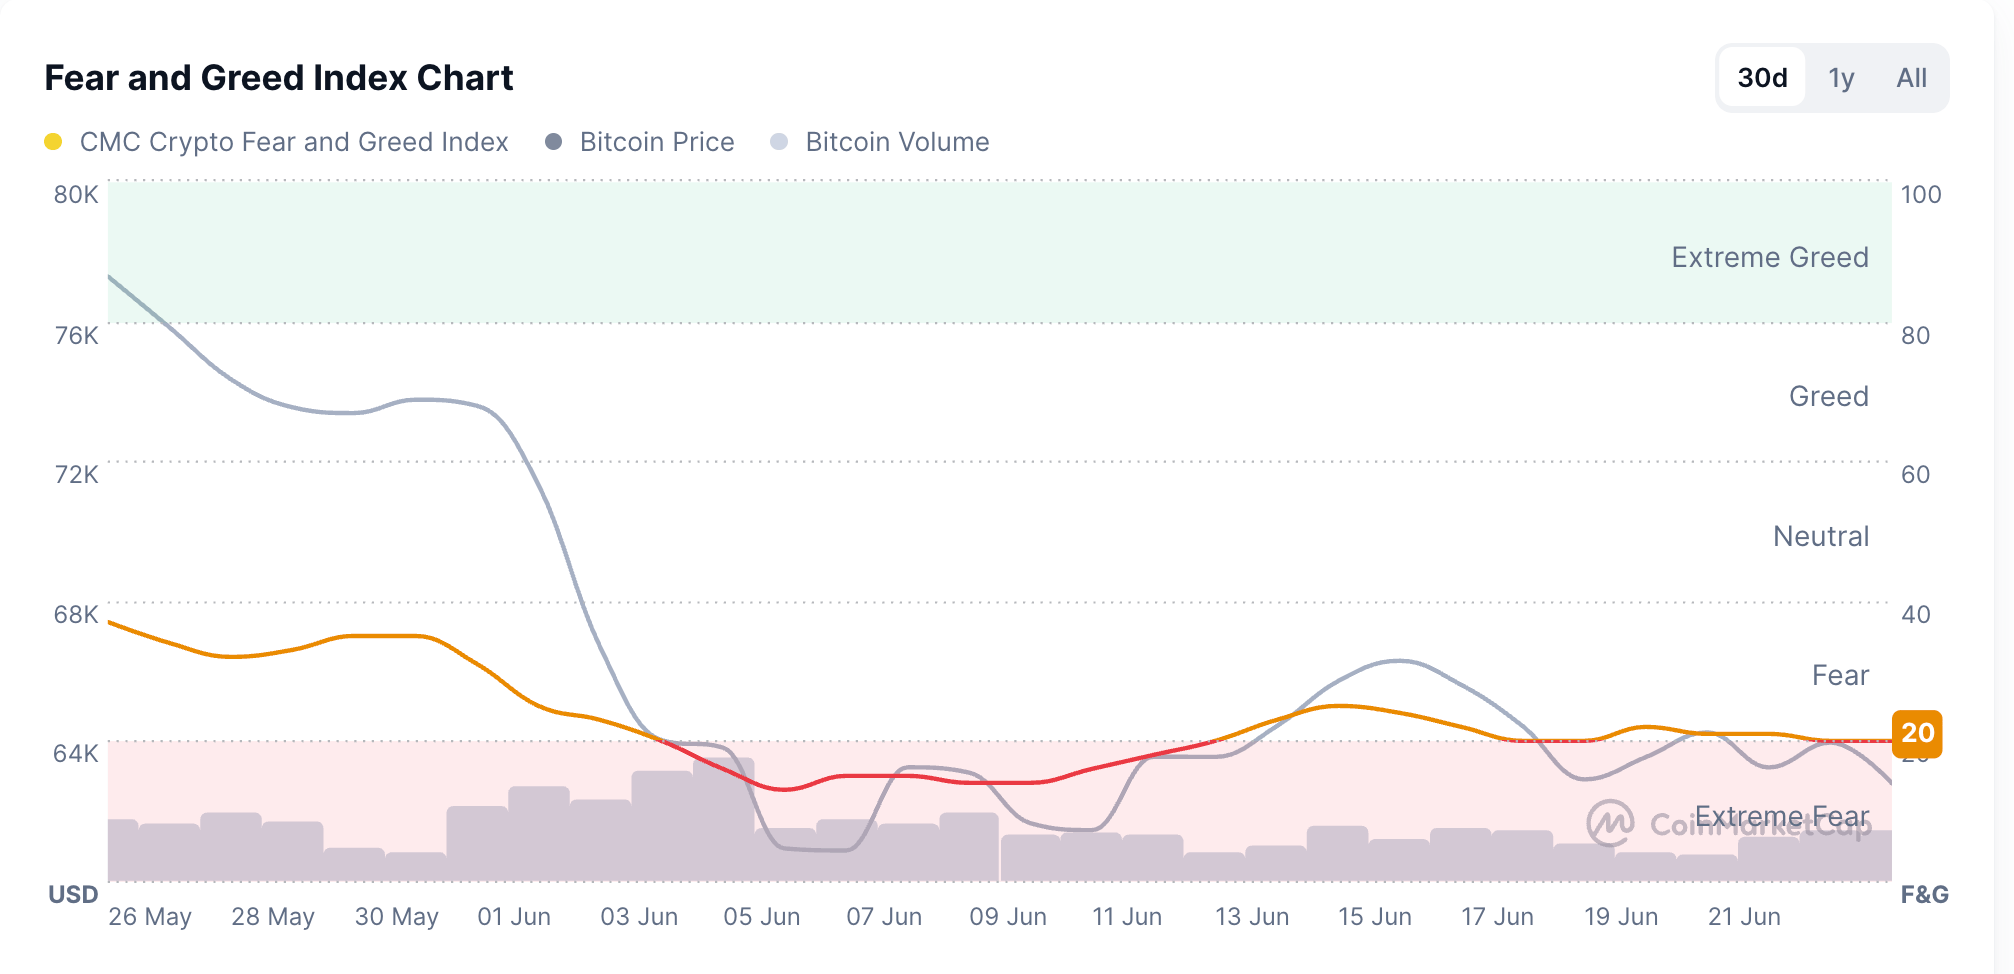
CoinGlass data shows total liquidations in the crypto market reached $550 million over the last 24 hours, led by $480 million in long liquidations, suggesting a clear sell-side inclination among investors. Corroborating the intensifying risk-averse sentiment among investors, CoinMarketCap’s Fear and Greed Index slips to 20, entering the “Extreme Fear” zone.
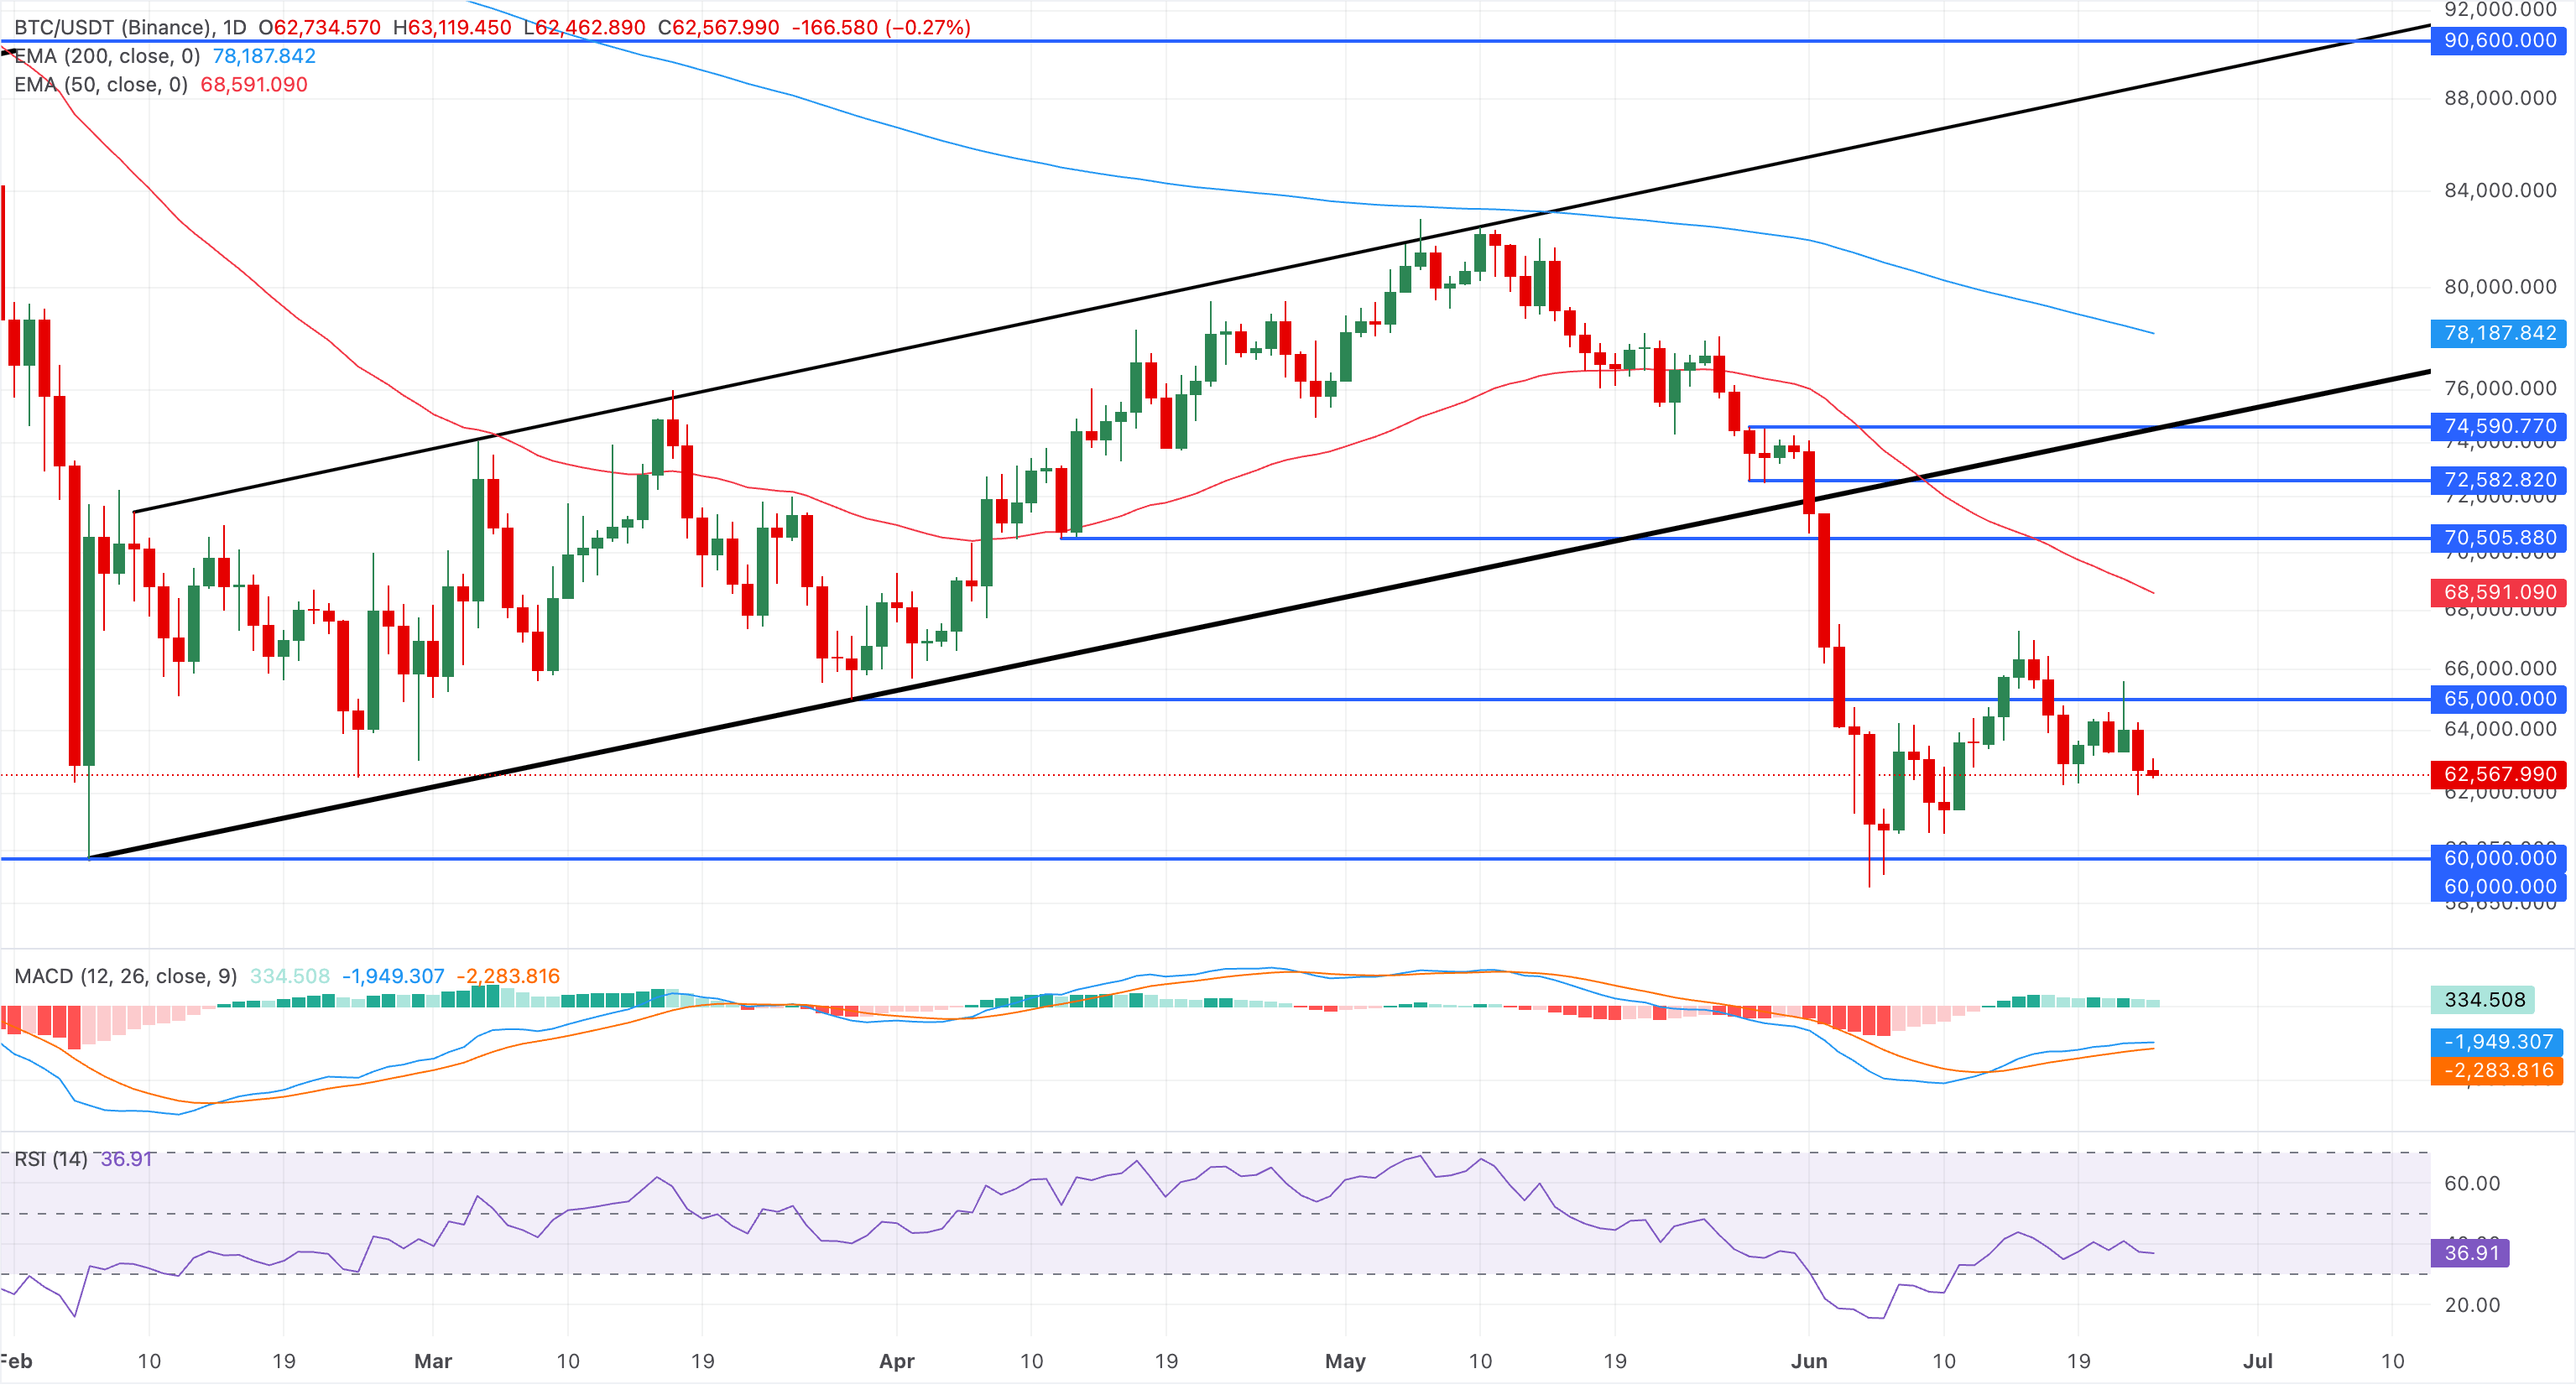
Bitcoin shaves off minor recovery below $63,000
Bitcoin holds a bearish bias in the near-term following a 2% decline on Tuesday. At the time of writing, BTC edges lower, extending its decline toward the $60,000 psychological level. From a technical perspective, Bitcoin remains below the former support trendline break near $73,539, as well as the 50- and 200-day Exponential Moving Averages (EMAs) at $68,591 and $78,187.
That said, the Moving Average Convergence Divergence (MACD) maintains a positive slope above its signal line, as histograms contract, hinting at fading bearish momentum rather than a decisive recovery. At the same time, the Relative Strength Index (RSI) at 36 keeps directional pressure tilted to the downside but no longer in outright oversold conditions.
On the downside, immediate demand is concentrated around the psychological and structural floor at $60,000, where the prior upward support trendline originated, and a horizontal support level converges.
On the topside, any bounce would first need to overcome the 50-day EMA at $68,591 to ease the bearish tone, with the MACD suggesting that rallies could struggle unless buyers reclaim the former support-turned-resistance zone.
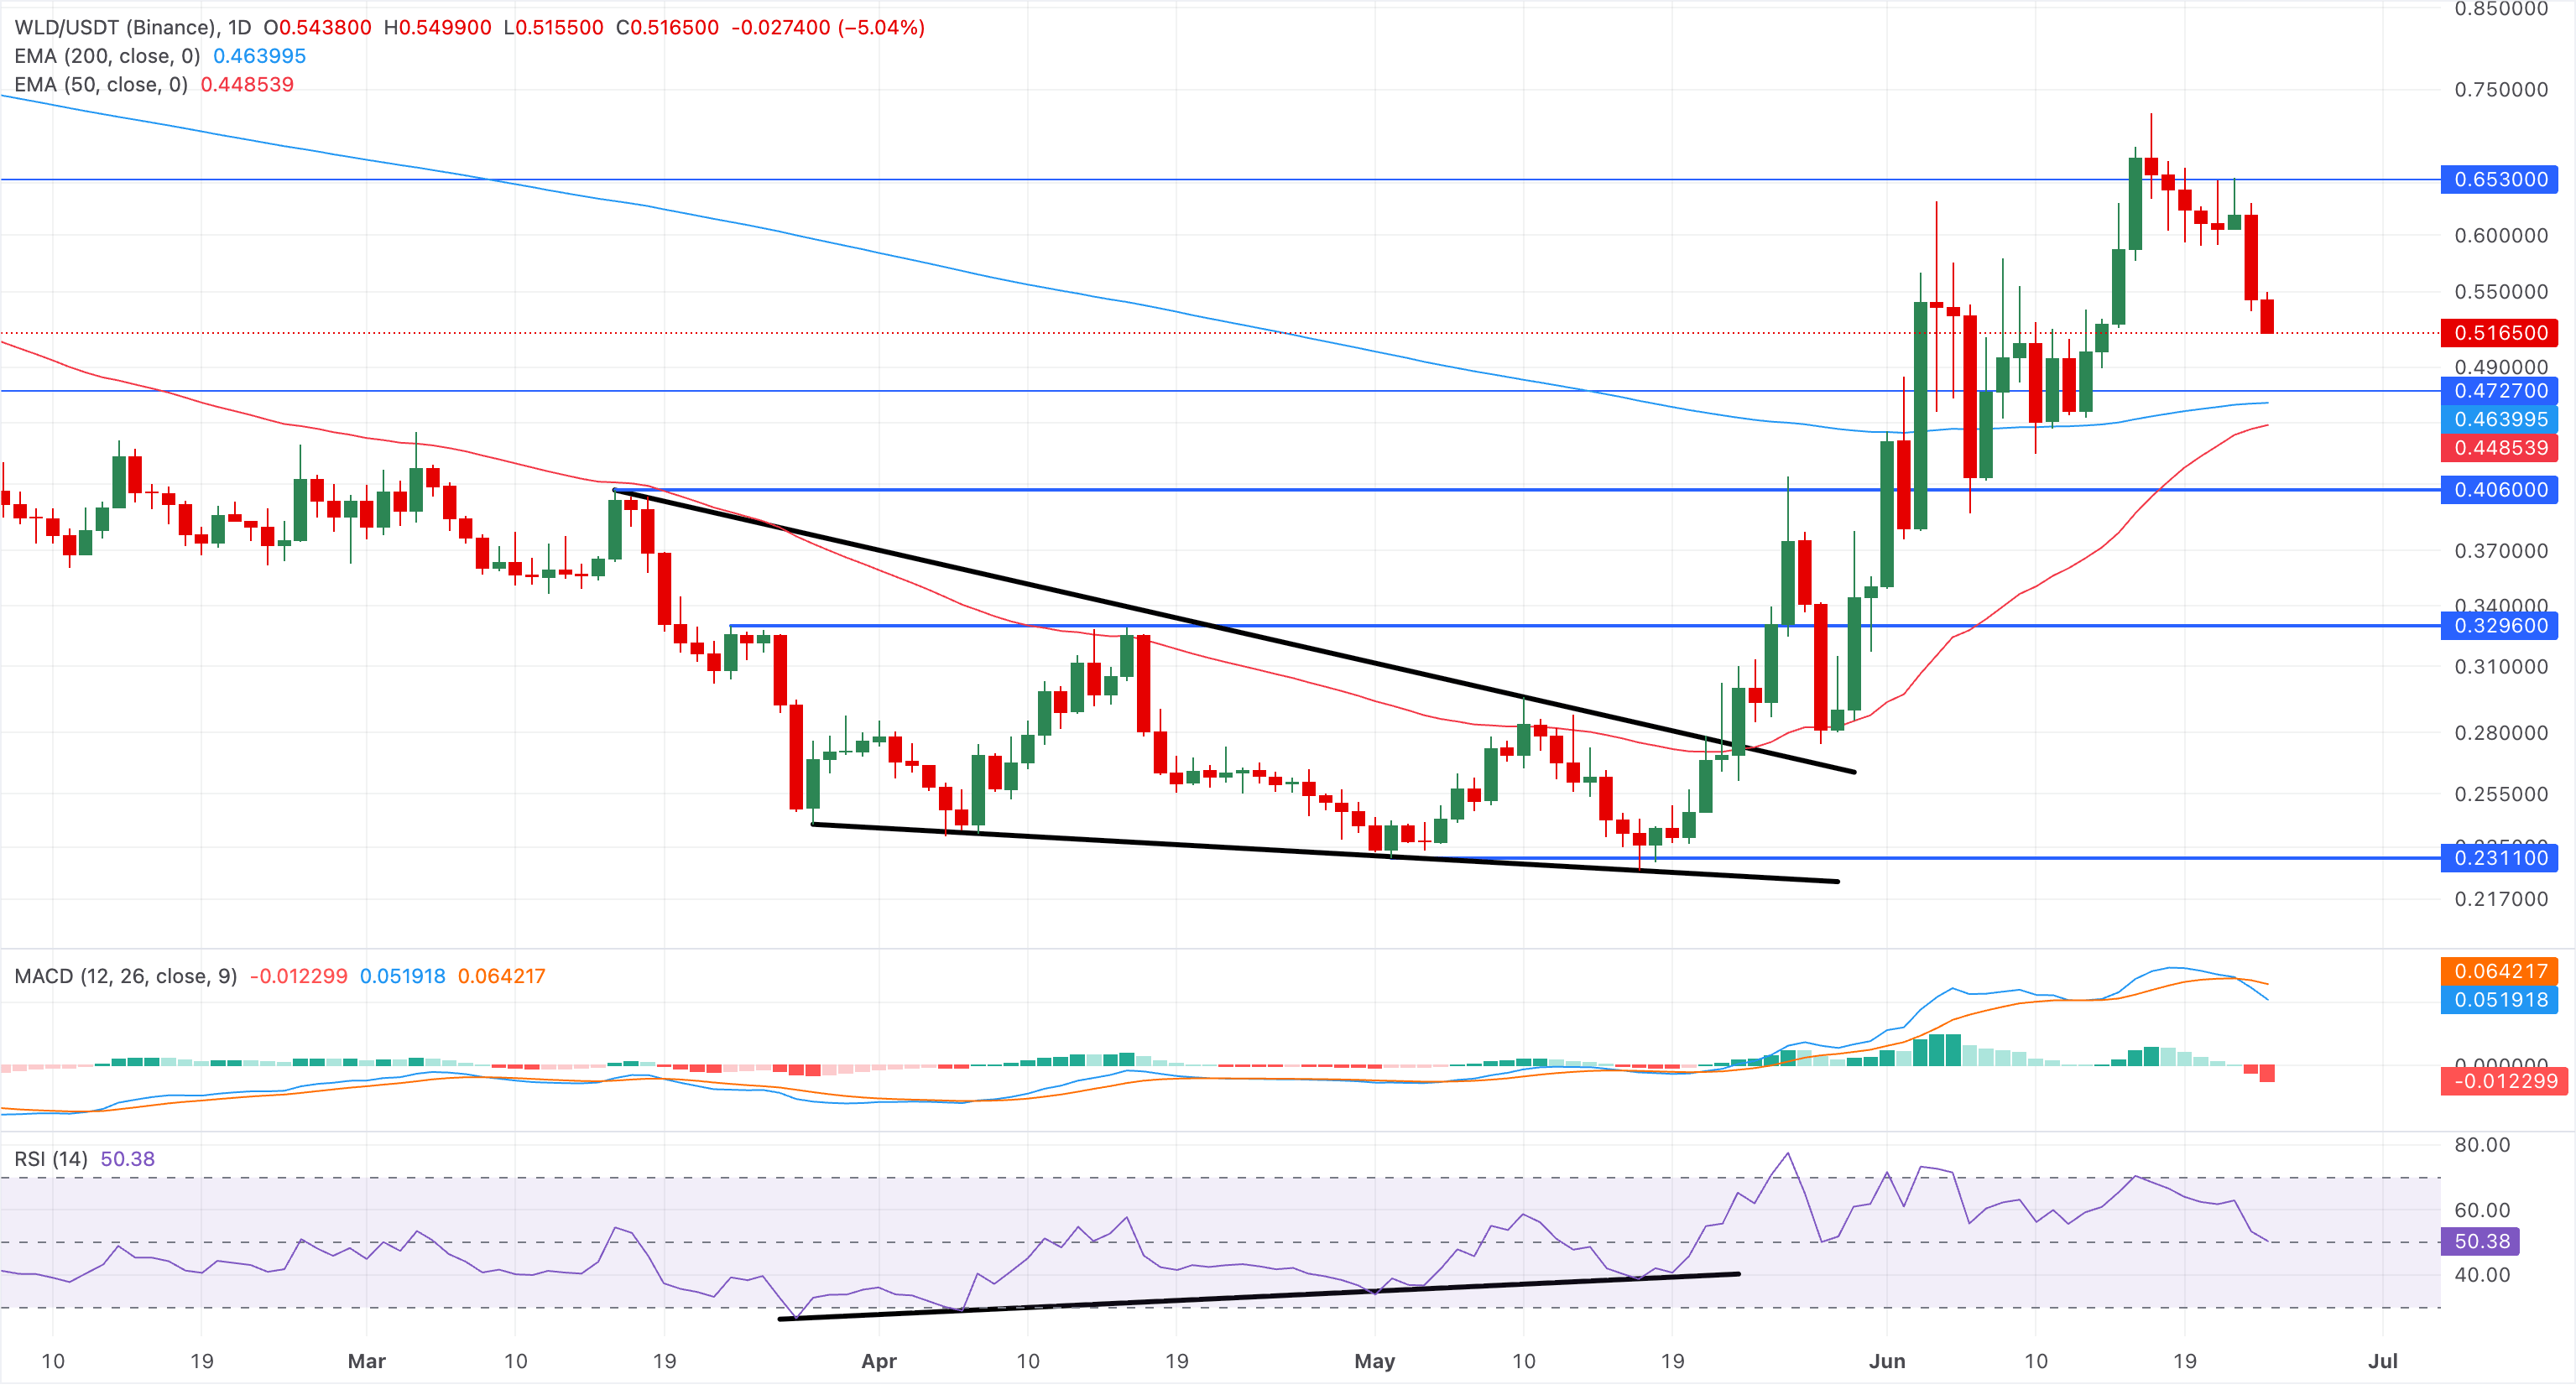
Worldcoin and Venice Token flash a bearish signal
Worldcoin is down 5% at press time on Wednesday, extending its 12% drop from the previous day. Price action reflects a short-term correction phase, following the June 17 high at $0.7229, shifting away from the prevailing recovery phase.
Momentum is modest but constructive, with the RSI at 50 falling toward the midline and the MACD crossing below its signal line, hinting that selling pressure is gradually intensifying.
Looking down, immediate support is seen at the $0.5000 psychological support, followed by the 200-day EMA at $0.4639. As long as WLD holds above this zone, the bias remains tilted to the upside, and any dips toward that area are likely to attract buyers seeking continuation of the emerging bullish pattern.
Venice Token extends over 2% loss on Wednesday, following a 10% drop the previous day. VVV keeps a bearish near-term tone after slipping well below the previously supportive rising trendline, now turned resistance around $18.64.
The MACD histogram remains negative, while the latest Relative Strength Index (RSI) reading near 42 remains in bearish territory but above oversold levels, suggesting sellers retain control even if immediate downside momentum is not extreme.
On the downside, the May 16 low at $12.47 remains a key support level, followed by the $10 psychological threshold and the 200-day EMA at $9.20.
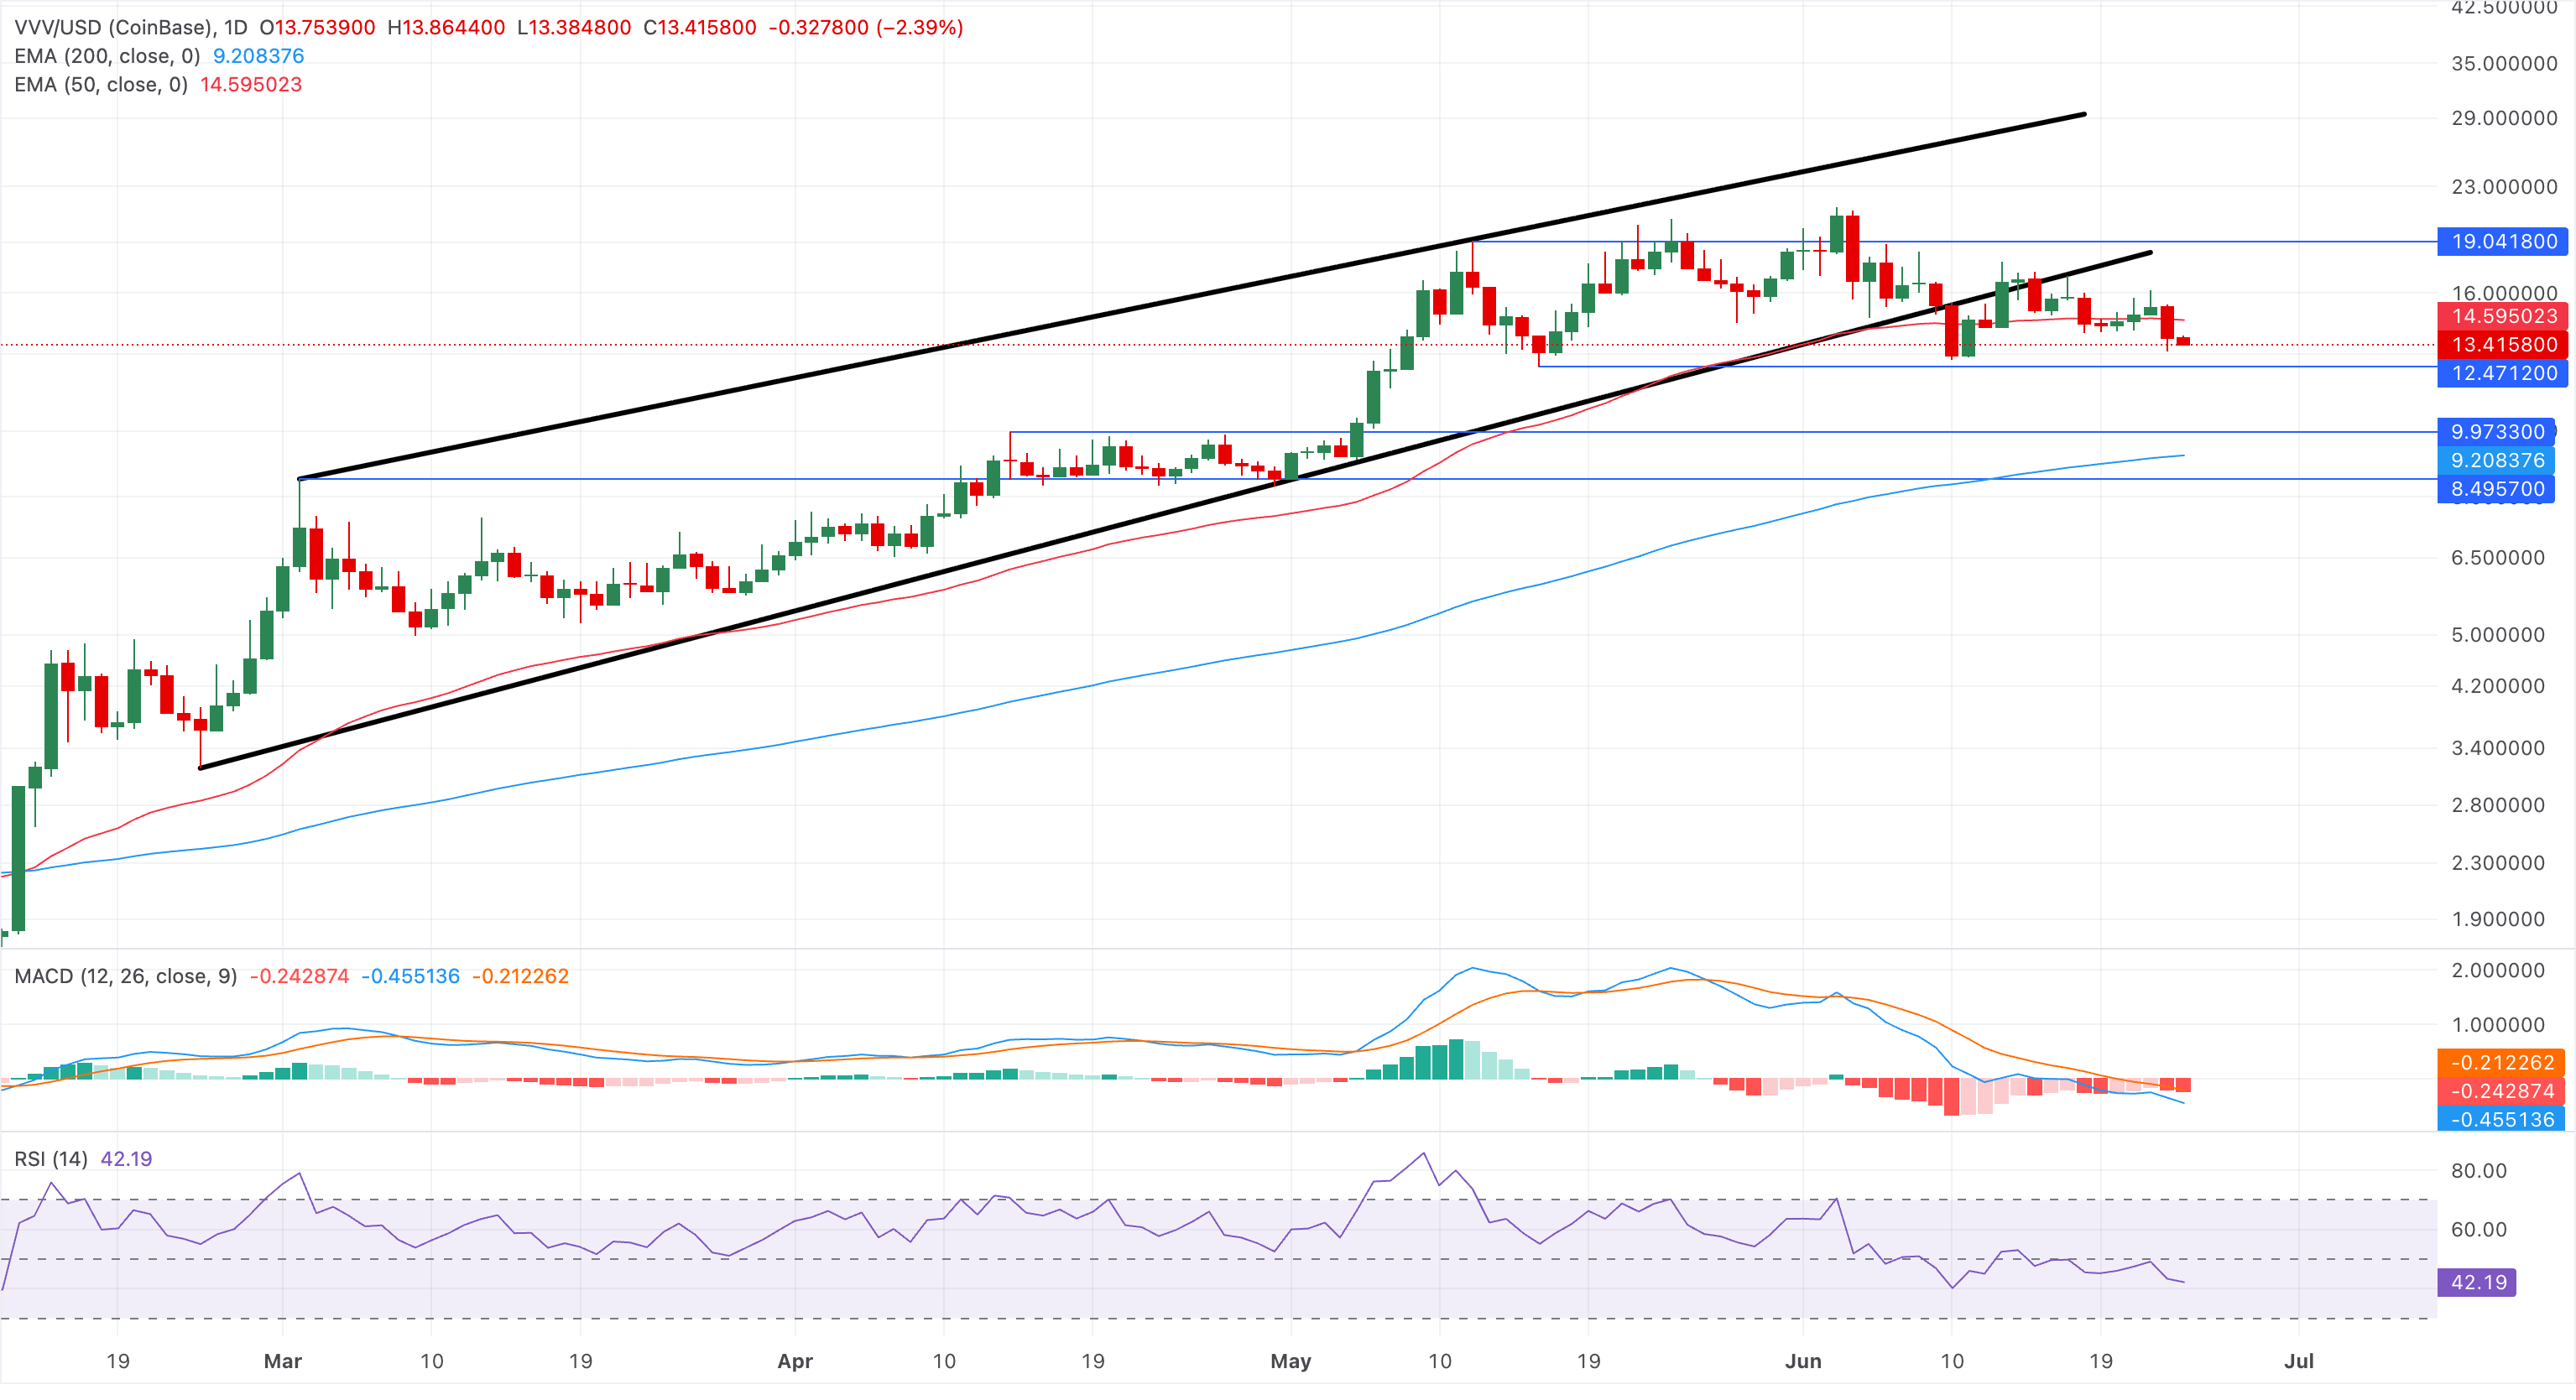
On the topside, the reclaimed break level of the former upward support trendline at $18.64 emerges as the next meaningful resistance that bulls would need to regain to challenge the broader downbeat structure.
(The technical analysis of this story was written with the help of an AI tool.)

Higit sa isang milyong user ang umaasa sa FXStreet para sa real-time market data, charting tools, expert insights, at Forex news. Ang komprehensibong economic calendar at educational webinars nito ay tumutulong sa mga trader na manatiling may alam at gumawa ng kalkuladong mga desisyon. Sinusuportahan ang FXStreet ng humigit-kumulang 60 propesyonal sa pagitan ng Barcelona HQ at iba’t ibang rehiyon sa buong mundo.
Magbasa pa


