
Crypto Market Overview: Bitcoin Options flash red amid the Iran war – KAS, BCH, HYPE lead losses
Ni Vishal Dixit
Na-update: 30 Mar 2026


Sikat na Artikulo

Bitcoin (BTC) starts the week on a bullish note during early Asian hours on Monday, approaching the $67,000 mark. However, the ongoing US-Iran war fuels price surges in oil, aluminium, and other metals amid the threat of US forces being deployed on the ground.
- Bitcoin recovers above $66,000 on Monday, while persisting downside pressure weighs down on top altcoins.
- Bitcoin Options data signals possible consolidation between $60,000 and $70,000, while ETFs recorded net outflows last week.
- Kaspa, Bitcoin Cash, and Hyperliquid lead losses as the broader sentiment falters.
Bitcoin (BTC) starts the week on a bullish note during early Asian hours on Monday, approaching the $67,000 mark. However, the ongoing US-Iran war fuels price surges in oil, aluminium, and other metals amid the threat of US forces being deployed on the ground.
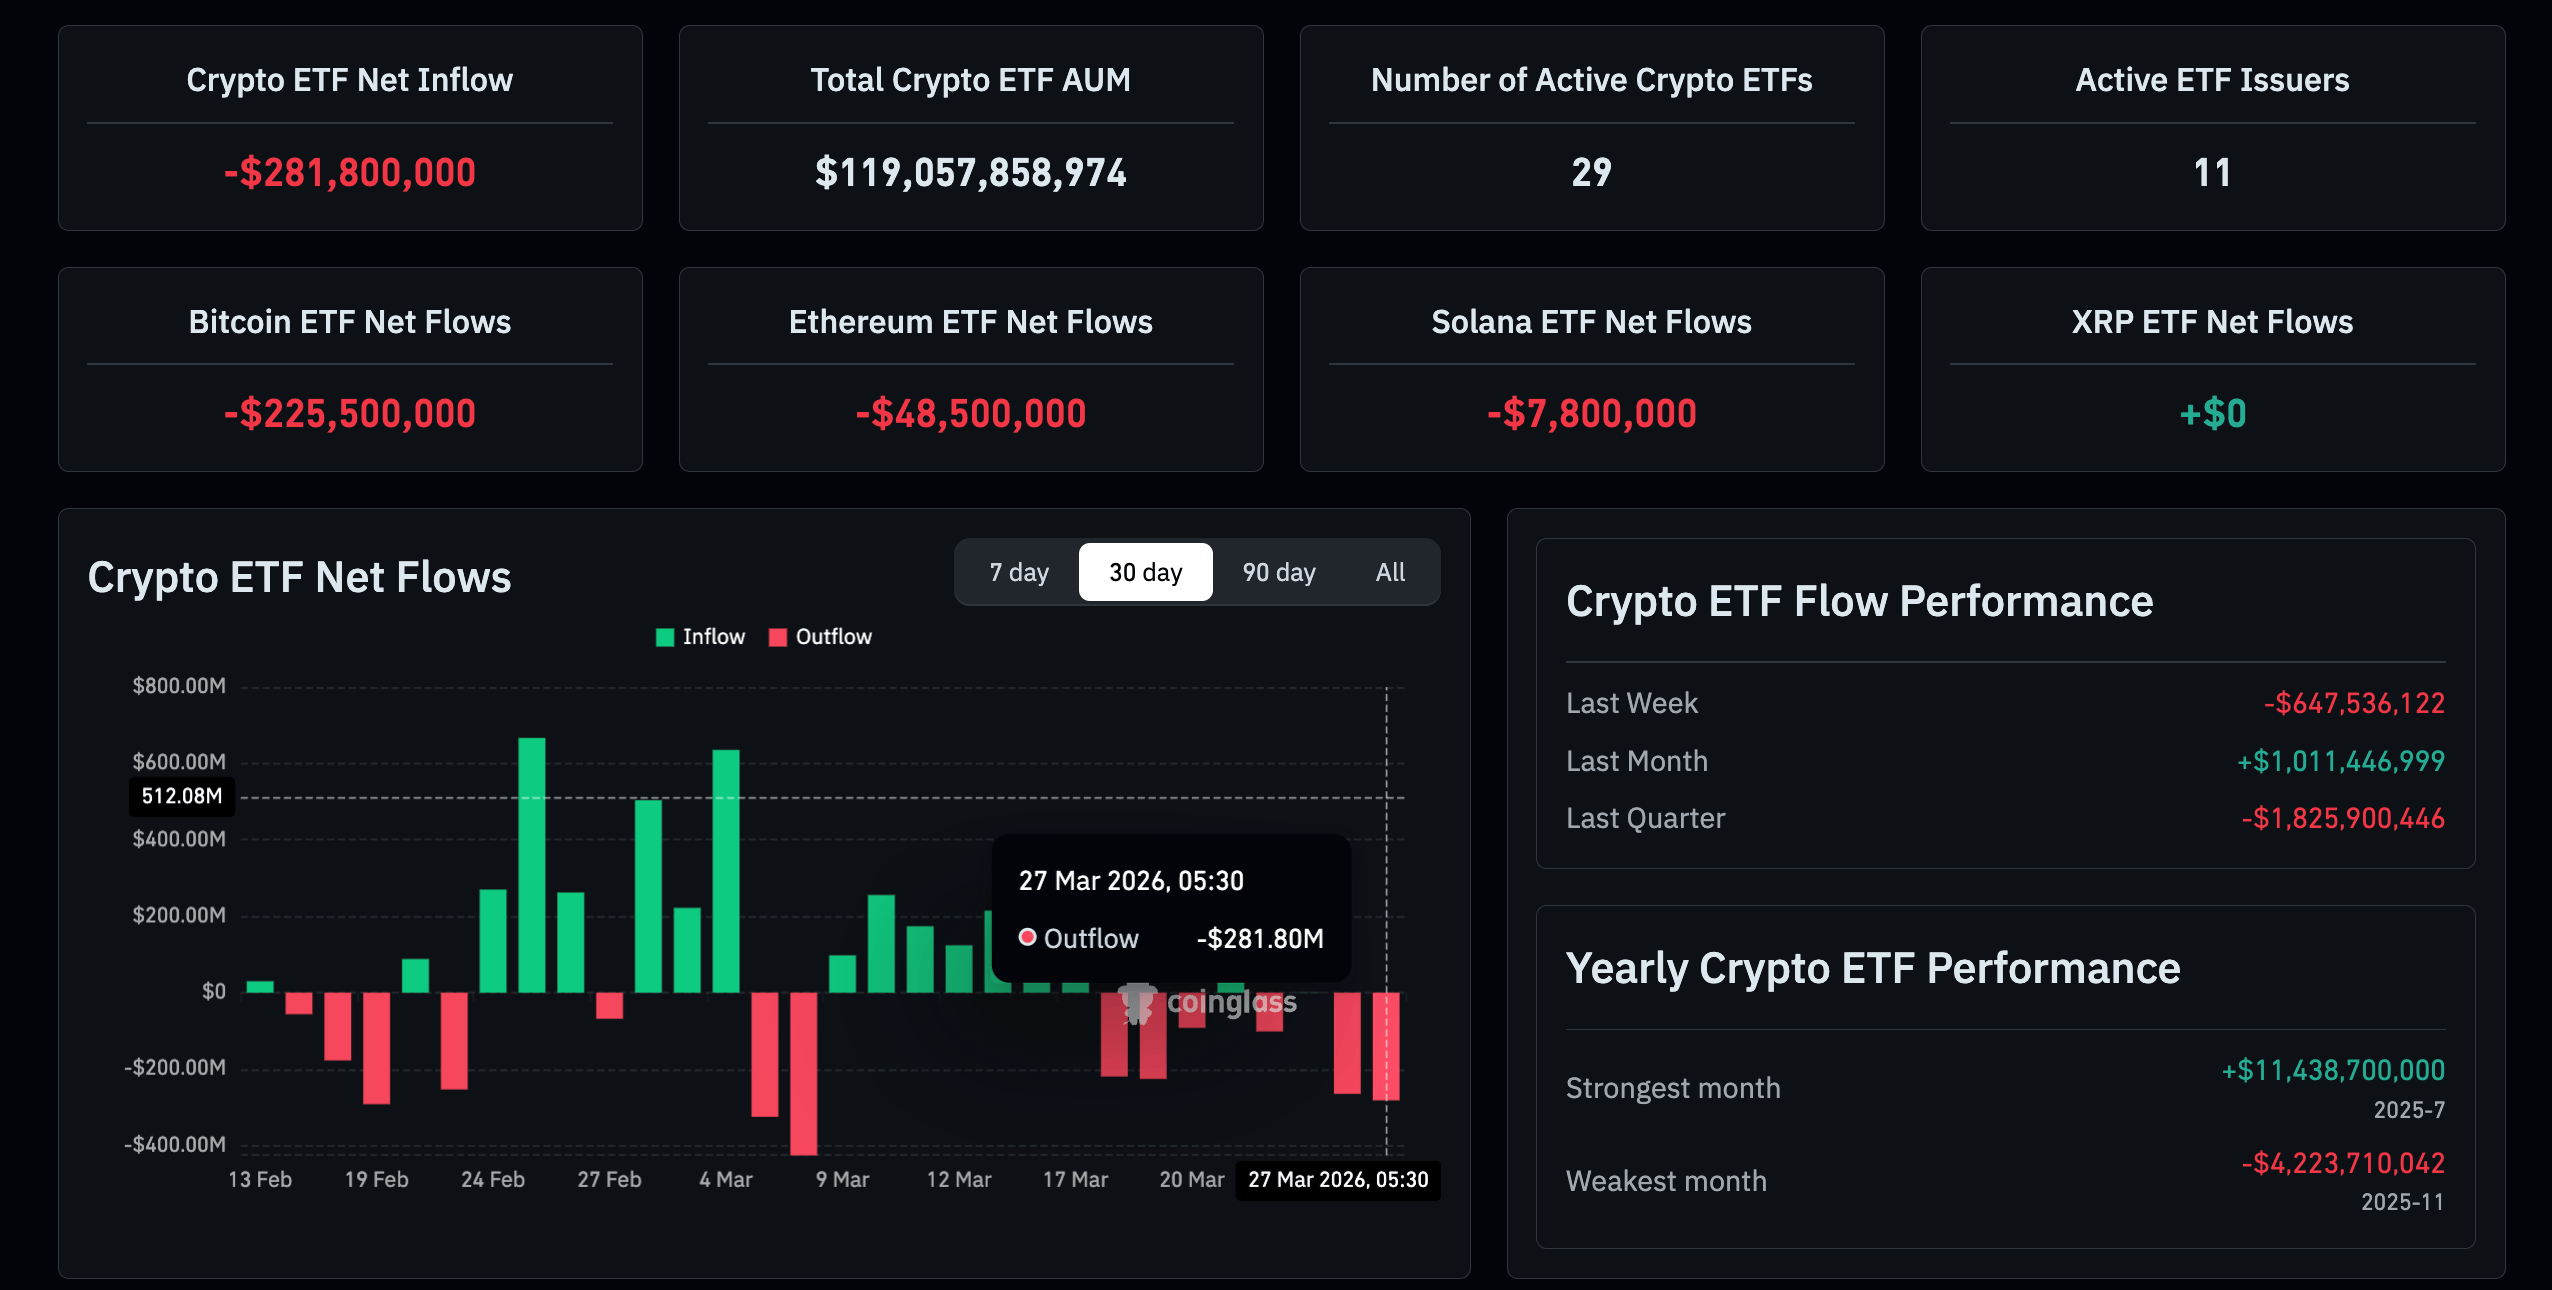
Bitcoin Options data shows positional buildup around $60,000 and $70,000, which could act as boundary levels consolidating the spot prices. Meanwhile, the crypto-focused Exchange Traded Funds (ETFs) recorded $650 million in outflows last week, reflecting a weakness in institutional demand.
Amid such conditions, Kaspa (KAS), Bitcoin Cash (BCH), and Hyperliquid (HYPE) are leading losses over the last 24 hours.
Downside pressure looms over the crypto market
Bitcoin’s recovery toward $67,000 at press time on Monday reflects a minor upside move amid a broadly downward trend, which has resulted in a roughly 10% drop over the last two weeks. Ethereum (ETH) clings to its $2,000 psychological support level, while Ripple (XRP) struggles to hold above $1.34.
Retail sentiment is gripped by fear, as CoinMarketCap’s Fear and Greed Index remains at 25. If the US-Iran war escalates into an on-the-ground military confrontation, downside pressure could push this index below 20, reflecting extreme fear in the market.
Additionally, CoinGlass data indicates weakness in institutional demand for crypto, while the derivatives market shows a positional buildup around key Bitcoin levels. The crypto ETFs recorded $281.80 million in outflows on Friday, led by $225.50 million in Bitcoin ETFs, bringing weekly outflows to $647 million across all crypto ETFs.
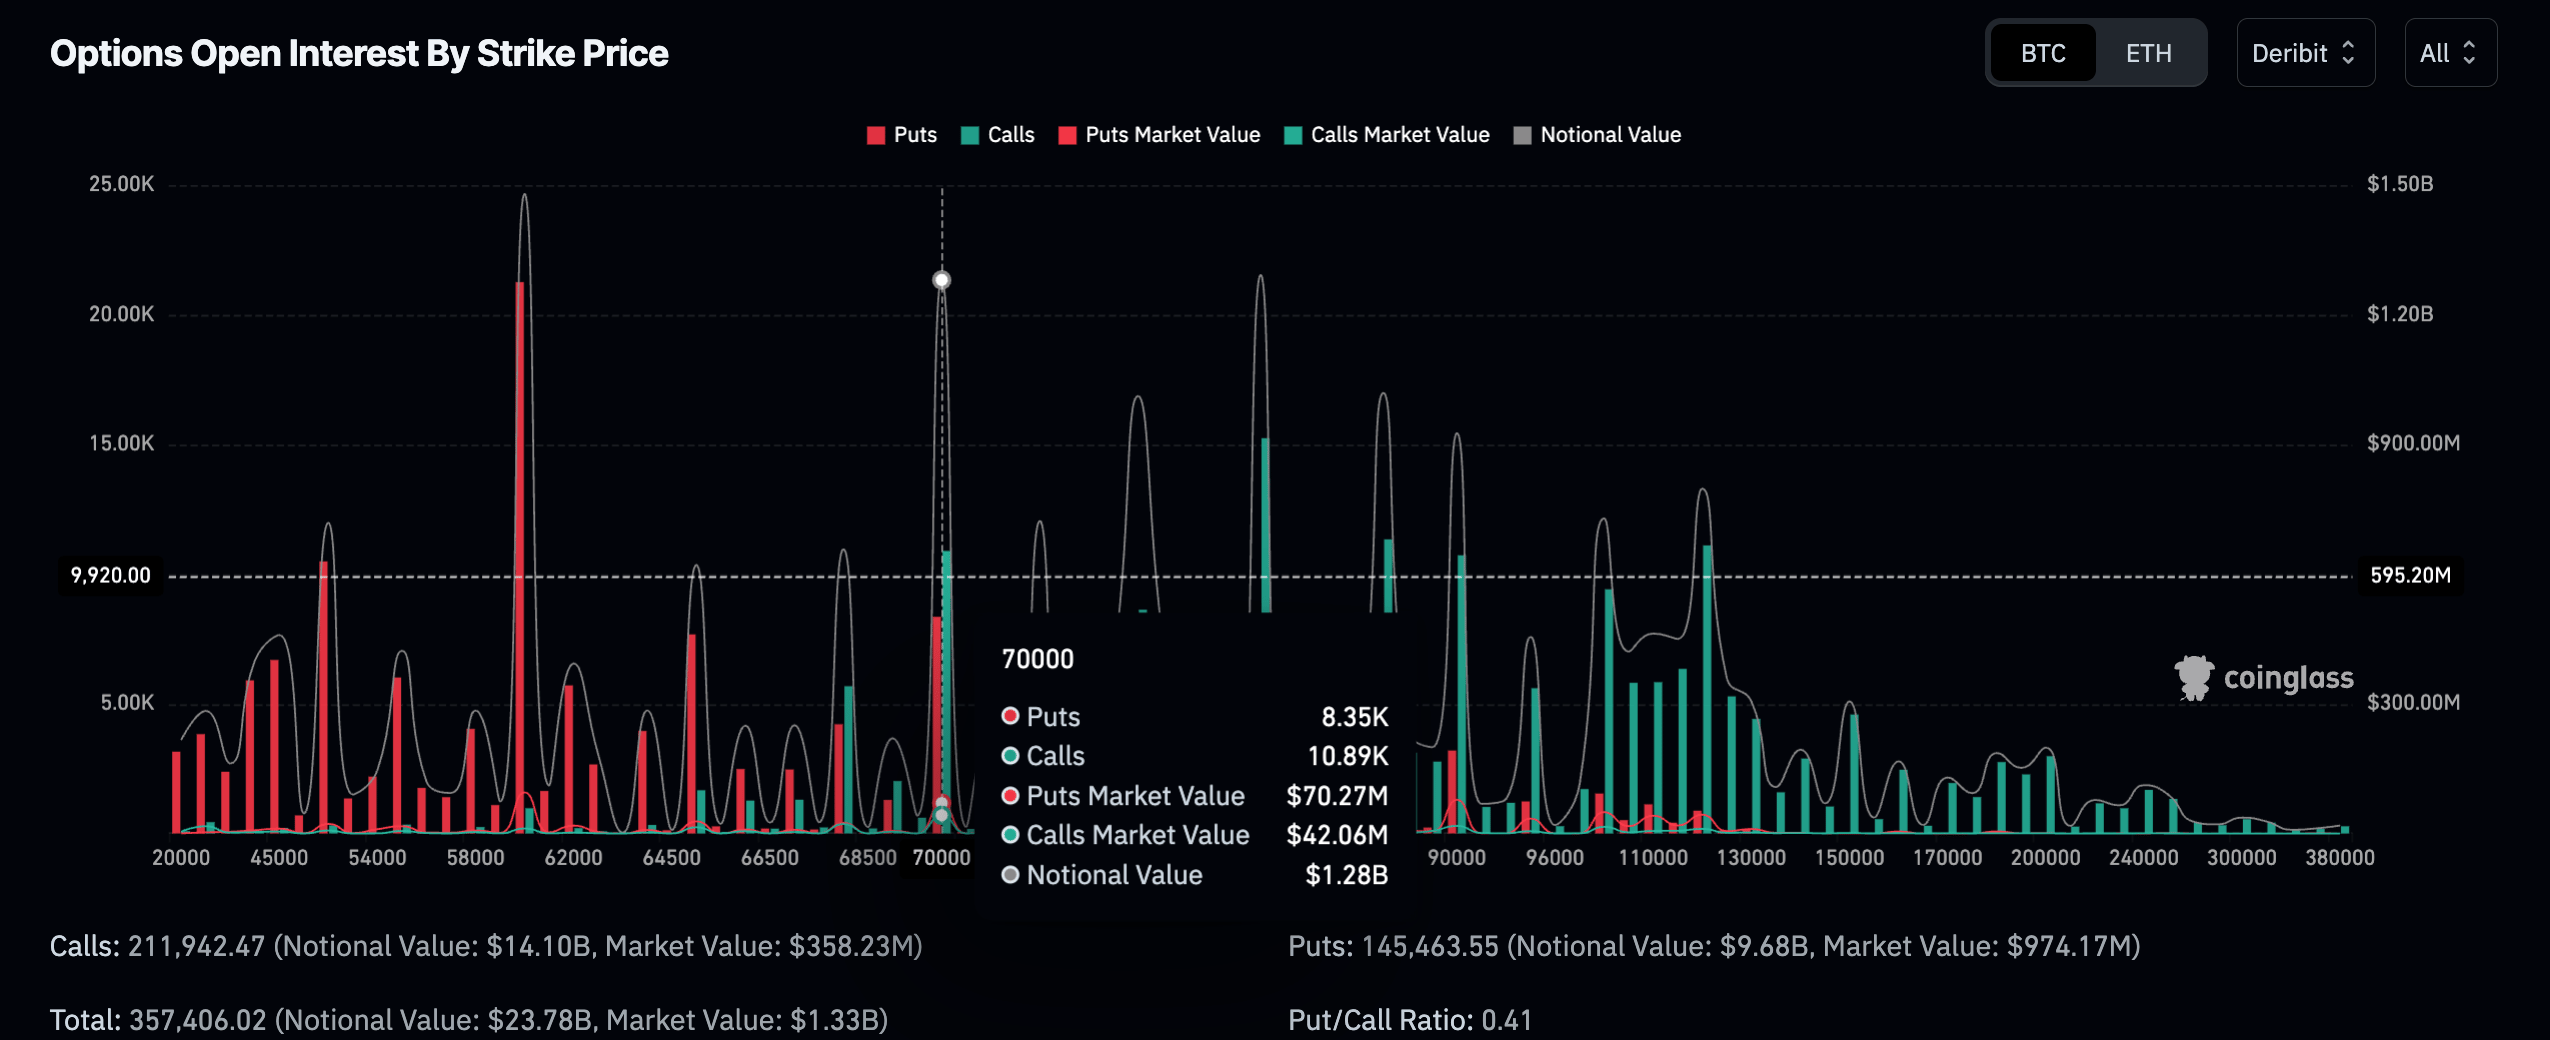
Meanwhile, the Bitcoin Options by strike price data shows 21,290 put positions active at $60,000 and 10,890 call positions at $70,000, cementing two key boundary levels. These massive bets could catalyse either side's breakout in the spot market.
However, the call buildup at $70,000 is worth $44.32 million, which is lower than the put positions at the same strike price of $69.77 million, suggesting an overall bearish tilt at the upper boundary.
On the other hand, the put buildup at $60,000 is worth $91.74 million, outpacing the calls of $11.59 million. The value difference reflects a clear bearish bias among derivatives traders.
Top Losers: KAS, BCH, and HYPE at crucial crossroads
Kaspa trades below $0.03300 at press time on Monday, down 5% from the previous day. The near‑term bias turns mildly bearish after the pair slipped back below the broken descending resistance line, with price now capped beneath the trend break area near $0.0325–$0.0330.
The recent pullback from the $0.0395 spike has dragged spot price under the 50-day Exponential Moving Average (EMA) at $0.0343, reinforcing downside pressure, while the 100- and 200-day EMAs above $0.0380 and $0.0470 maintain a broader corrective context.
The Moving Average Convergence Divergence (MACD) indicator has crossed below its signal line, with a negative histogram, suggesting bearish momentum is building. The Relative Strength Index (RSI) at 45 has retreated from overbought readings above 70, consistent with fading upside momentum and scope for further consolidation to the downside.
On the downside, immediate support emerges at the recent reaction low near $0.0320, with a break lower exposing the late‑range trough around $0.0305, followed by stronger chart support at $0.0295.
Initial resistance aligns at the 50-day EMA at $0.03423, and a daily close above this zone would be needed to ease immediate bearish pressure and reopen the next upside hurdle at the 100-day EMA at $0.03827.
On the other hand, Bitcoin Cash holds ground at $450 with a minor recovery at the time of writing on Monday. The near-term bias stays bearish as price holds well below the 50-, 100-, and 200-day EMAs, keeping the broader downtrend intact. Initial resistance emerges near the 50-day EMA at $487.
The MACD line has rolled over toward the signal line while both remain just below the zero mark, suggesting fading upside momentum after the recent bounce. The RSI at 44 reinforces this weak tone, showing only modest recovery from prior oversold conditions rather than sustained bullish pressure.
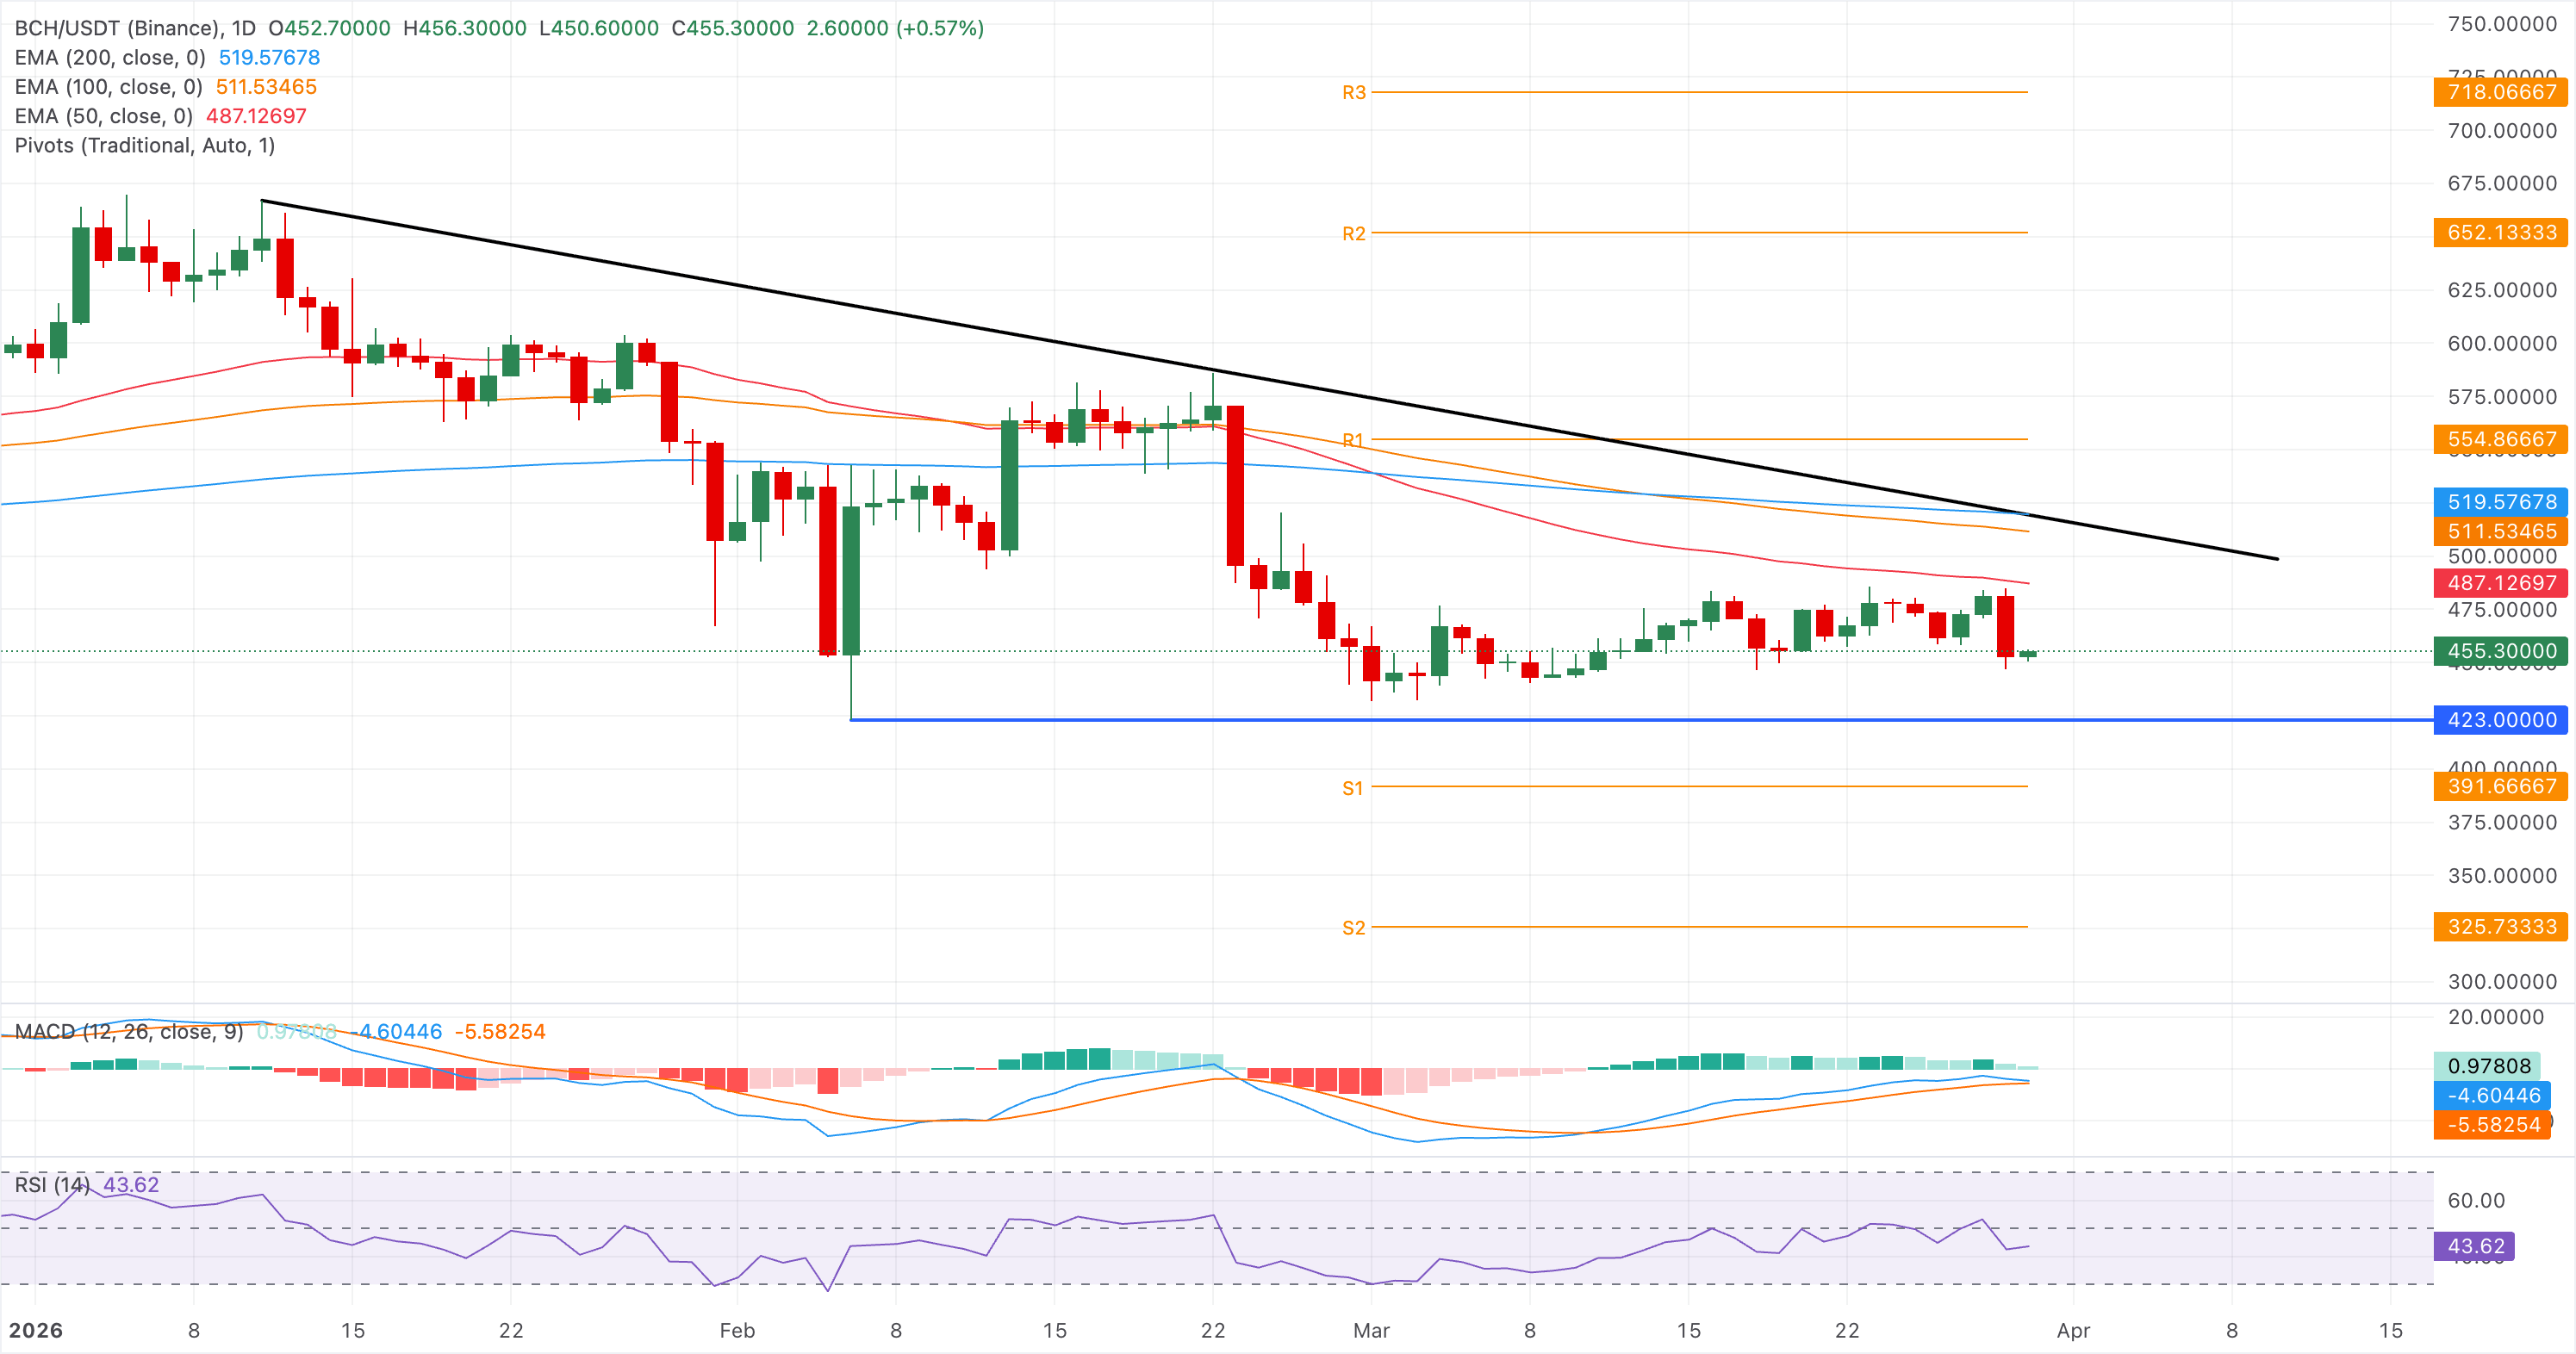
The key support for BCH lies at the February 6 low at $423, capping the downside below the $400 psychological level.
Meanwhile, Hyperliquid trades below $40 at press time on Monday, holding above the R1 Pivot Point at $37.86. The near-term tone is mildly bullish after the price reclaimed the crucial daily EMAs, while the 50-day EMA at $34.91 serves as the immediate support.
Momentum, however, is softening as the MACD slips below its signal line with the histogram in negative territory near the zero mark, and the Relative Strength Index cools to 53, showing fading upside pressure rather than outright weakness.
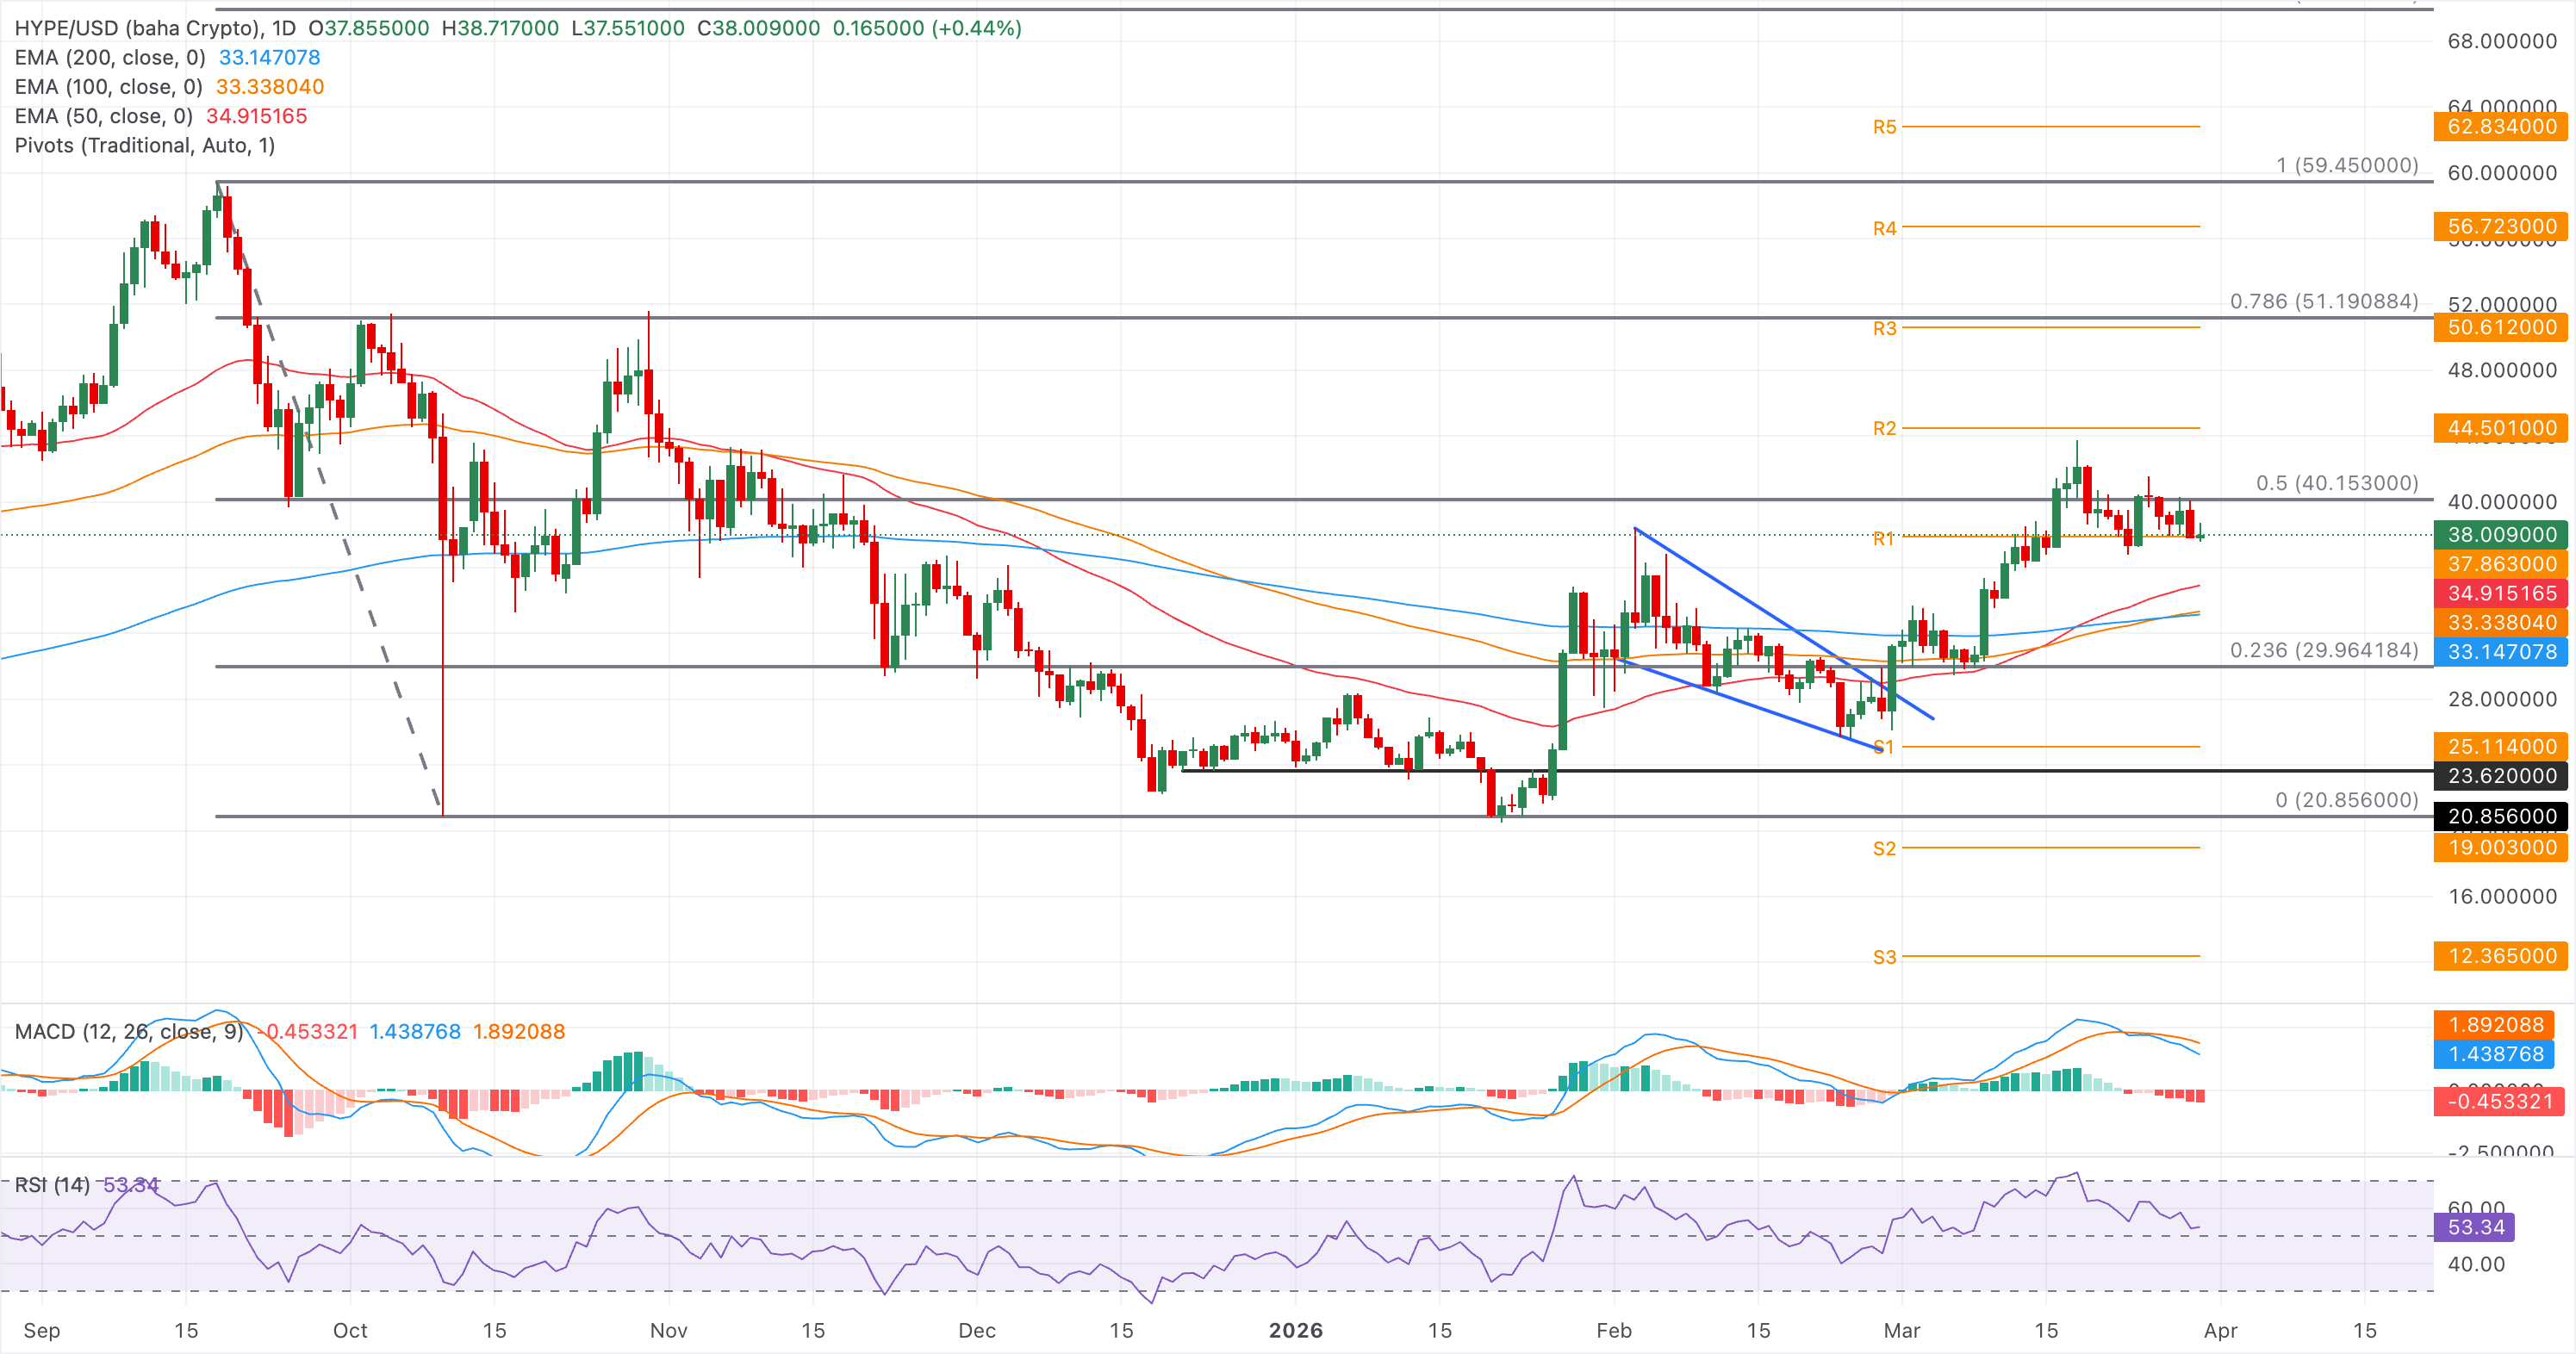
Looking up, Hyperliquid should surpass the 50% retracement of the slip from $59.45 to $20.86 at $40.15, acting as the first resistance cap ahead of the recent highs. A sustained break above this level would open the way toward the R2 Pivot Point at $44.50.
(The technical analysis of this story was written with the help of an AI tool.)

Higit sa isang milyong user ang umaasa sa FXStreet para sa real-time market data, charting tools, expert insights, at Forex news. Ang komprehensibong economic calendar at educational webinars nito ay tumutulong sa mga trader na manatiling may alam at gumawa ng kalkuladong mga desisyon. Sinusuportahan ang FXStreet ng humigit-kumulang 60 propesyonal sa pagitan ng Barcelona HQ at iba’t ibang rehiyon sa buong mundo.
Magbasa pa


