
Crypto Market Overview: Bitcoin tops $75,000 while Zcash, Pepe, and Polkadot lead the rally
Ni Vishal Dixit
Petsa ng Pag-publish: 17 Mar 2026 | Petsa ng Pag-edit: 17 Mar 2026


Sikat na Artikulo

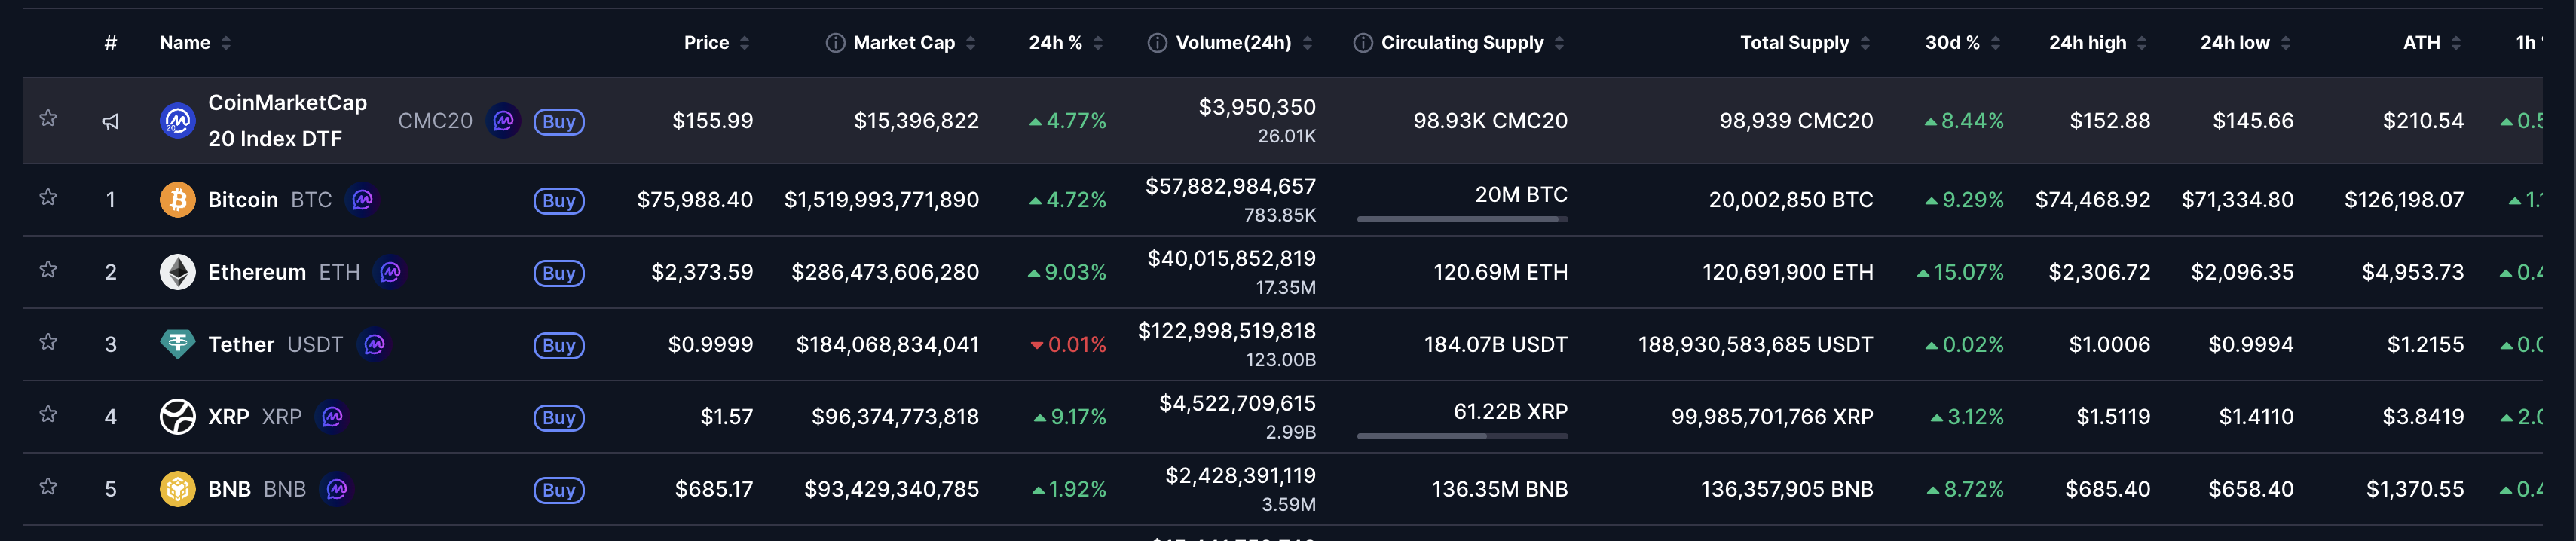
The broader cryptocurrency market extends its recovery amid the US-Iran war, with Bitcoin (BTC) topping $75,000 and Ethereum (ETH) and Ripple (XRP) crossing above $2,300 and $1.50, respectively.
- Bitcoin tops $75,000, Ethereum crosses $2,300 and Ripple exceeds $1.50 on Tuesday, extending gains as the Middle East war drags on.
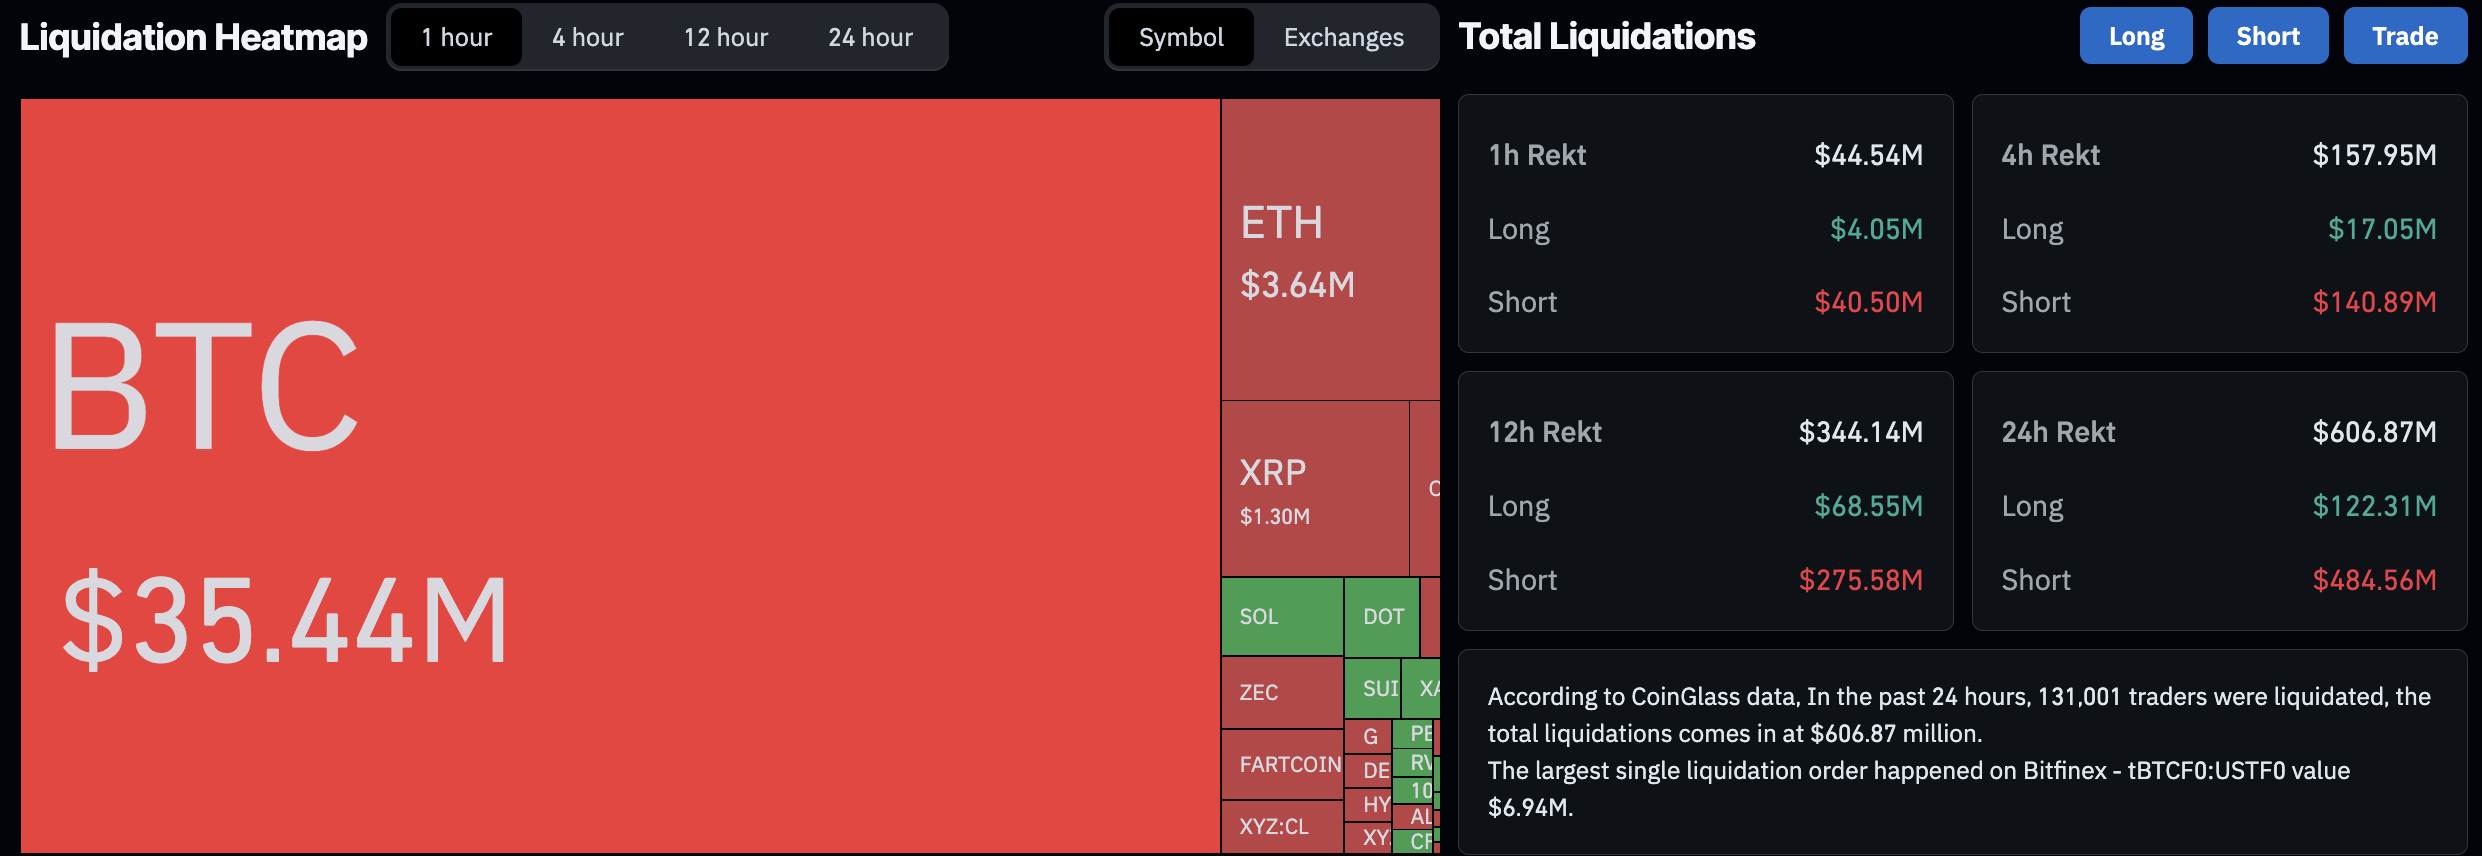
- Liquidations cross $600 million over the last 24 hours while the BTC Open Interest rises, skewing the near-term bias bullish.
- Zcash, Pepe, and Polkadot extend gains to emerge as top gainers over the last 24 hours.
The broader cryptocurrency market extends its recovery amid the US-Iran war, with Bitcoin (BTC) topping $75,000 and Ethereum (ETH) and Ripple (XRP) crossing above $2,300 and $1.50, respectively. Data shows over $600 million in total liquidations over the last 24 hours, driven mainly by the wipeout of short positions as renewed demand emerges in Bitcoin derivatives.
Amid these conditions, Zcash (ZEC), Pepe (PEPE), and Polkadot (DOT) rise as the top gainers over the last 24 hours.
Bitcoin above $75,000 triggers a short squeeze in motion
Bitcoin trades above $75,000 for the first time since the start of the Middle East war, lifting altcoins as well. At the time of writing, Ethereum and Ripple are above $2,300 and $1.50, respectively, on Tuesday, with over 9% gains in the last 24 hours, extending the fresh recovery.
The rebound in the cryptocurrency market has liquidated 131,000 traders, totaling $606 million in liquidations over the last 24 hours, led by $484 million in short liquidations.
Consistent with the wipeout of bearish positions, Bitcoin futures Open Interest (OI) is recovering, reaffirming a renewed risk-on sentiment. CoinGlass data shows BTC OI rising to $51.29 billion from $47.91 billion on Monday, suggesting a buildup in positions or increased leverage.
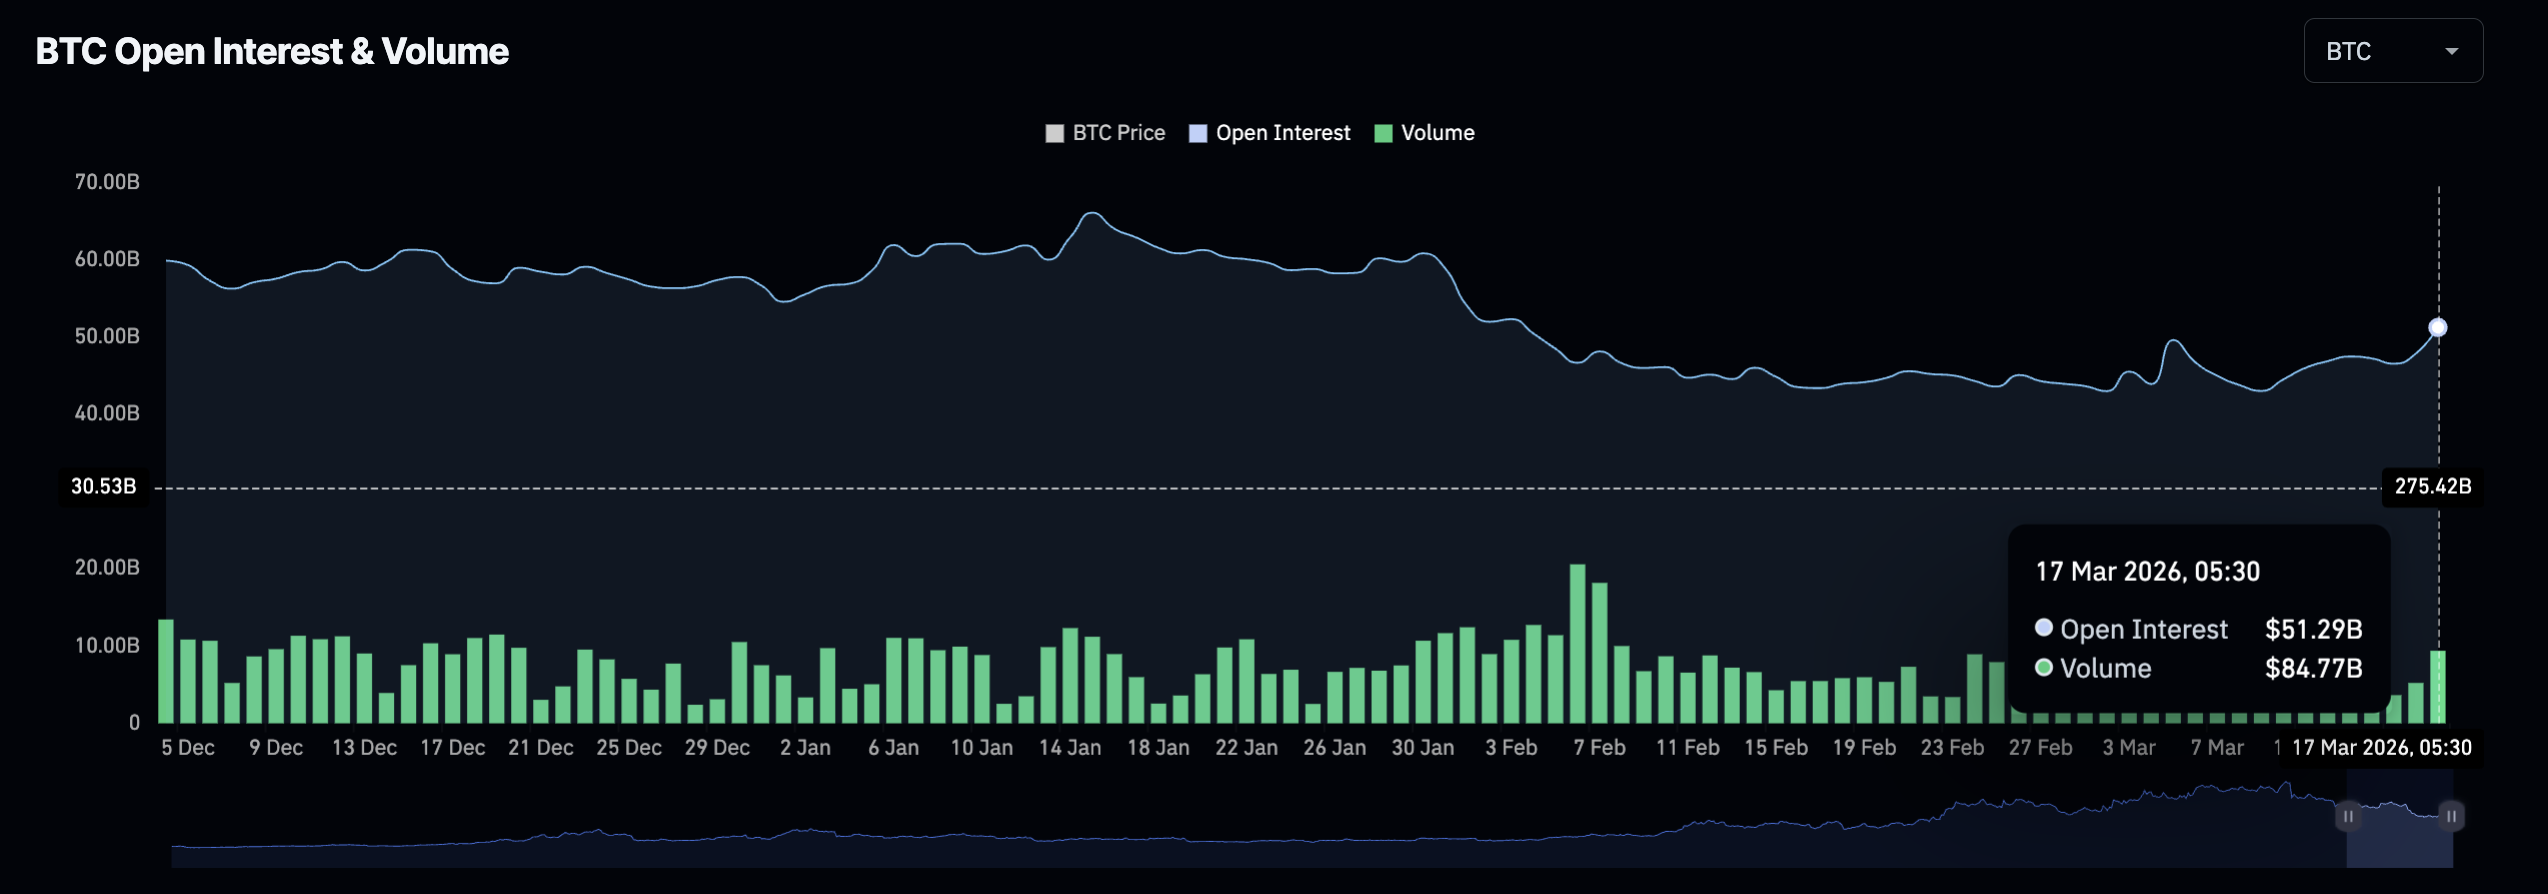
The recovery in Bitcoin prices aligns with the massive short liquidations in the market and is likely creating a positive loop, or a short squeeze, that amplifies upward pressure.
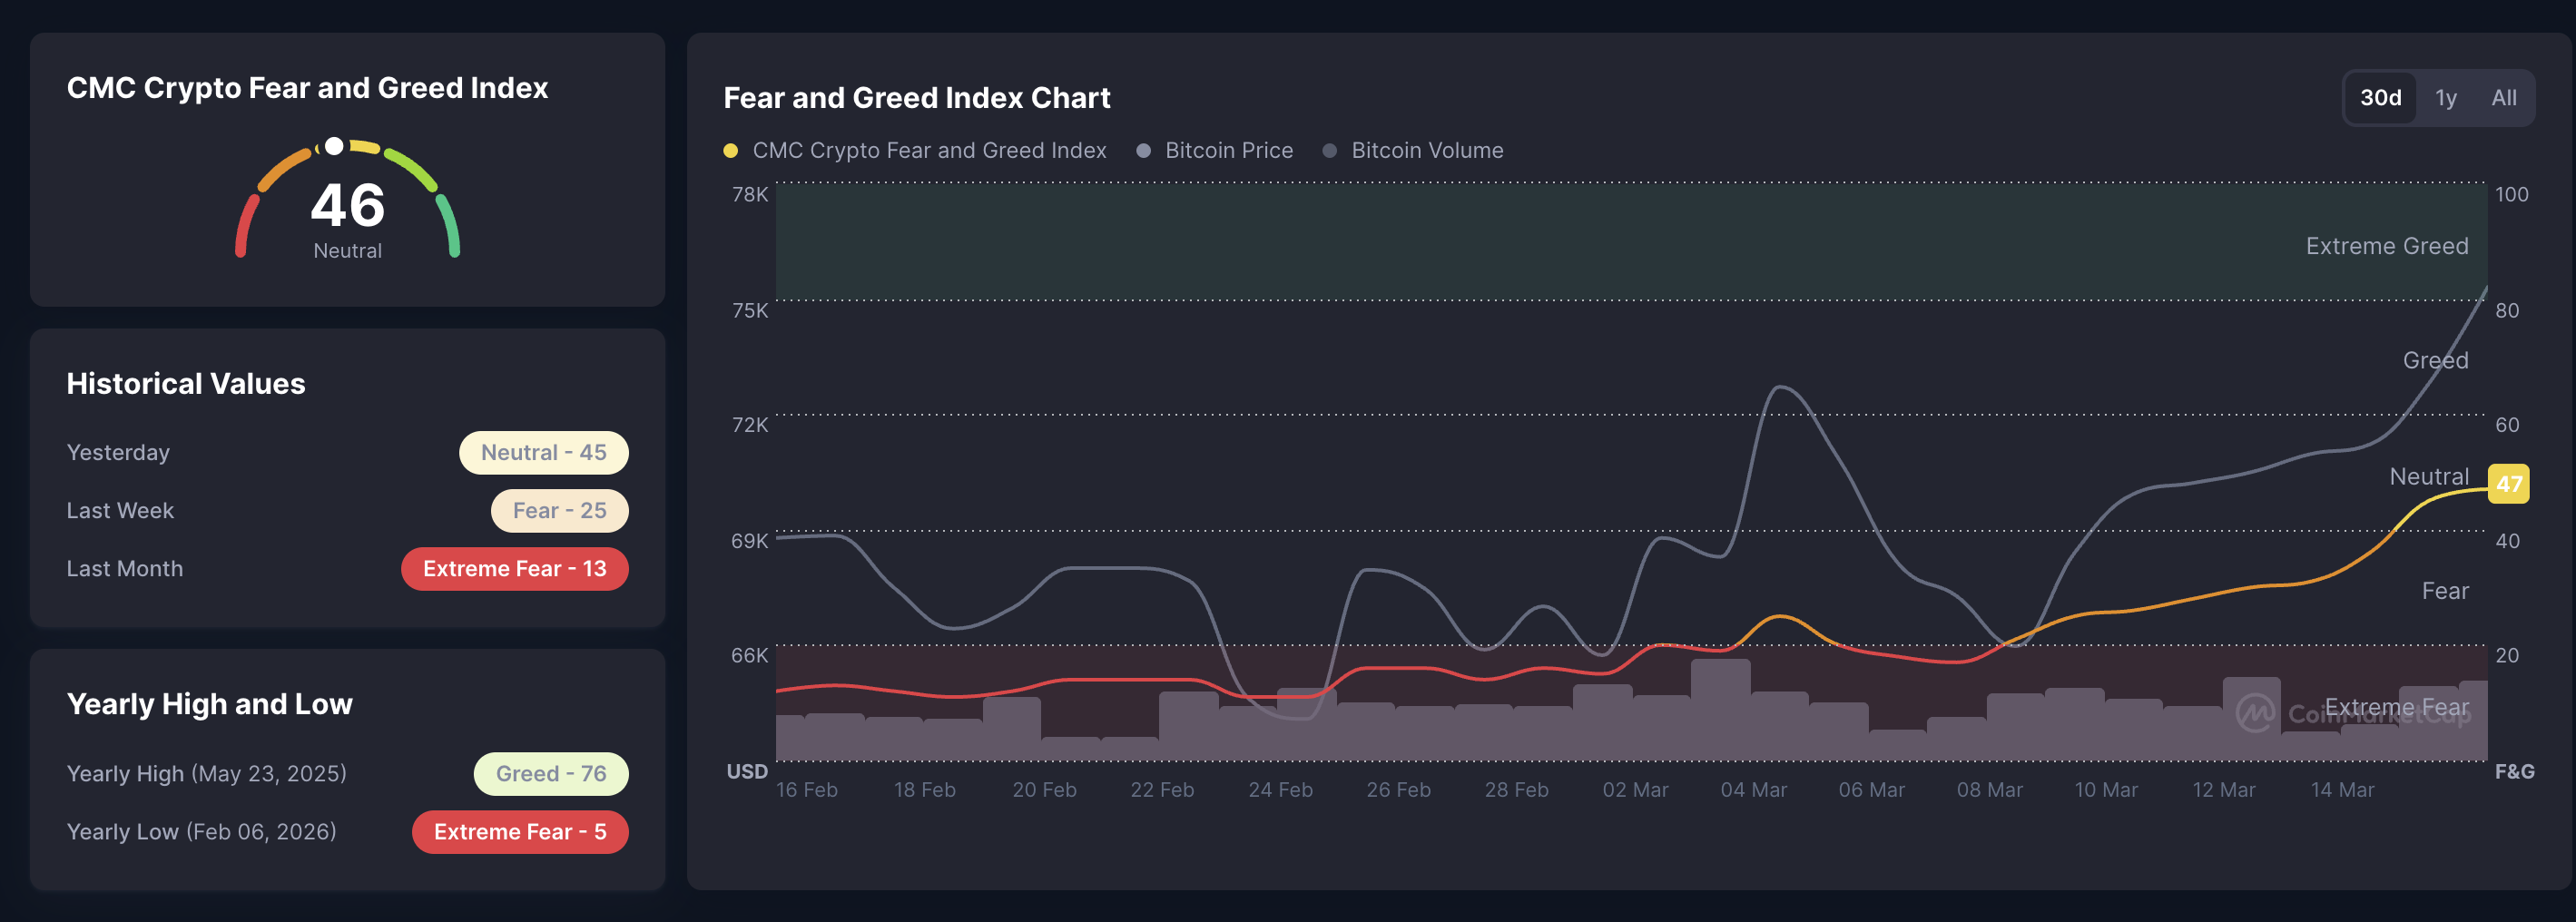
Meanwhile, the broader market sentiment is recovering. CoinMarketCap’s Crypto Fear and Greed Index rises to 46 on Tuesday, suggesting neutral conditions.
Top Crypto Gainers: Zcash, Pepe, and Polkadot extend gains
Zcash trades around $275 at press time on Tuesday, following a 20% surge the previous day. The near-term bias tilts bullish as ZEC breaks a long-standing descending resistance line near $250, with a daily close above the 50-day Exponential Moving Average (EMA) at $264.
Still, the privacy coin faces downside pressure from the 200-day EMA at $281. A decisive close above this average could target the 23.6% Fibonacci retracement at $362, measured from the $34.45 low to the $750 high.
The Moving Average Convergence Divergence (MACD) is above its signal line, and both are in the positive territory, while the expanding positive histogram suggests strengthening upside momentum. The Relative Strength Index (RSI) at 62 moves decisively above the midline, reinforcing renewed buying pressure.
Looking down, the key support for ZEC remains the trendline breakout area near $250, followed by the $200 psychological support.
On the other hand, Pepe tests the 50-day EMA at $0.00000394 at press time on Tuesday after a 16% surge on Monday.
The MACD hovers around the zero line with negligible separation from its signal line, reinforcing the lack of clear momentum. The RSI at 57 recovers from sub-40 readings but remains below overbought territory, hinting at modestly improving, yet still fragile, bullish pressure within an otherwise directionless structure.
Immediate resistance aligns with the R1 Pivot Point at $0.00000478.
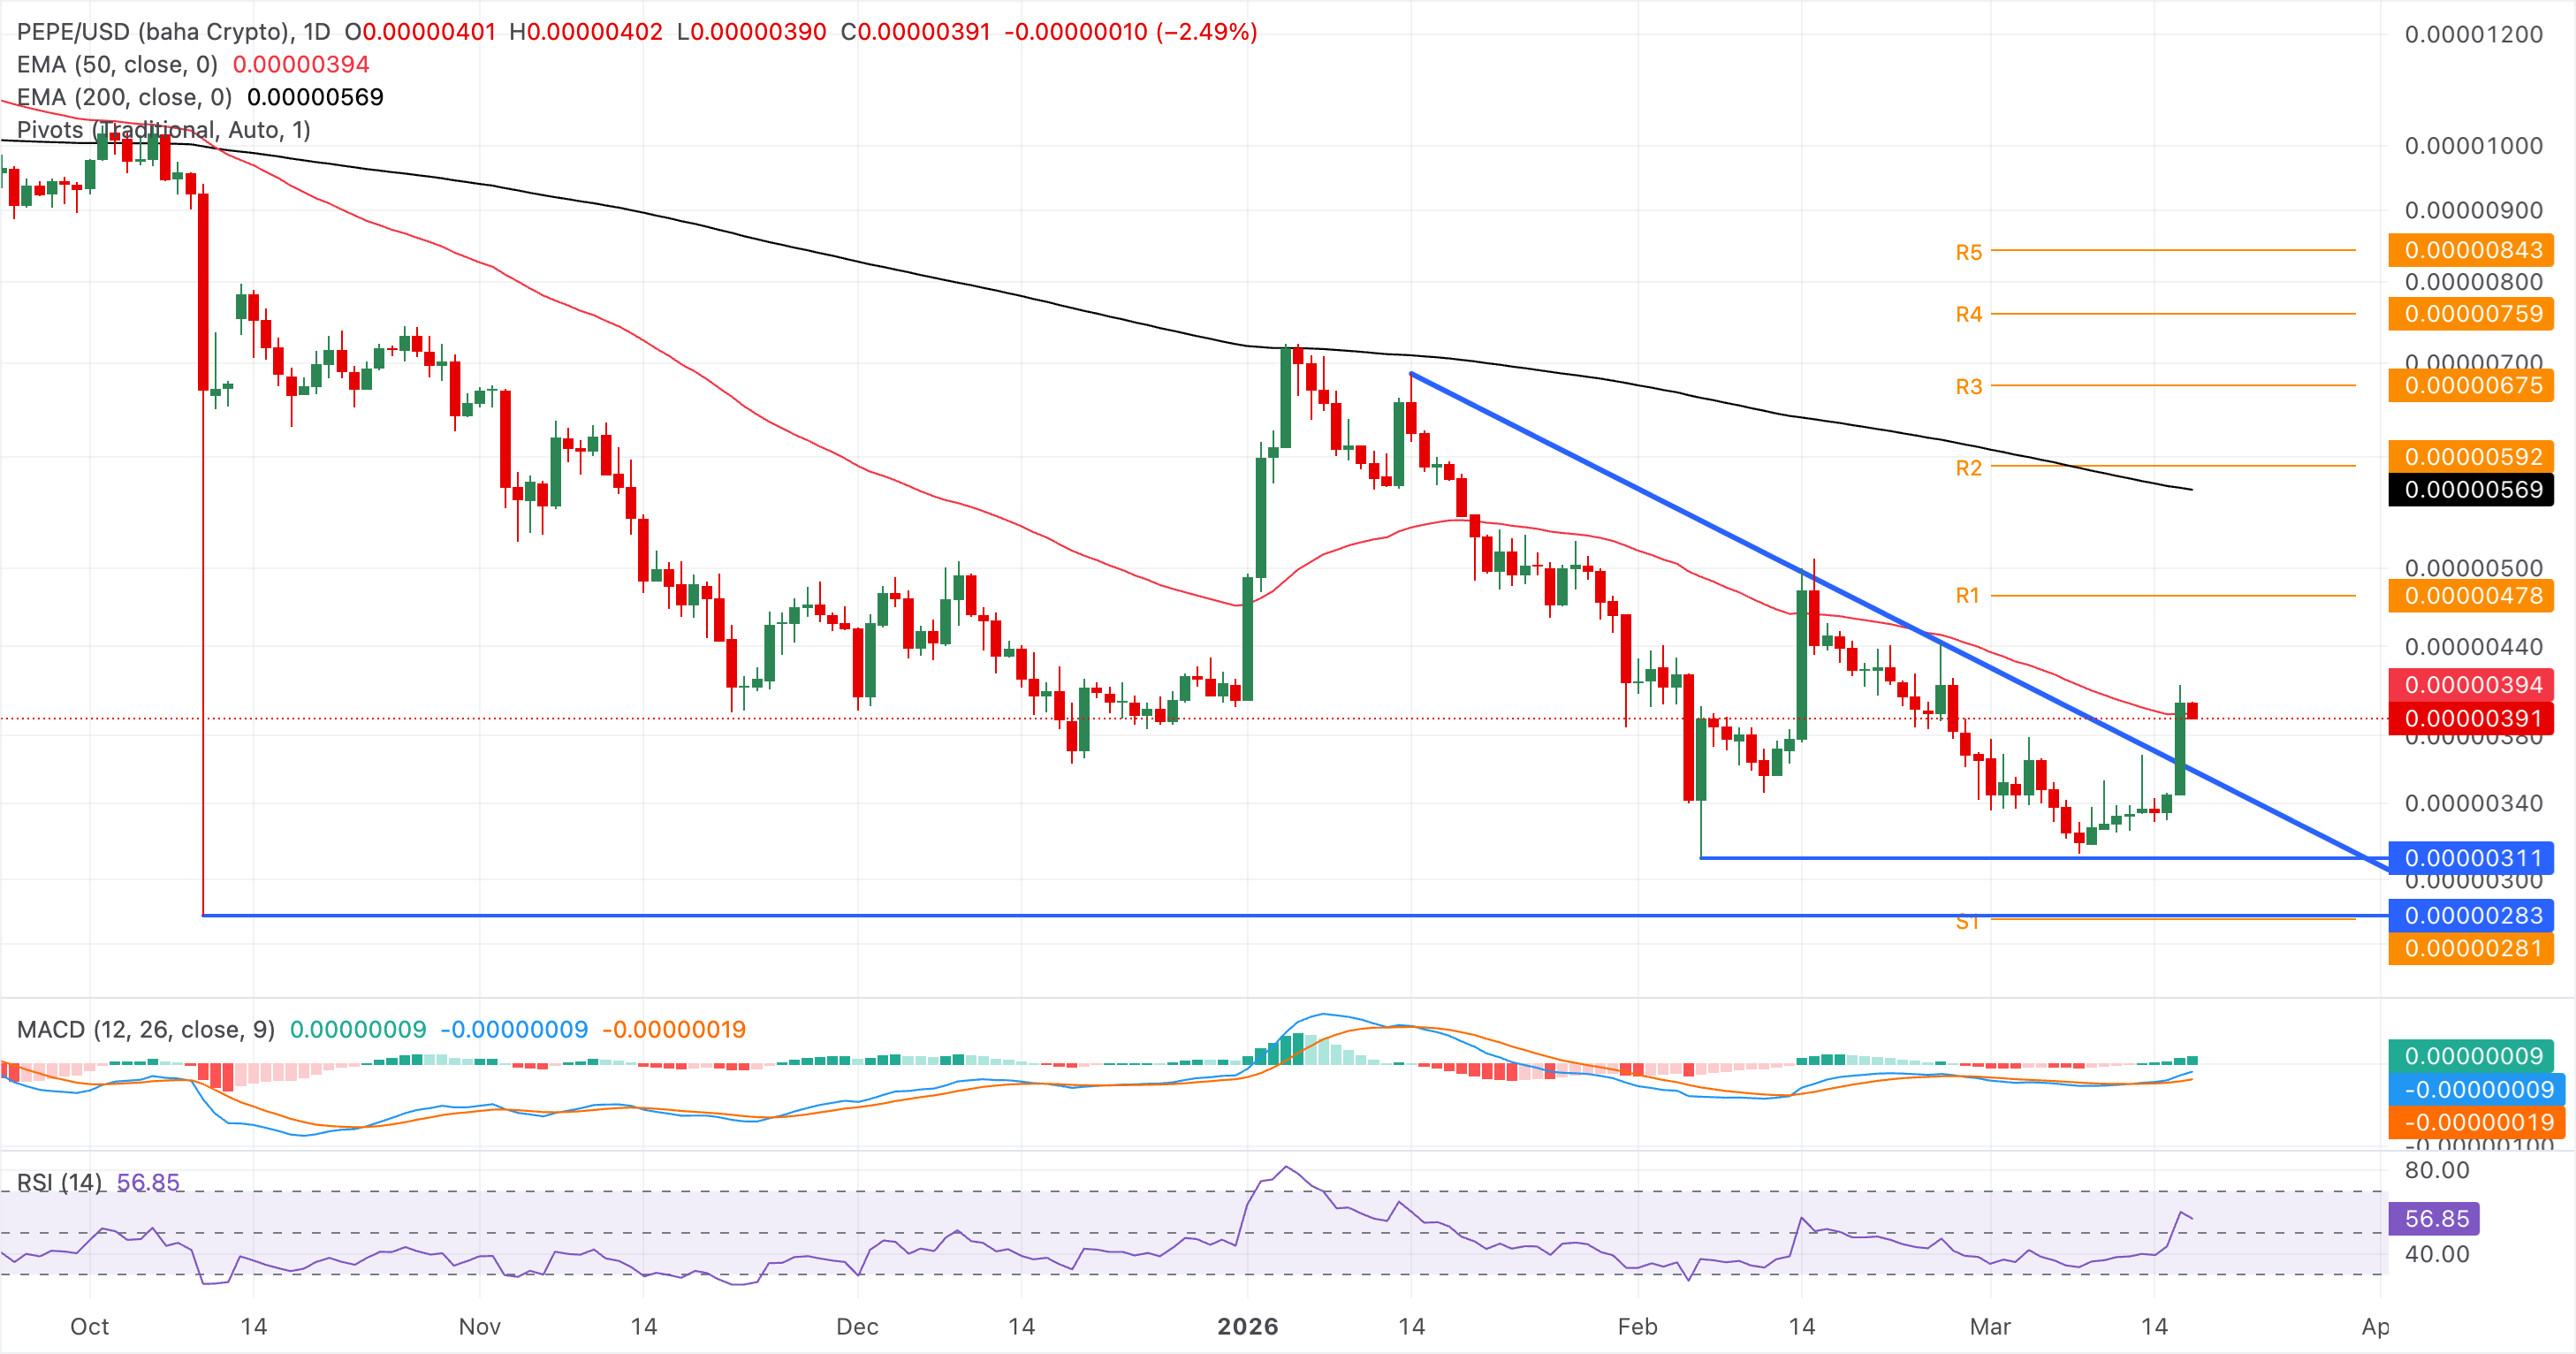
On the downside, if PEPE slips below $0.00000348, it could retest the $0.00000311 support floor marked by the February 6 low.
Meanwhile, Polkadot shows a similar retreat so far on Tuesday after a 13% jump on the previous day, which confirmed the breakout of a falling channel pattern.
Momentum supports the upside tilt as the MACD stands above its signal and above the zero line, with a positive histogram, and the RSI at 58 maintains bullish momentum without overbought conditions.
The upside target for DOT remains the R1 Pivot Point at $1.90, while bulls target the $2.00 psychological level.
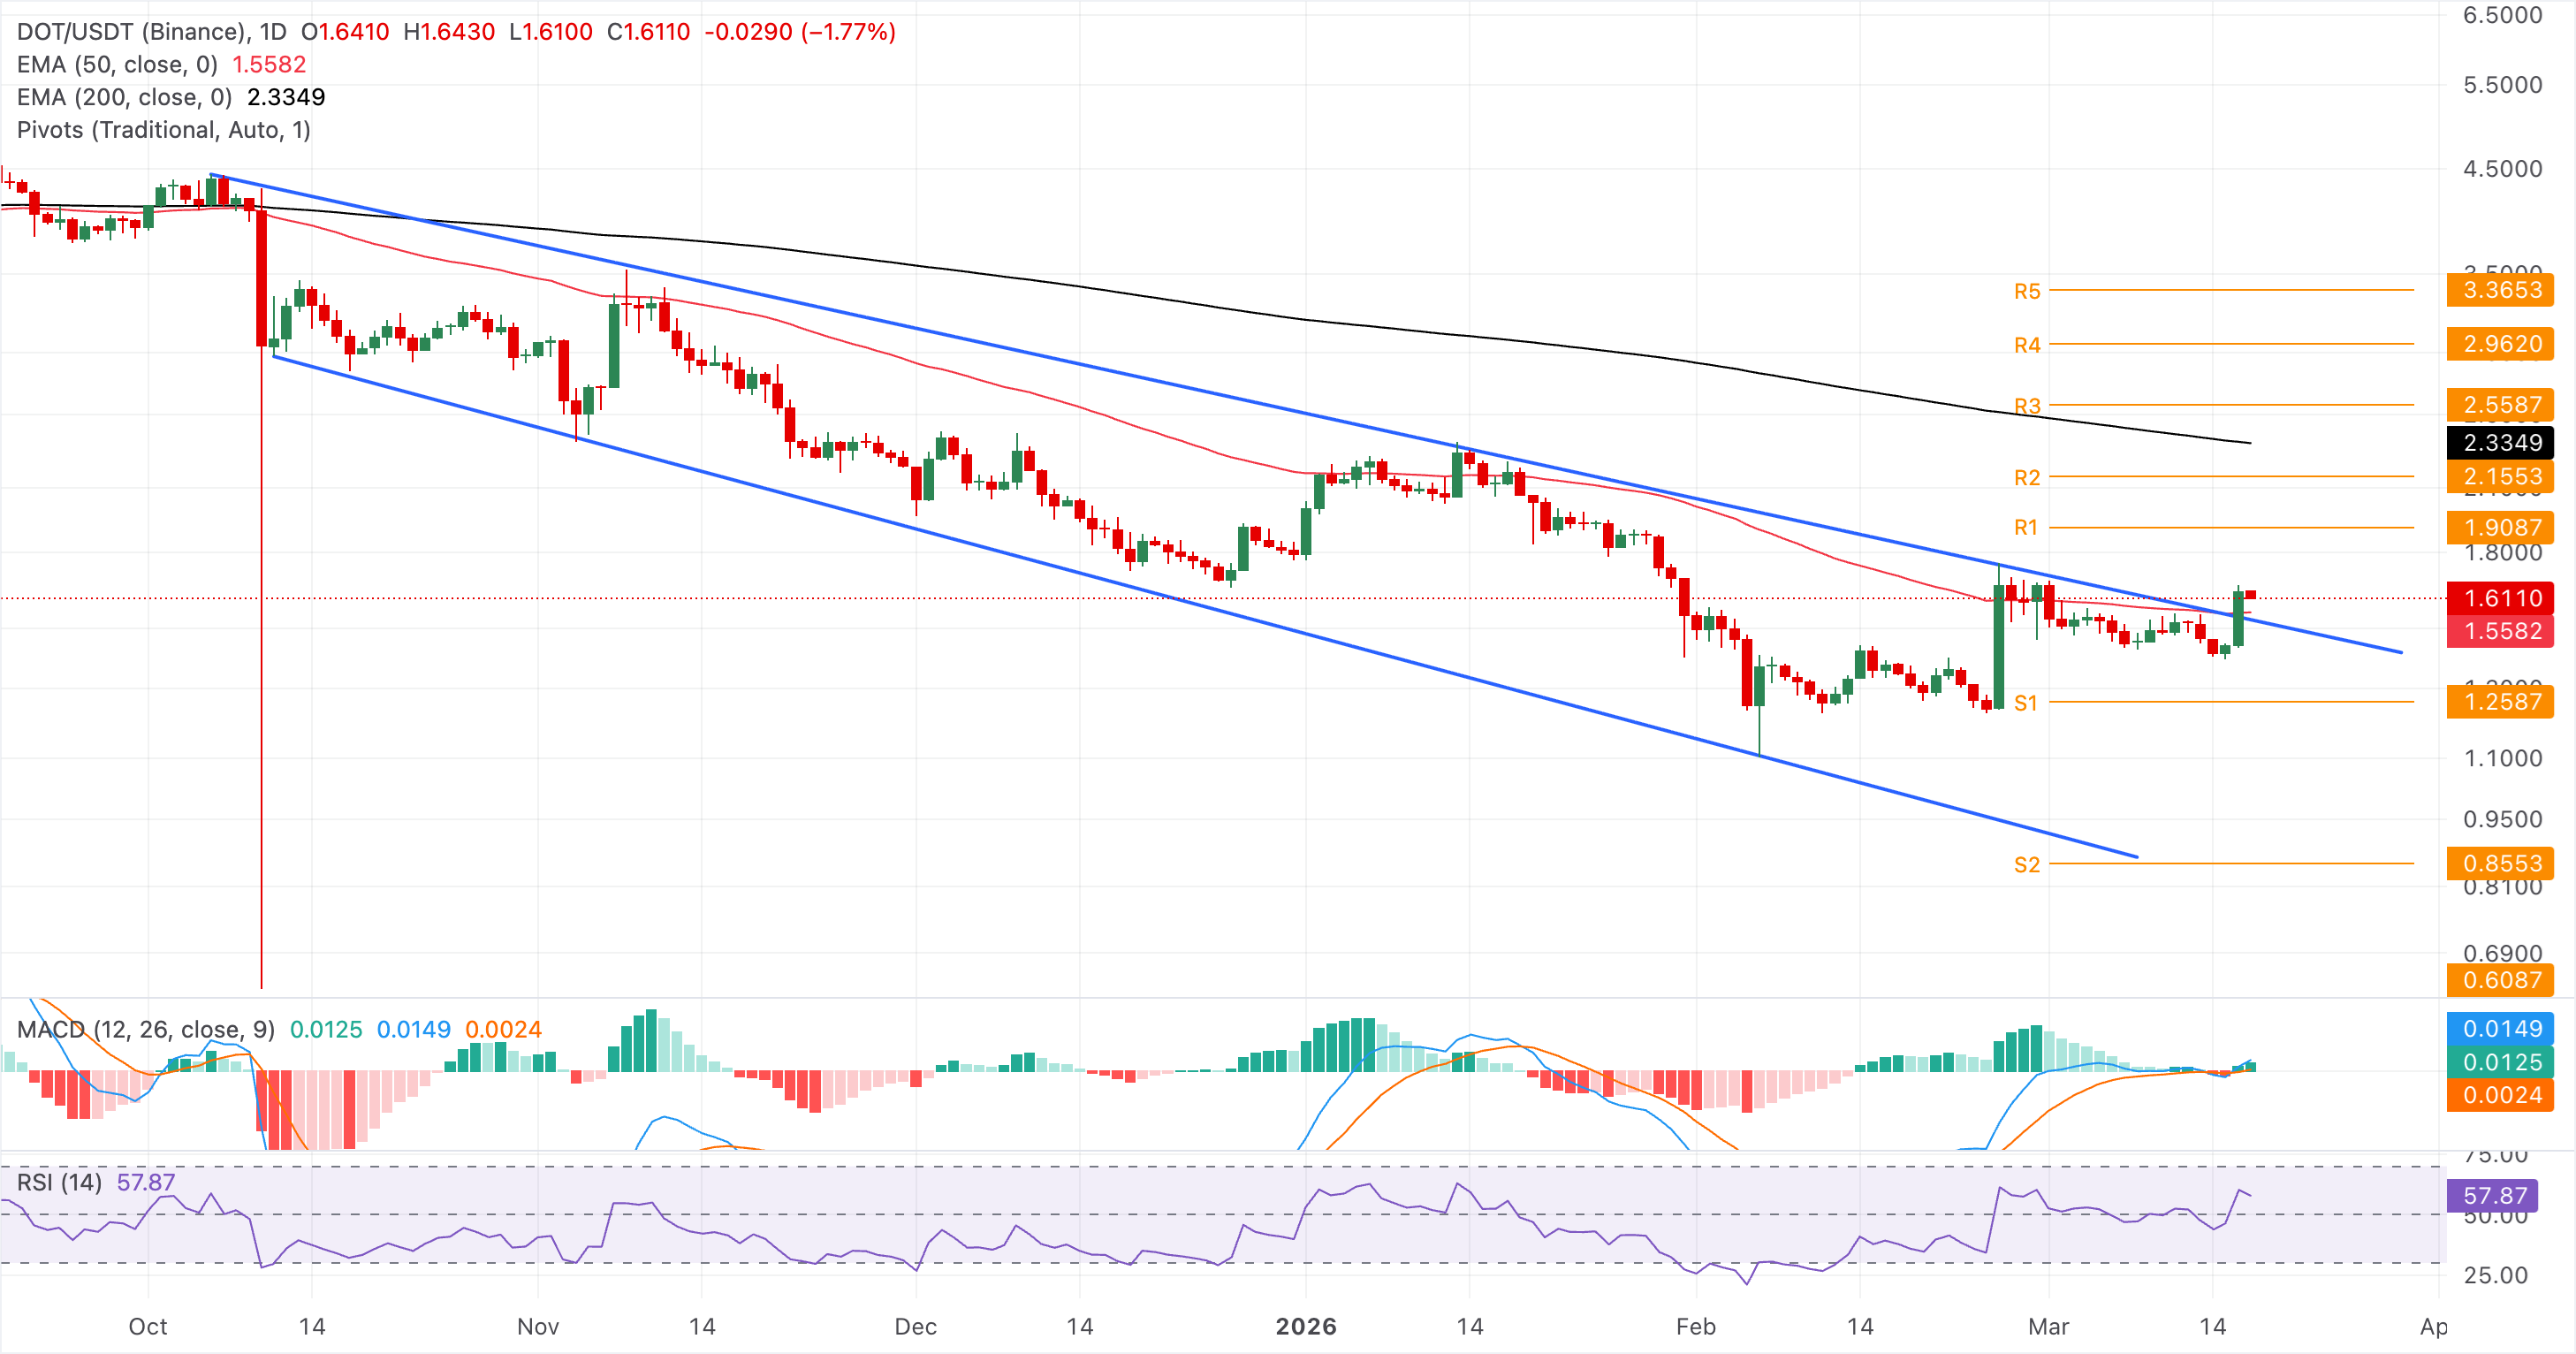
However, a slip below the 50-day EMA at $1.55 could trigger a pullback to the broken trendline near $1.50, nullifying the breakout rally.
(The technical analysis of this story was written with the help of an AI tool.)

Higit sa isang milyong user ang umaasa sa FXStreet para sa real-time market data, charting tools, expert insights, at Forex news. Ang komprehensibong economic calendar at educational webinars nito ay tumutulong sa mga trader na manatiling may alam at gumawa ng kalkuladong mga desisyon. Sinusuportahan ang FXStreet ng humigit-kumulang 60 propesyonal sa pagitan ng Barcelona HQ at iba’t ibang rehiyon sa buong mundo.
Magbasa pa


