
Crypto Today: Bitcoin, Ethereum, and Ripple defend their last line of defenses
Ni Vishal Dixit
Na-update: 25 Jun 2026


Sikat na Artikulo
The broader cryptocurrency market remains under immense downward pressure as investors' interest shifts toward lucrative AI and memory stocks. Bitcoin (BTC), Ethereum (ETH), and Ripple (XRP) are holding above their June 6 lows, with bulls hoping short-term resilience will ward off sellers.
- Bitcoin rises above $61,000 on Thursday, marking a minor recovery after slipping below $60,000 the previous day.
- Ethereum edges above $1,600 after two consecutive days of losses, while an overhead resistance trendline underpins a broader bearish bias.
- Ripple hovers around $1.07 with the path of least resistance pointing toward the $1.00 psychological threshold.
The broader cryptocurrency market remains under immense downward pressure as investors' interest shifts toward lucrative AI and memory stocks. Bitcoin (BTC), Ethereum (ETH), and Ripple (XRP) are holding above their June 6 lows, with bulls hoping short-term resilience will ward off sellers.
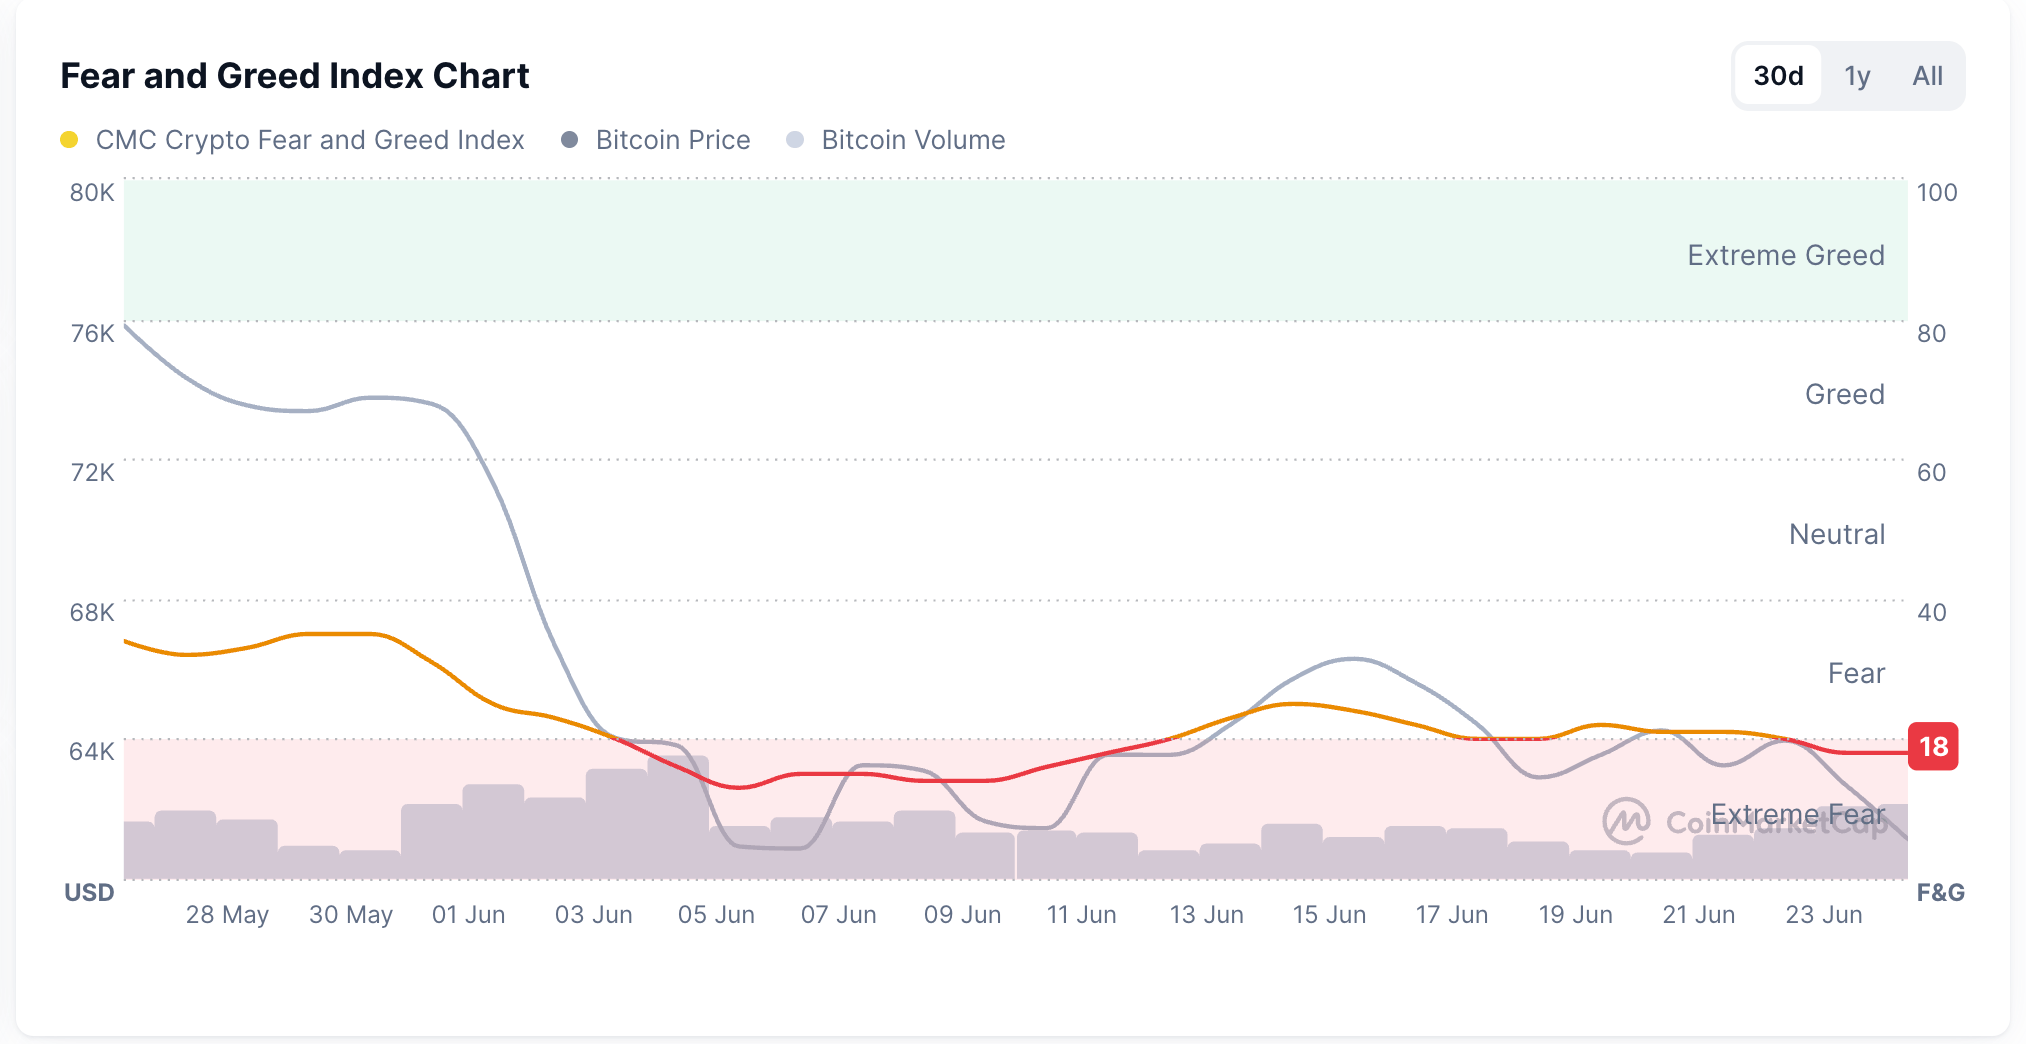
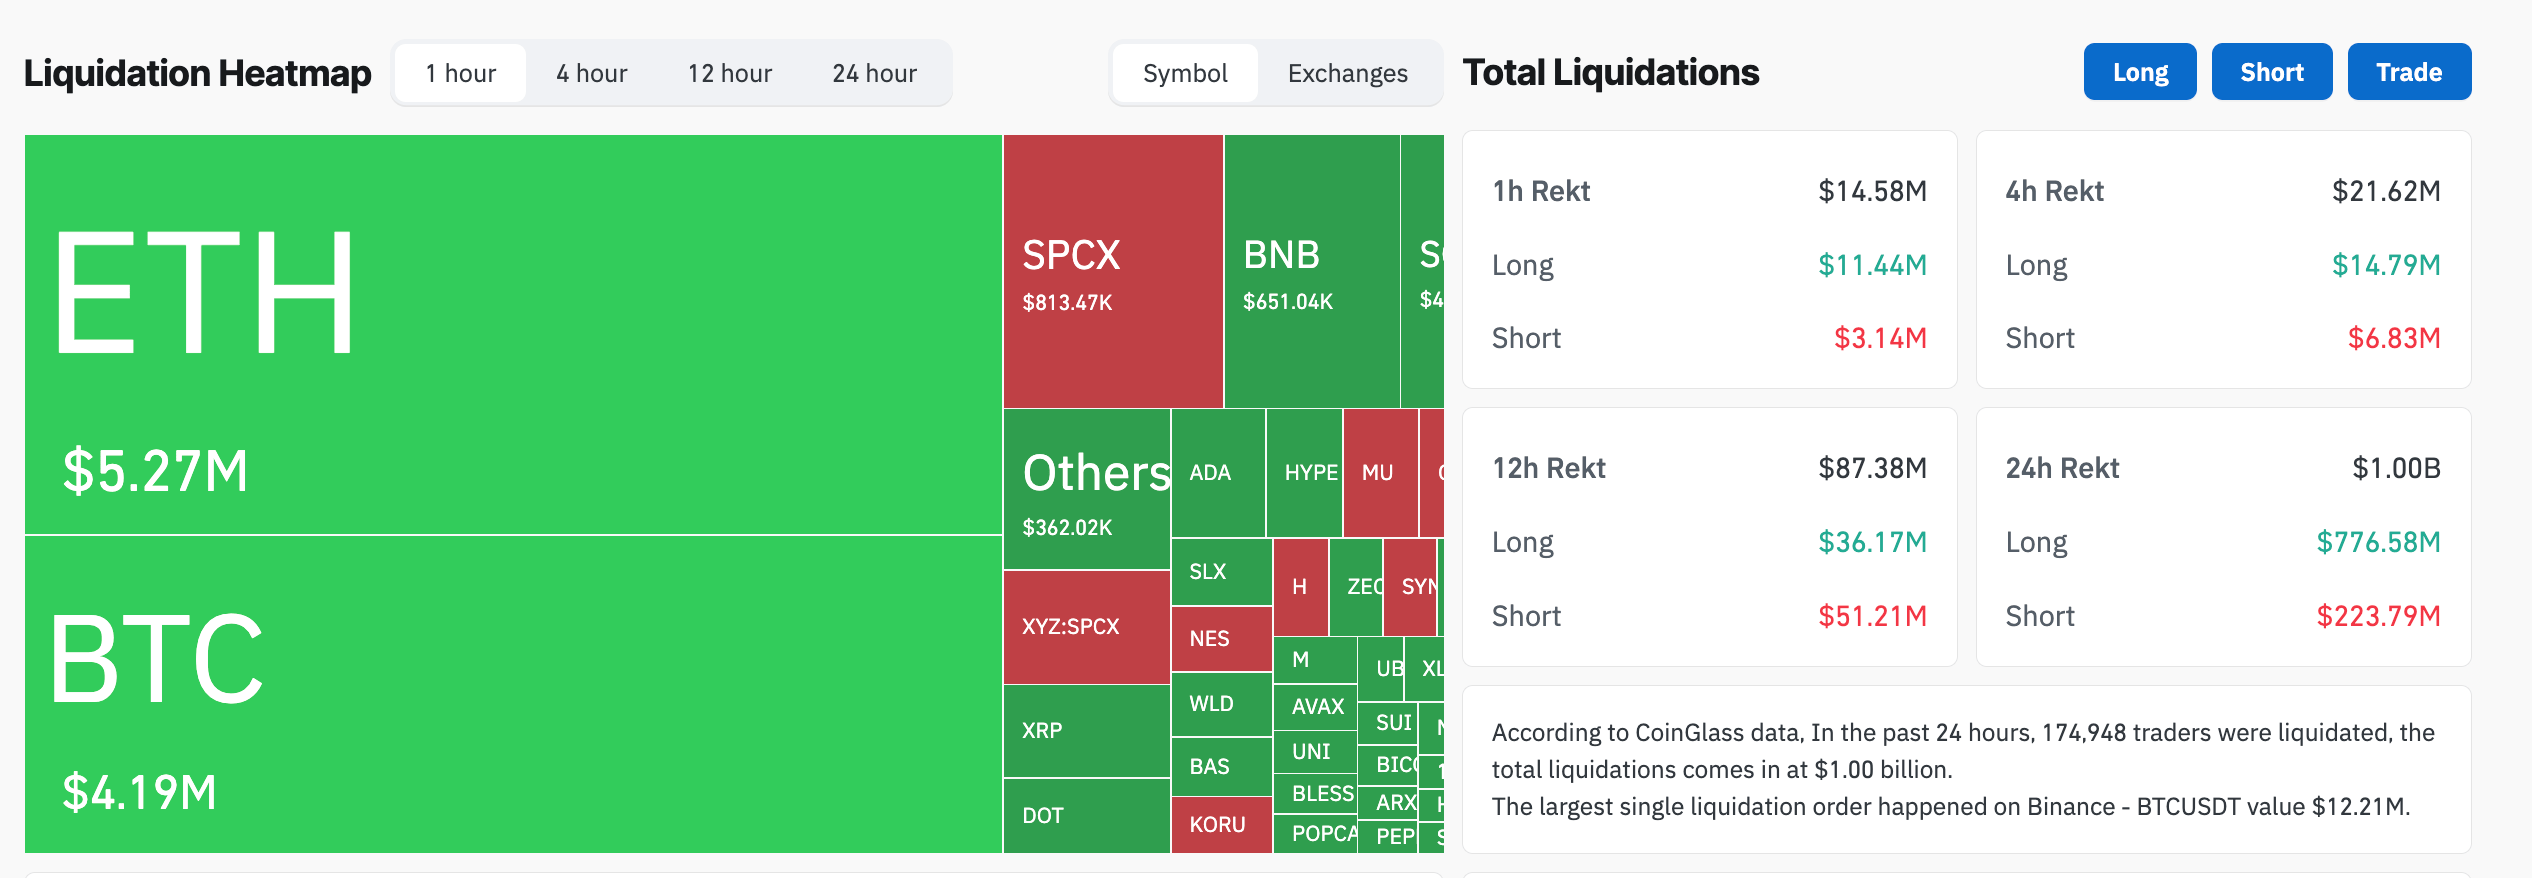
At the same time, risk-off sentiment among investors intensifies, as evidenced by Thursday's Fear and Greed Index reading of 18, indicating Extreme Fear in the crypto market. Meanwhile, the $1 billion in total liquidations over the last 24 hours, led by $776 million in long liquidations, confirms the sell-side bias in the market.
Will Bitcoin hold above $60,000?
Bitcoin hovers above $61,000 on Thursday, down from $61,962 earlier in the day, risking an extension of the two consecutive days of losses. BTC maintains a bearish near-term bias, trading well below the 50- and 200-day Exponential Moving Averages (EMAs) at $68,248 and $77,506, respectively.
From a technical perspective, the bearish reversal on June 16 signals a downside extension following the retest of the bearish Fair Value Gap (FVG) between $67,516 to $70,686. The path of least resistance threatens the swing low of $59,103 formed the previous day, near the June 6 low of $59,130. A decisive close below this level could extend the decline toward the July 5 low at $53,485.
That said, the momentum shows bearish signals on the daily chart. The downtick in the Moving Average Convergence Divergence (MACD) aligns with contracting positive histograms, hinting at the failing underlying corrective tone. Meanwhile, the Relative Strength Index (RSI) at 34 remains below the midline and continues to trend downward, reaffirming an unstable recovery from recent oversold conditions.
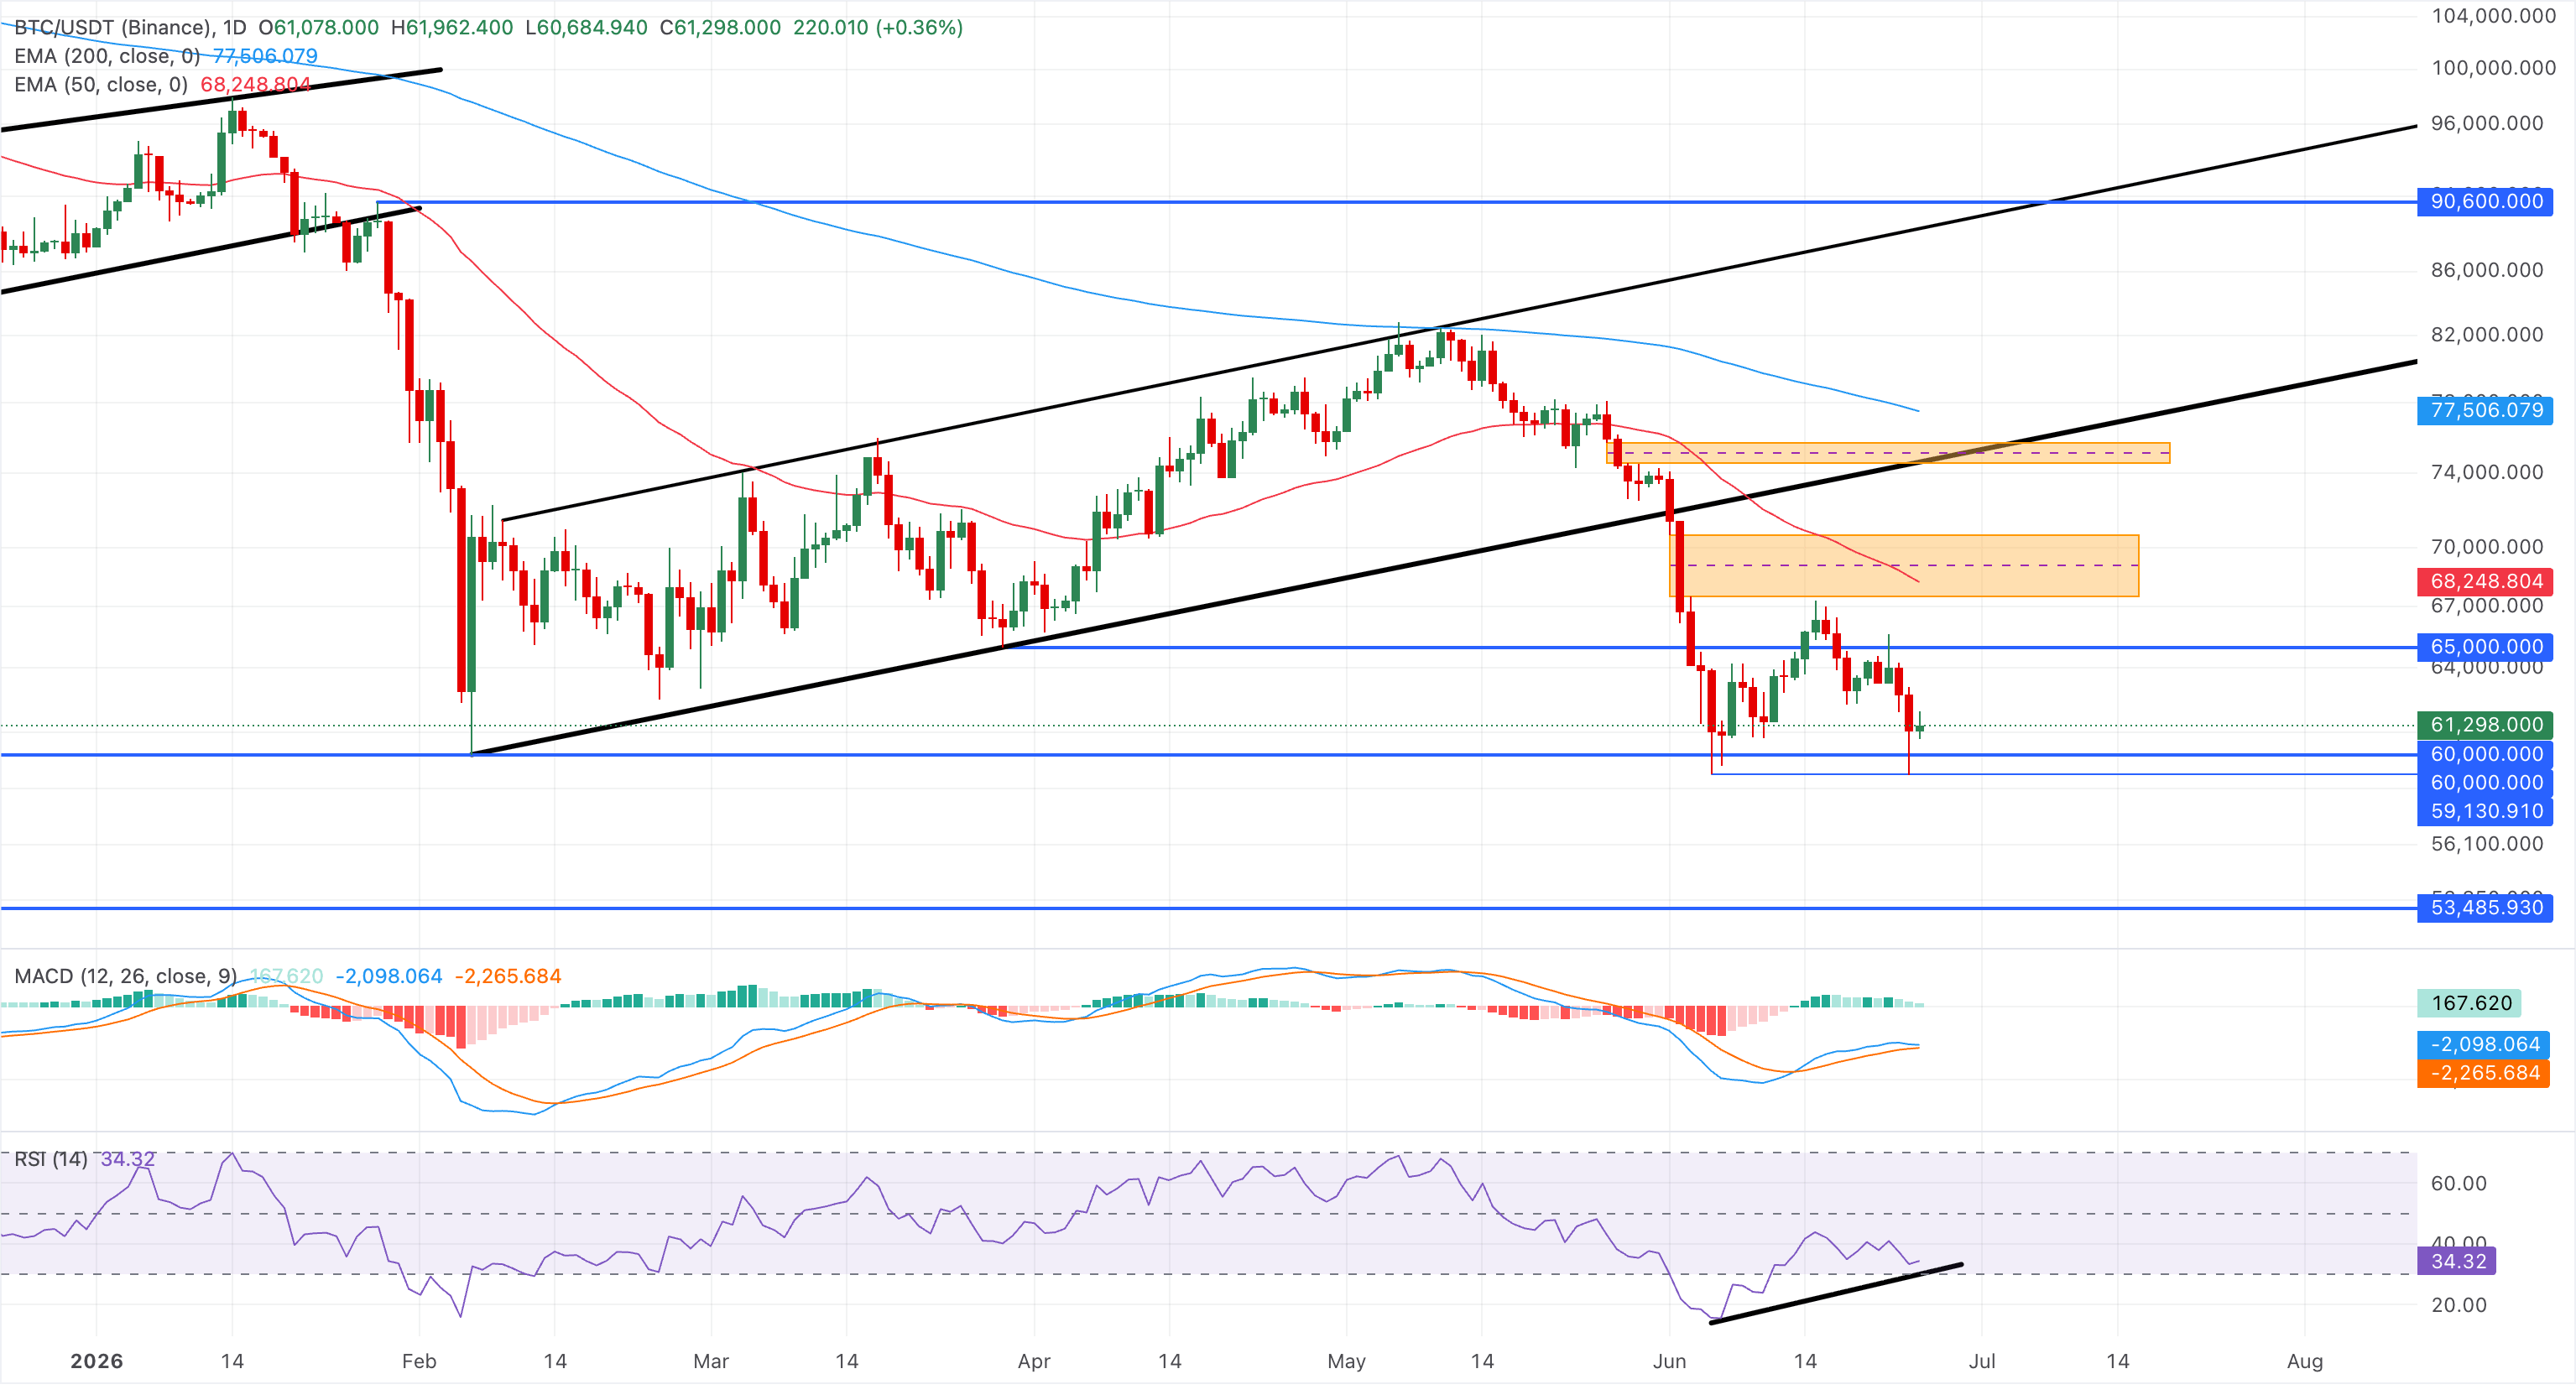
On the topside, initial resistance aligns with the 50-day EMA at $68,248, and a more significant barrier is at the 200-day EMA around $77,506.
Could Ethereum defend its $1,500 swing low?
Ethereum is holding above $1,600 at press time on Thursday, maintaining a broadly bearish trend underpinned by a descending resistance trendline. The major altcoin shows a modest recovery from recent lows, but the path of least resistance remains downward.
That said, the MACD and signal line are on the verge of a bearish crossover, suggesting short-term bullish momentum is waning. Meanwhile, the RSI near 35 shows a reversal below its midline as sellers regain strength.
Looking down, the June 6 low at $1,505 remains a key support level, and a slip below this zone would test levels last seen in April 2025, potentially targeting the April 9 low at $1,385.
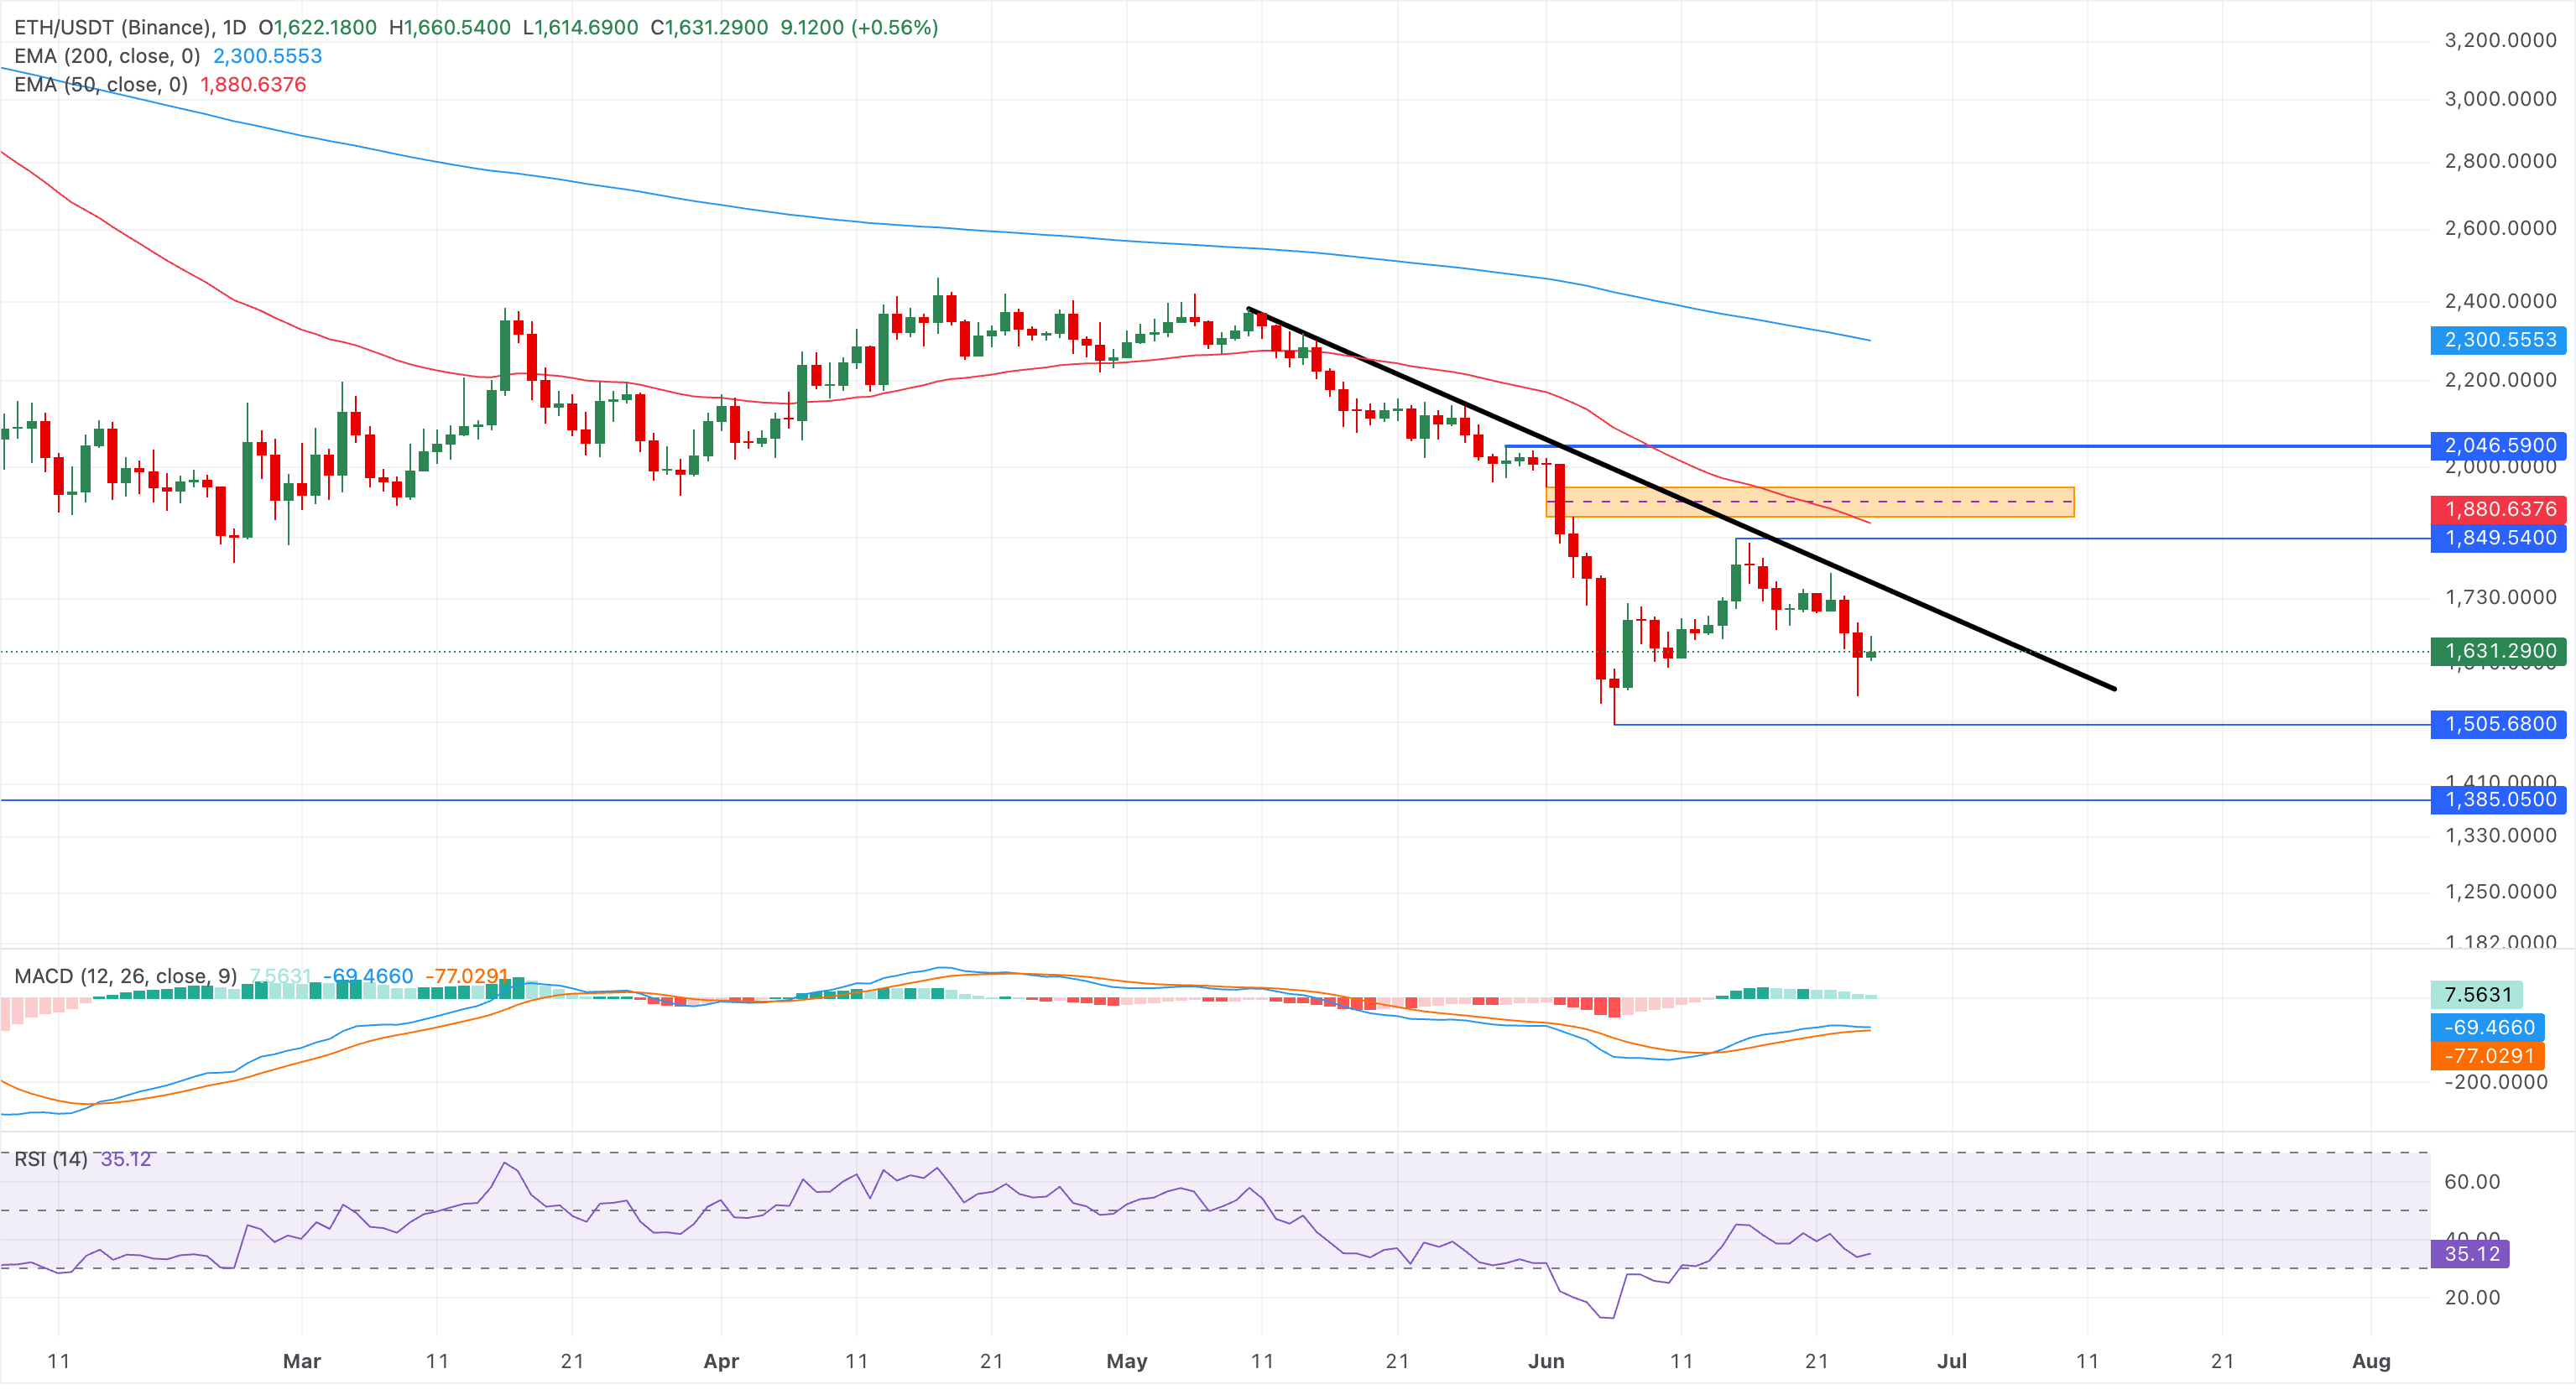
On the topside, initial resistance is seen at the former trendline break area around $1,789.80, where sellers could re-emerge on rebounds. Above that, the 50-day EMA at $1,880 acts as a more significant barrier, reinforcing a major cap on any extended recovery.
Could XRP price slip below $1?
XRP is trading around $1.07 at press time on Thursday, extending a bearish reversal from the 50-day EMA around $1.28 last week. The cross-border remittance token holds above its June 6 low at $1.05, with a minor recovery phase, but the prevailing bearish trend warns of a steeper correction.
The MACD indicator flashes a sell signal as the average lines form a bearish crossover, while the RSI slips to 34, hinting that sellers retain control, although the pair is edging toward oversold territory.
A potential daily close below $1.05 could risk the FVG formed between $0.92 and $1.00, with a midline around $0.96.
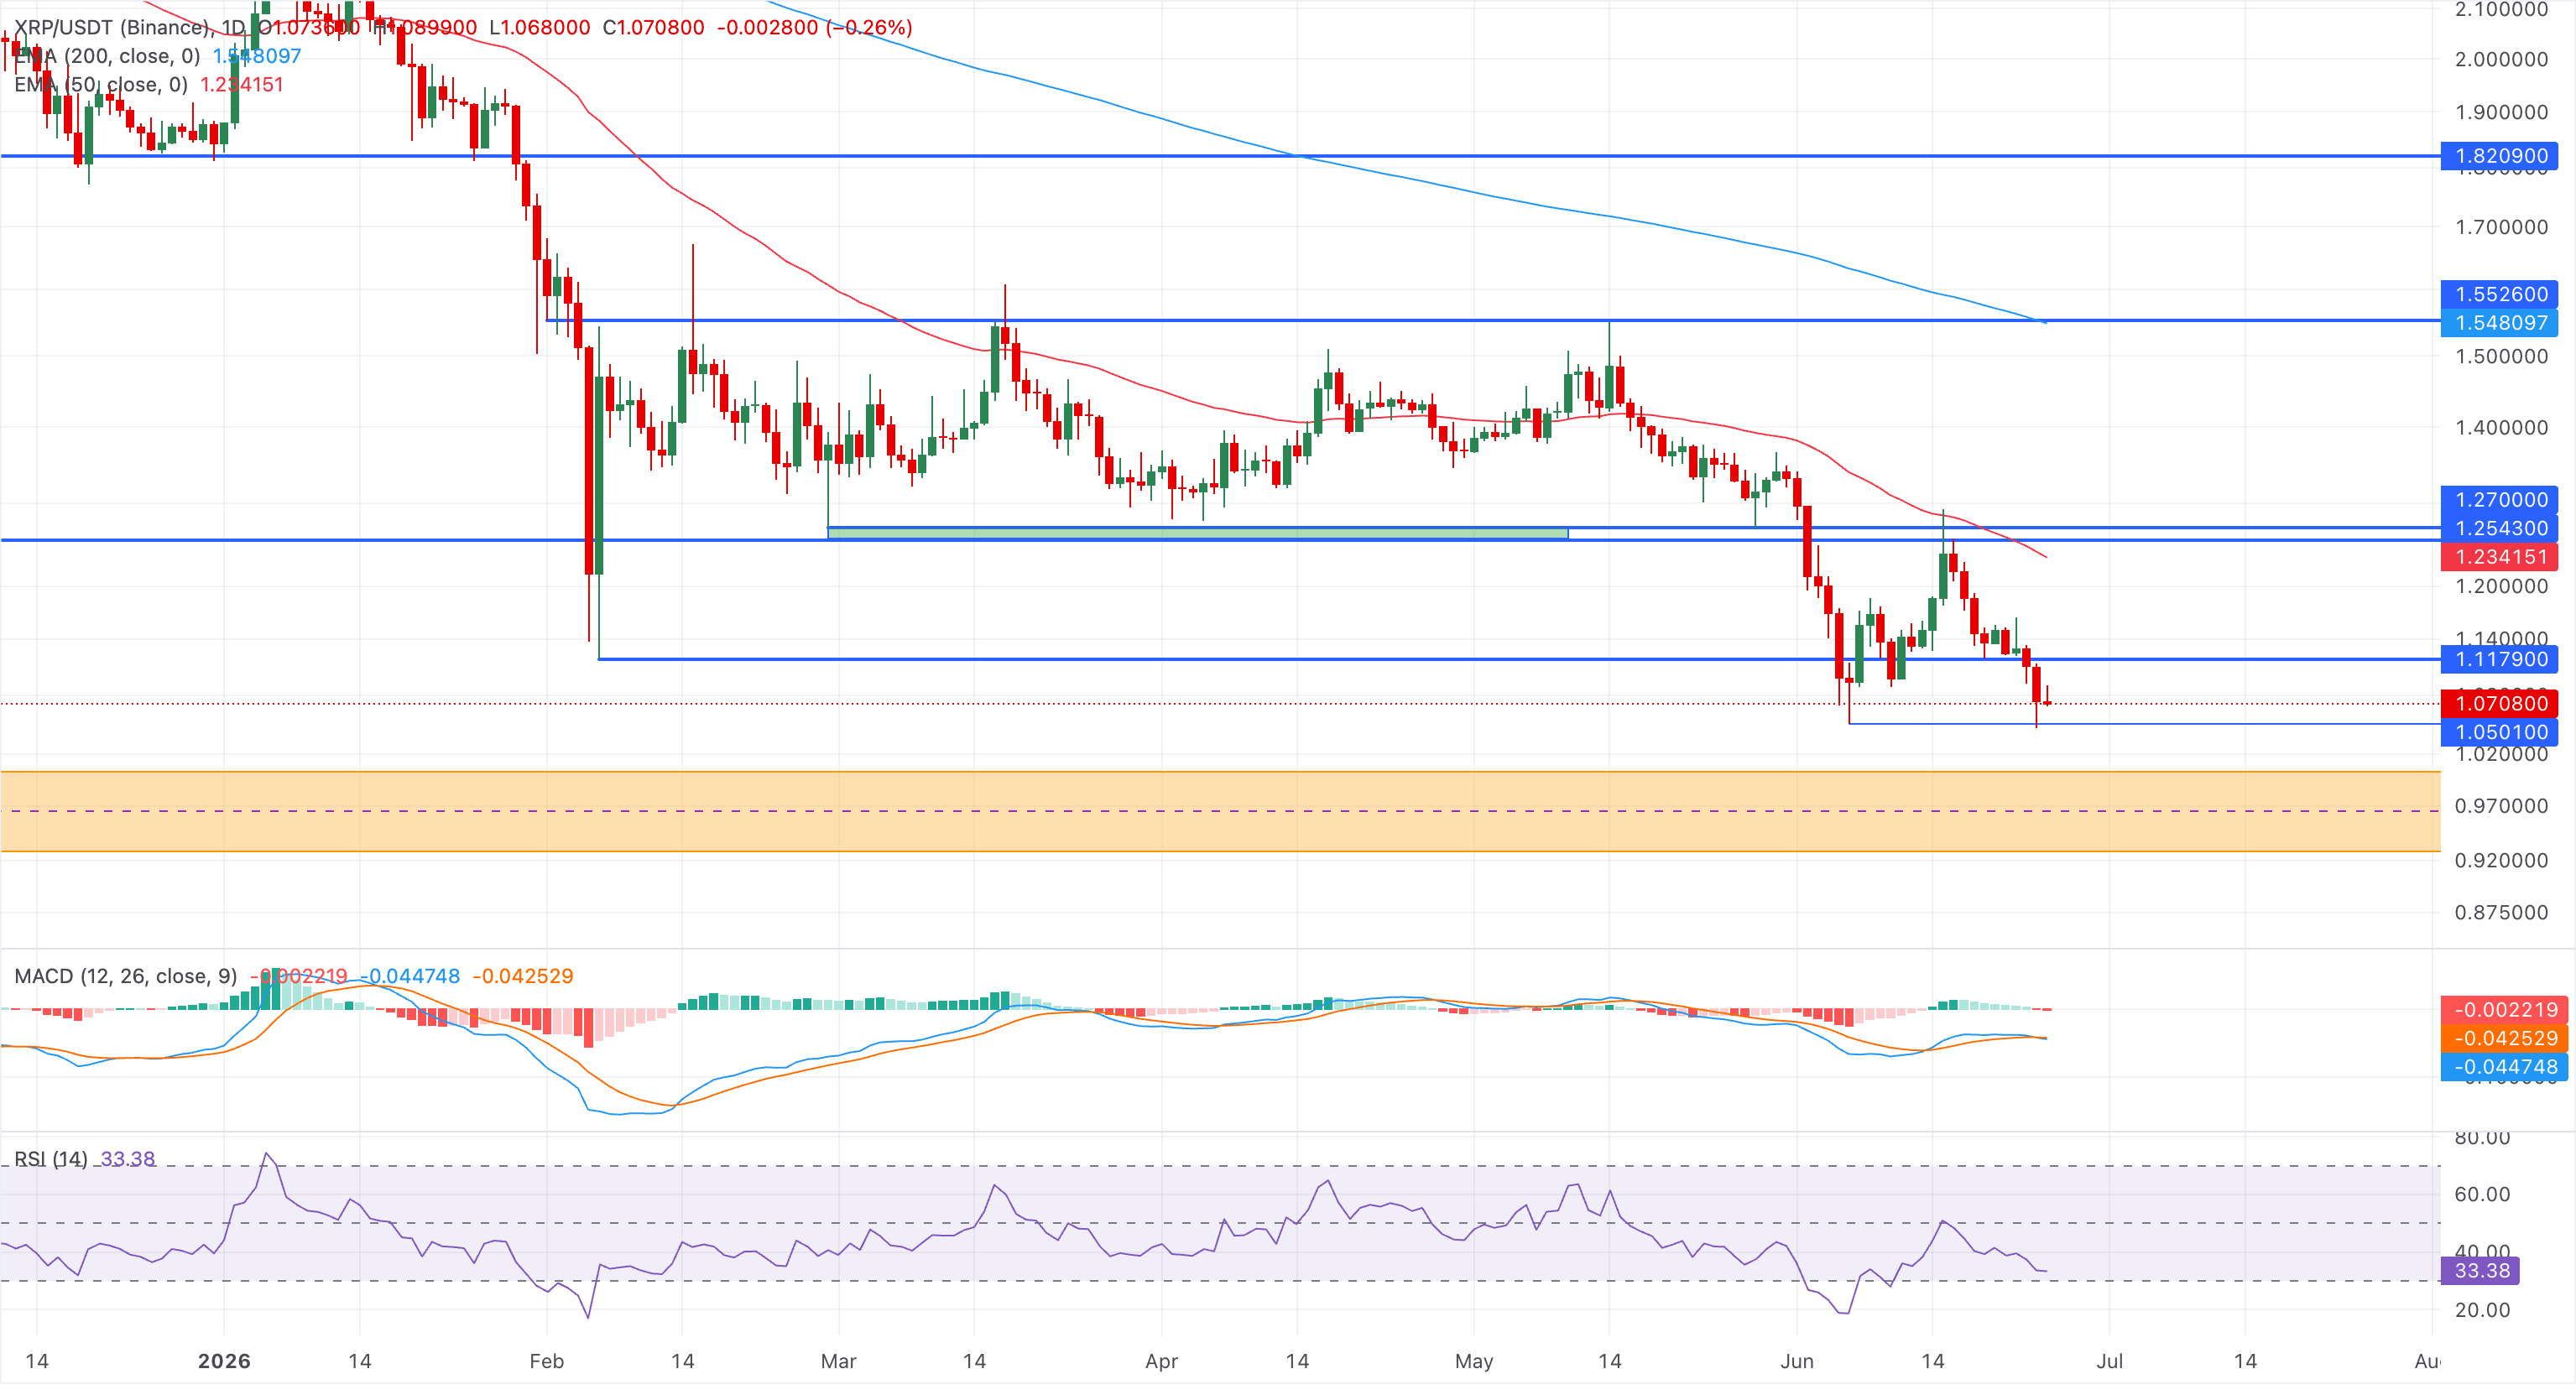
On the topside, initial resistance is at the 50-day EMA near $1.23, which caps any recovery attempts, ahead of a more robust barrier at the 200-day EMA around $1.54, reinforcing the broader bearish structure.
(The technical analysis of this story was written with the help of an AI tool.)

Higit sa isang milyong user ang umaasa sa FXStreet para sa real-time market data, charting tools, expert insights, at Forex news. Ang komprehensibong economic calendar at educational webinars nito ay tumutulong sa mga trader na manatiling may alam at gumawa ng kalkuladong mga desisyon. Sinusuportahan ang FXStreet ng humigit-kumulang 60 propesyonal sa pagitan ng Barcelona HQ at iba’t ibang rehiyon sa buong mundo.
Magbasa pa


