
Crypto Today: Bitcoin, Ethereum, XRP face elevated downside risk amid weak technical setups
Ni John Isige
Petsa ng Pag-publish: 23 Jan 2026 | Petsa ng Pag-edit: 23 Jan 2026


Sikat na Artikulo

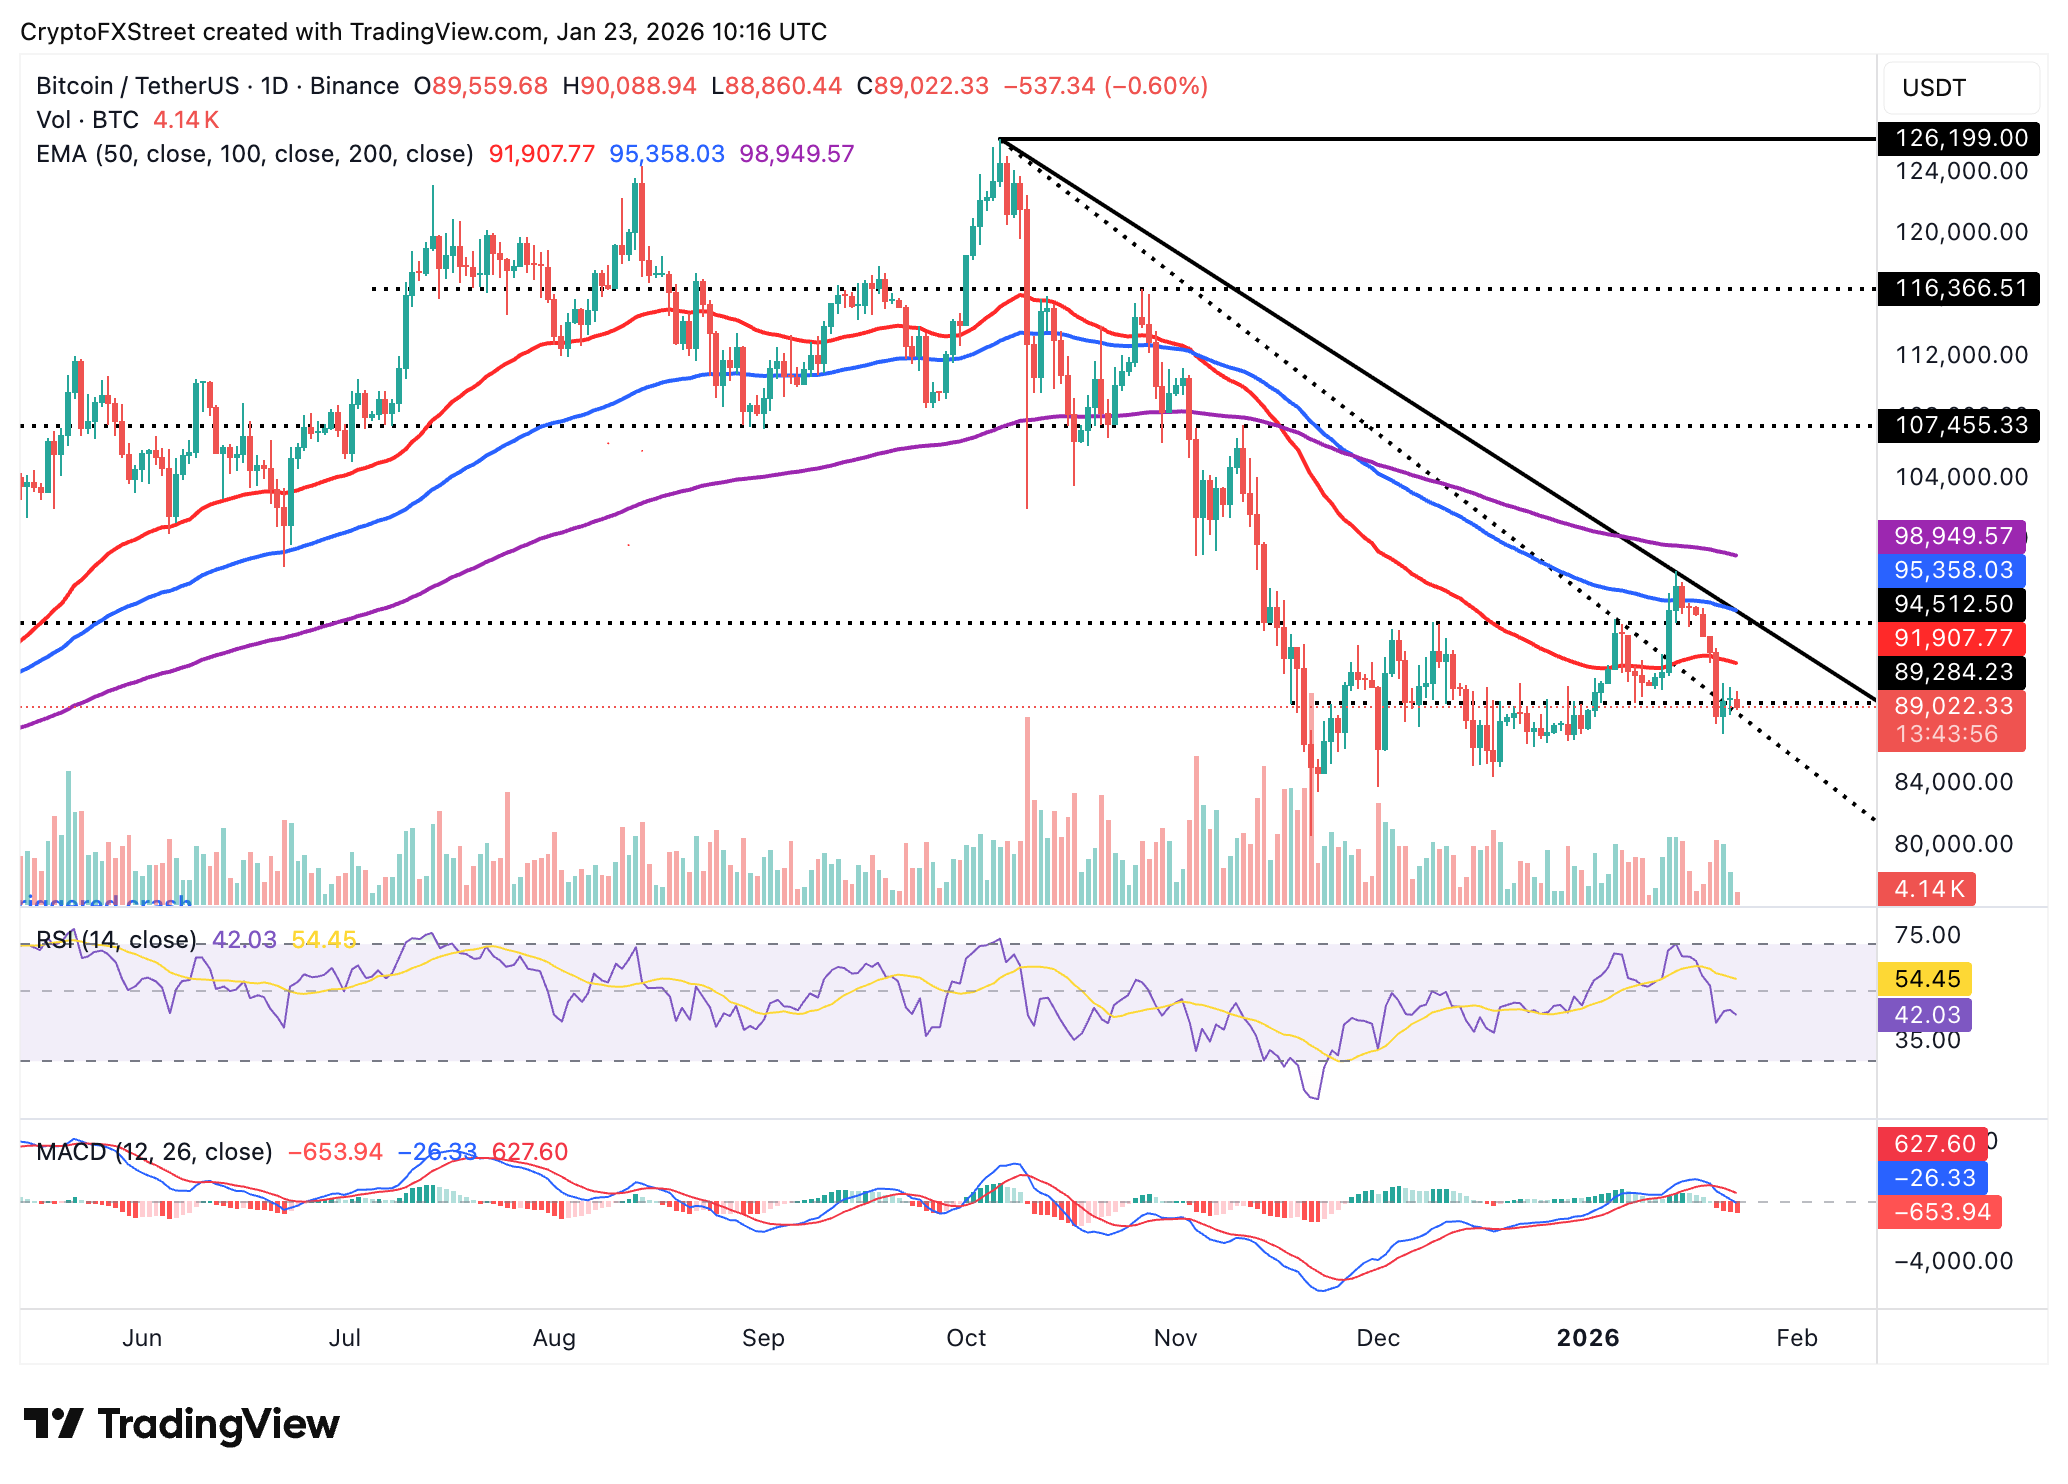
Bitcoin (BTC) is struggling to stay above support at $89,000 at the time of writing, as headwinds intensify across the cryptocurrency market on Friday.
- Bitcoin remains below $90,000, weighed down by a weak technical structure as both the MACD and RSI decline.
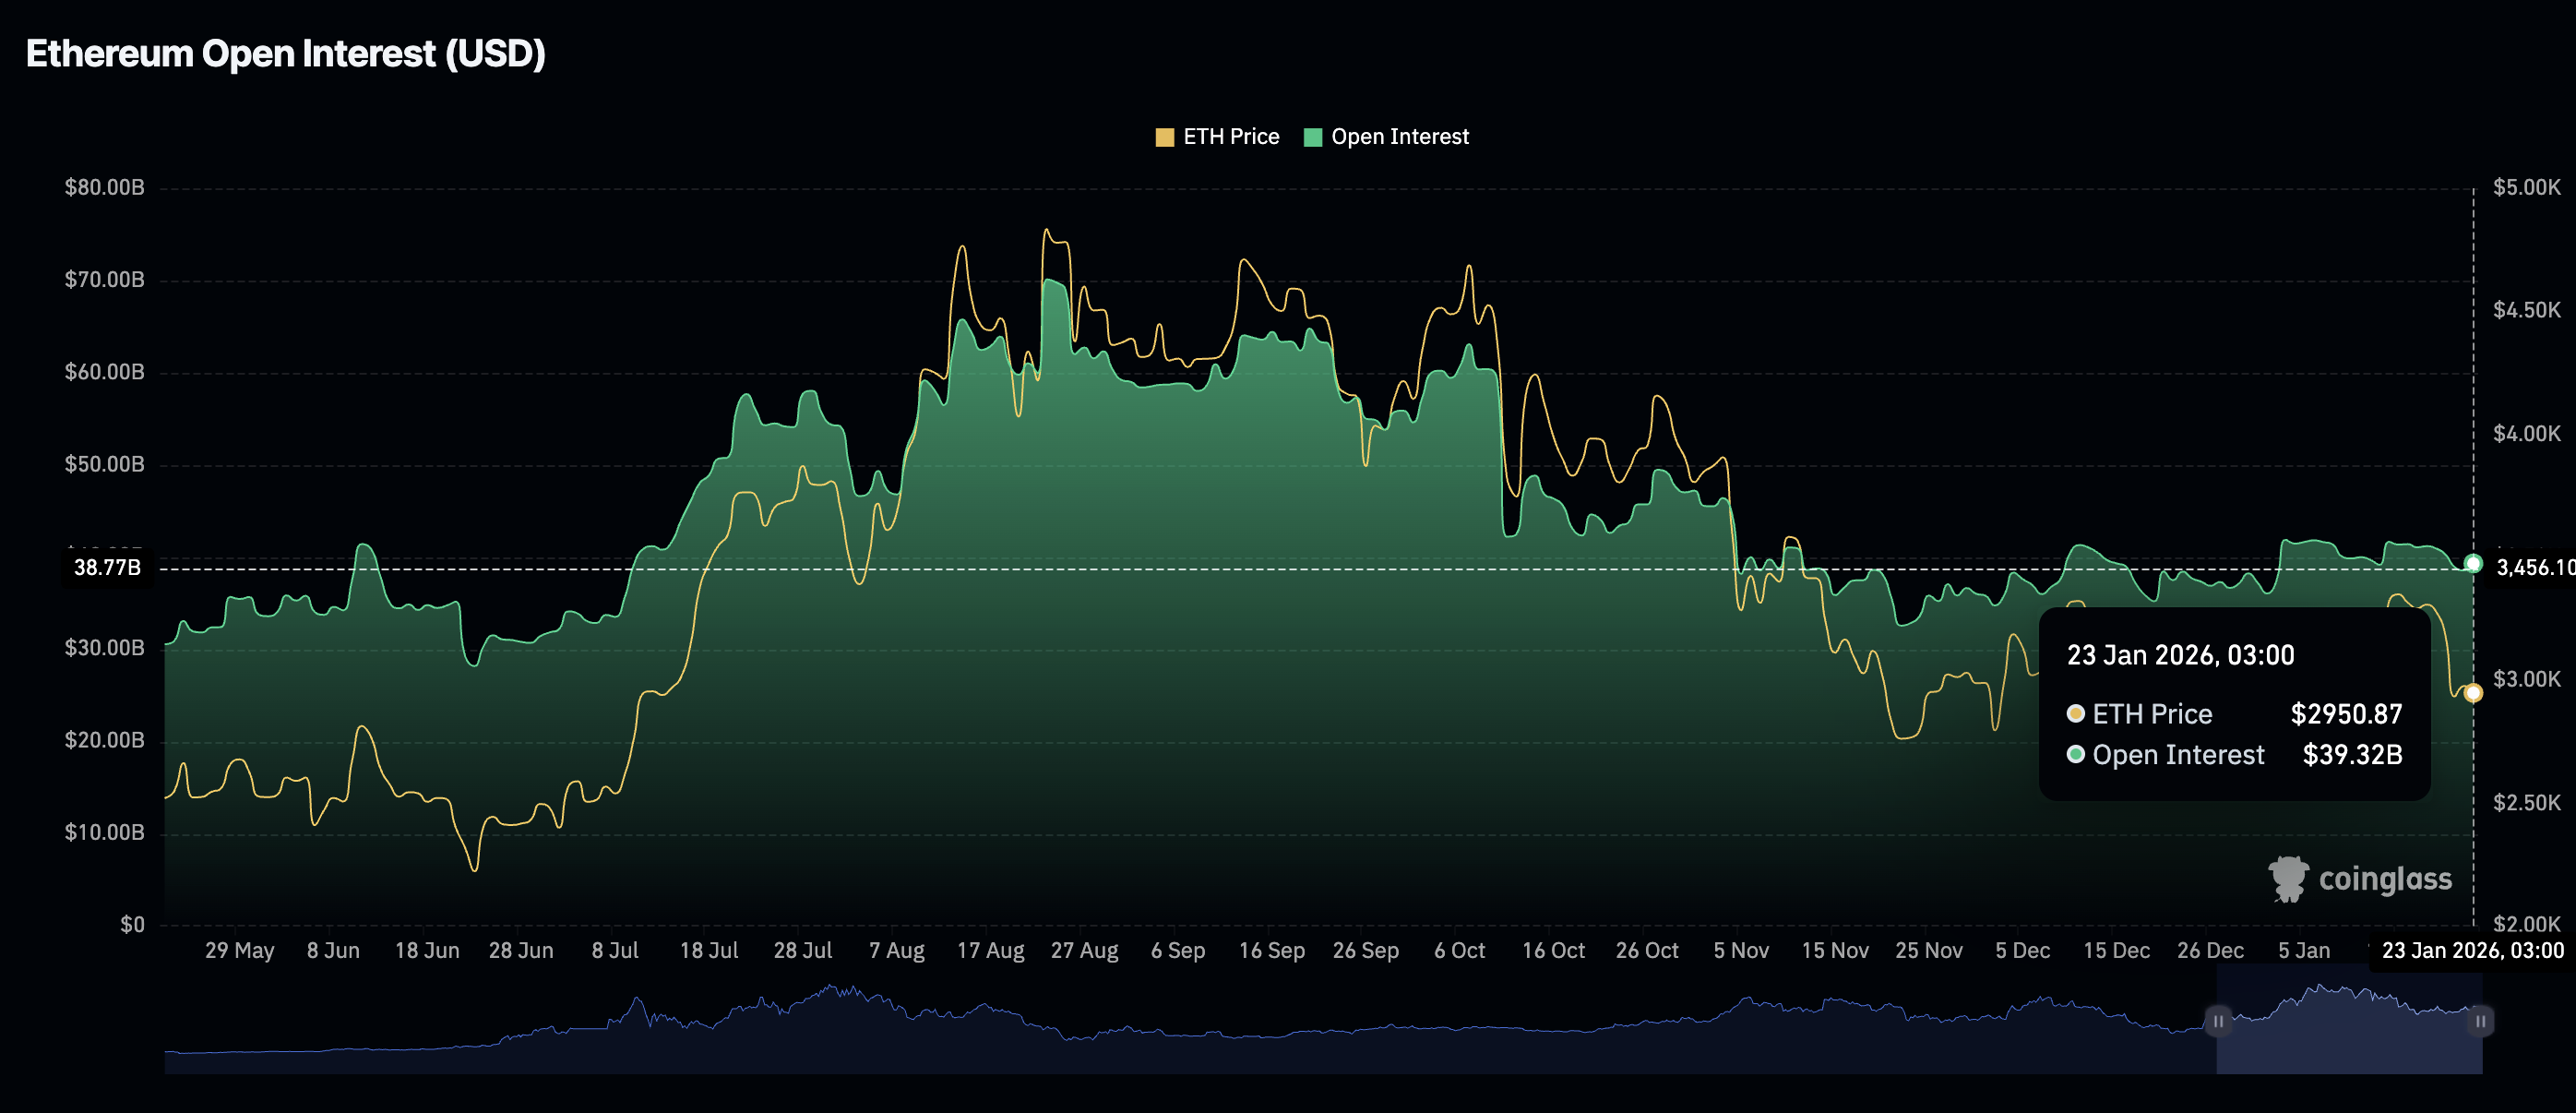
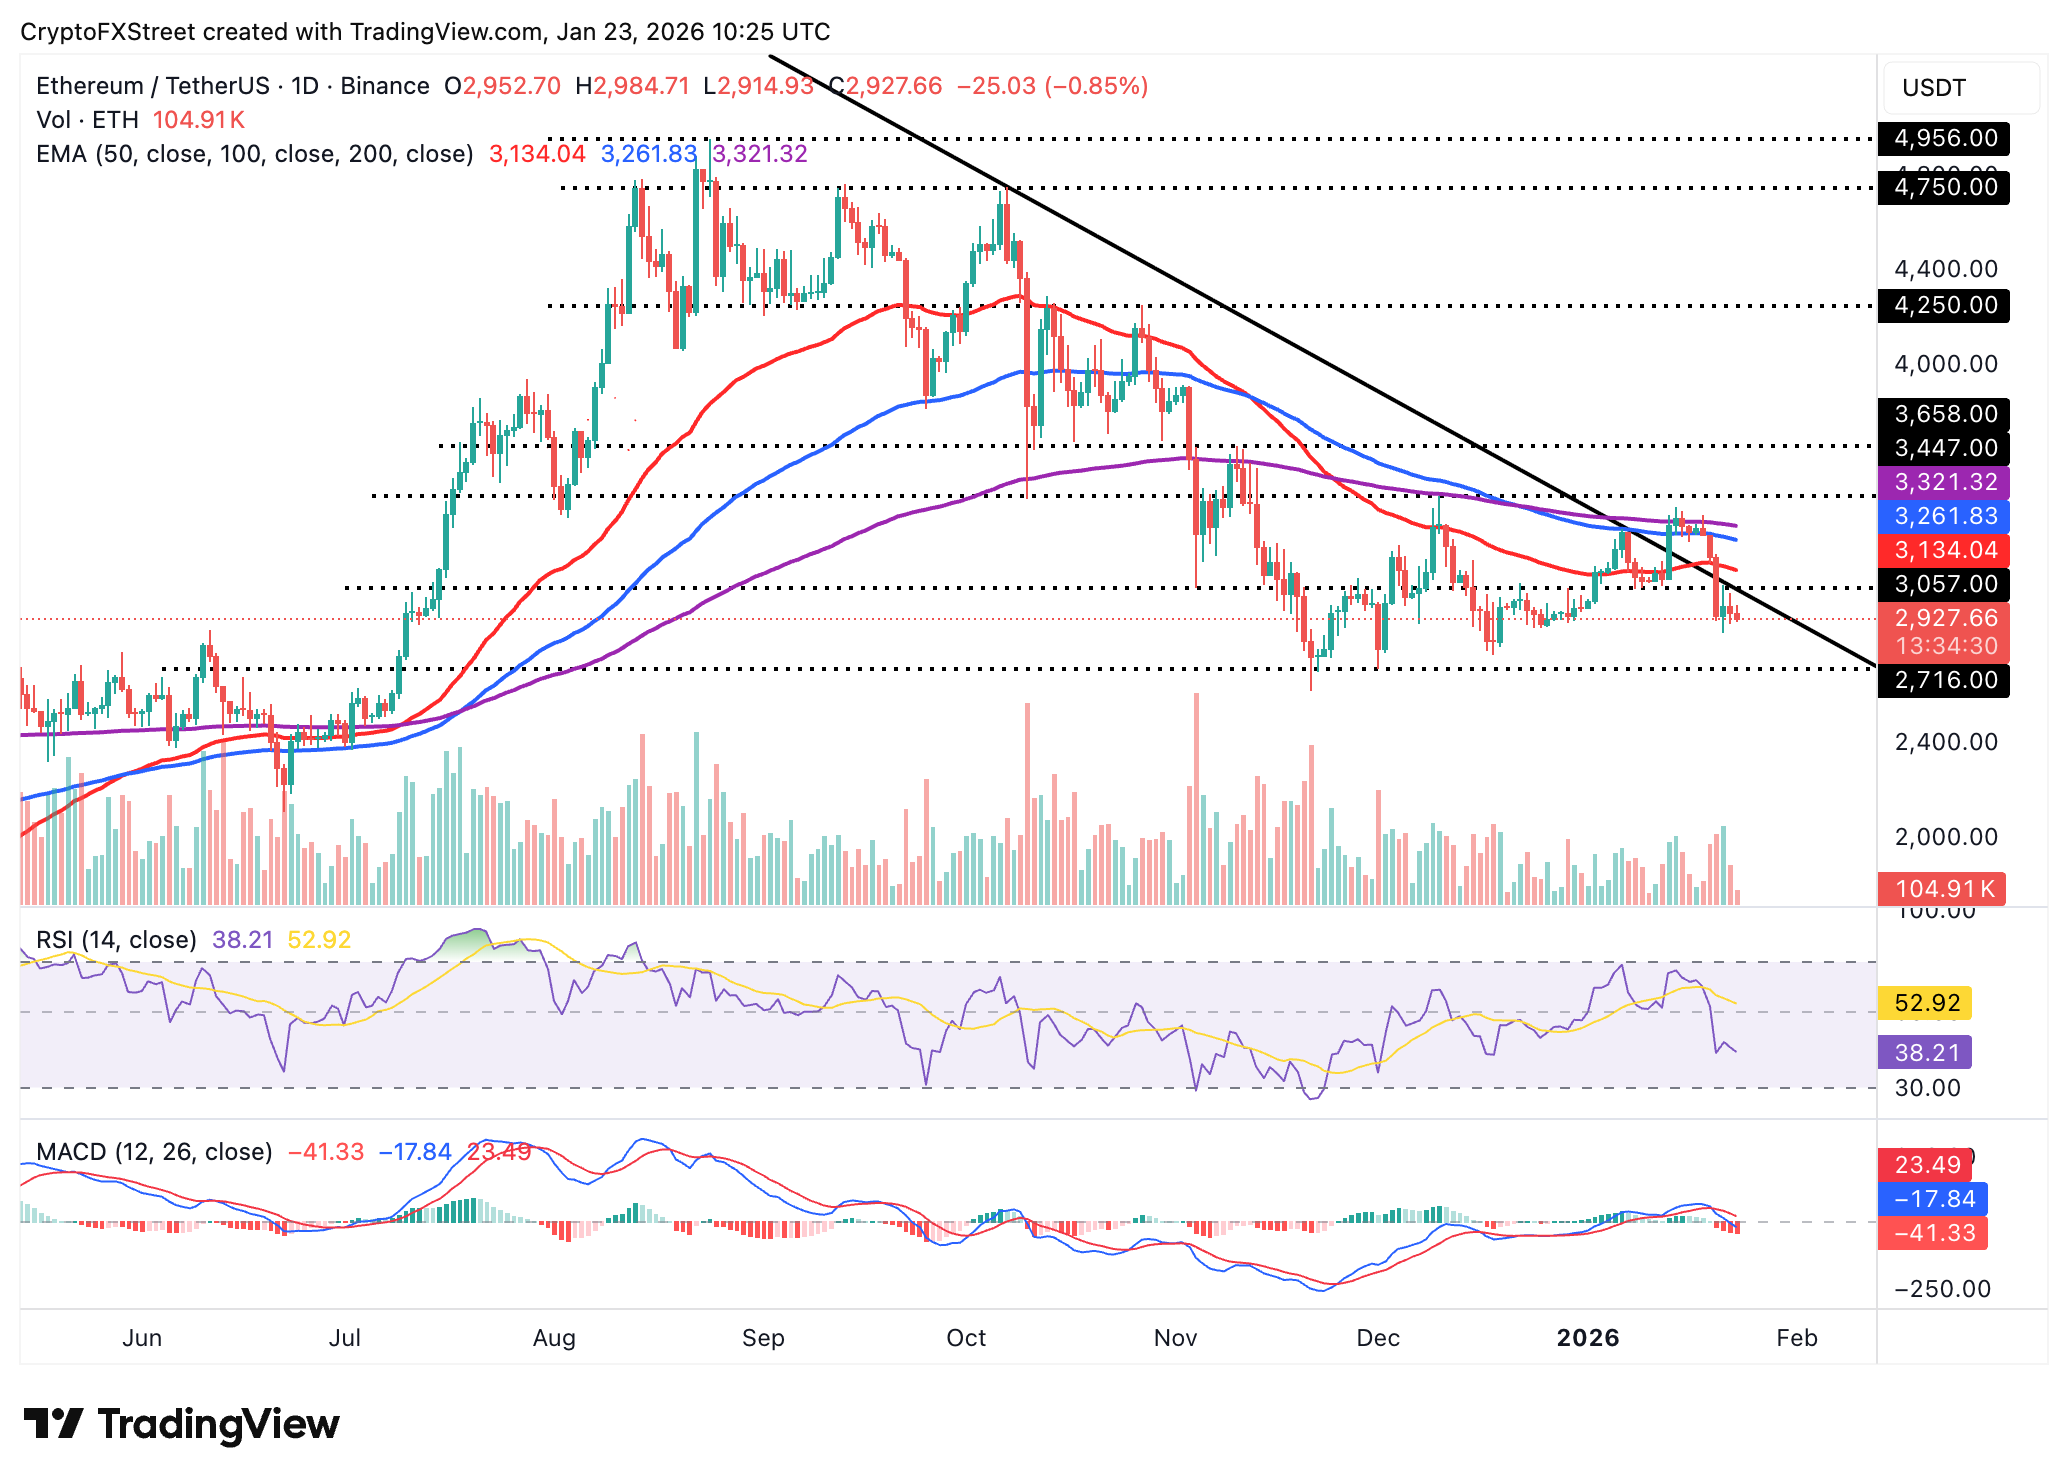
- Ethereum extends its correction for a second consecutive day despite a mild increase in Open Interest to $39.32 billion.
- XRP trades below the 50-day, 100-day, and 200-day EMAs, reinforcing a short-term bearish outlook.
Bitcoin (BTC) is struggling to stay above support at $89,000 at the time of writing, as headwinds intensify across the cryptocurrency market on Friday. Ethereum (ETH) and Ripple (XRP) are facing low retail and institutional demand, while bearish indicators continue to flash subtle signals that losses may extend further.
Low retail demand exposes Bitcoin, Ethereum, and XRP to further losses
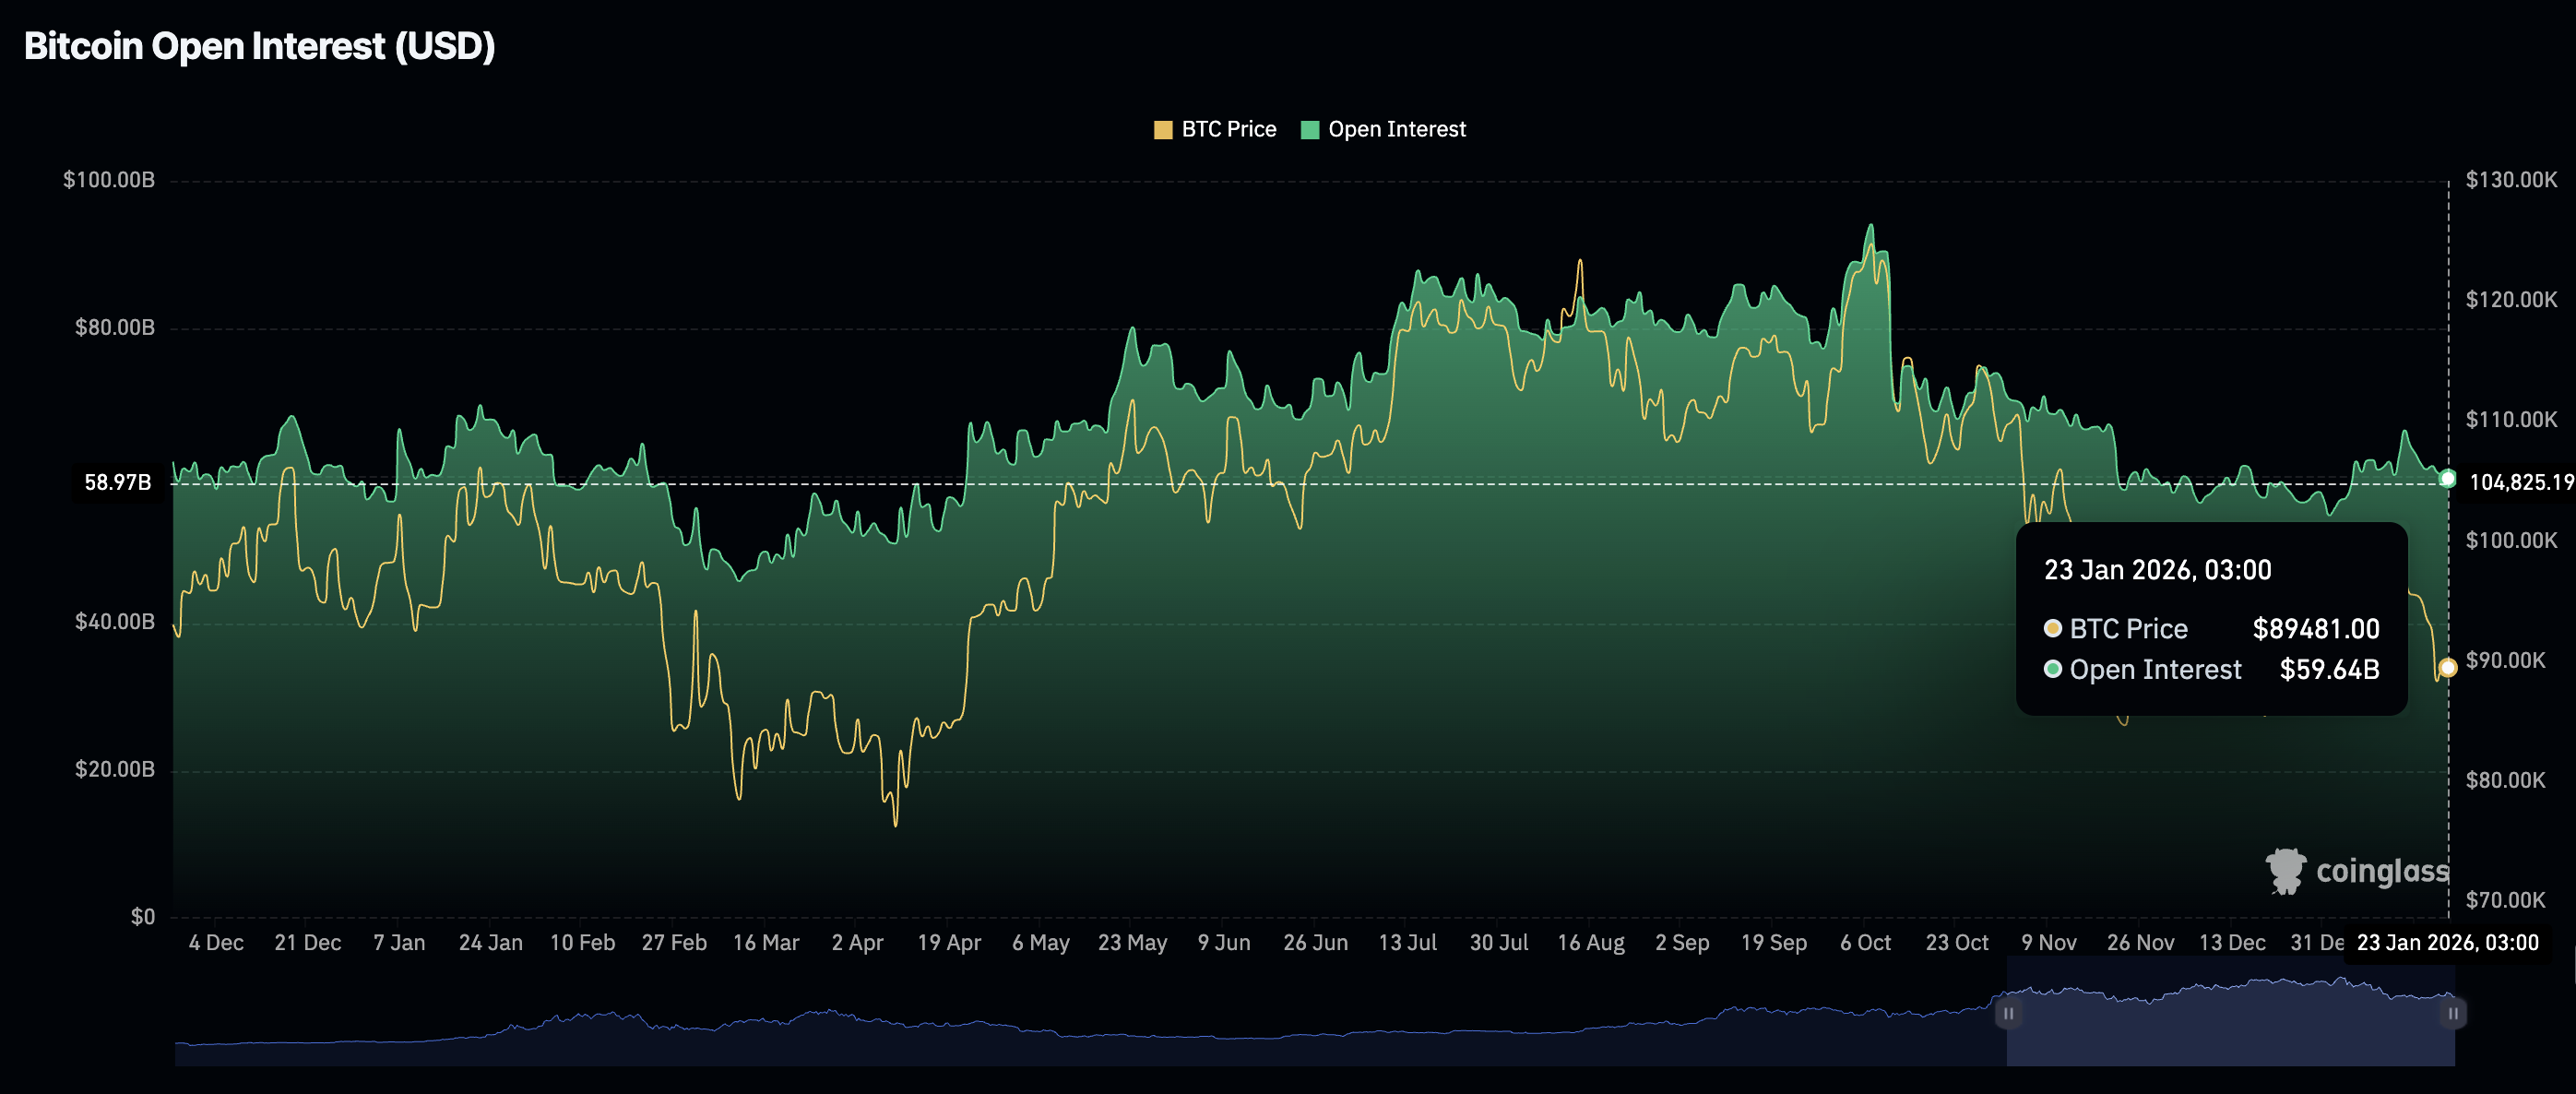
Demand for Bitcoin has remained largely subdued since the October 10 crash, with futures Open Interest (OI) averaging $59.64 billion on Friday, down from $60.13 billion the previous day, and $66.17 billion on January 15.
OI represents the notional value of outstanding futures contracts. CoinGlass shows demand for BTC derivatives propelled futures OI to a record $94.12 billion in October. Bitcoin hit a new all-time high of $126,199 on October 6, emphasizing the need for elevated retail interest and demand.
Ethereum is also facing a significant drawdown in the derivatives market amid continued selling pressure. While CoinGlass data shows futures OI increasing slightly to $39.32 billion on Friday, from $38.57 billion the previous day, it remains strikingly below the record of $70.13 billion reached in August.
Meanwhile, XRP is grappling with low retail demand, as pervasive negative sentiment erodes market confidence. After rising to $4.55 billion on January 6, futures OI has declined, averaging $3.33 billion on Friday. Extending the sell-off in derivatives would underline the risk-off mood, leaving XRP in bearish hands.
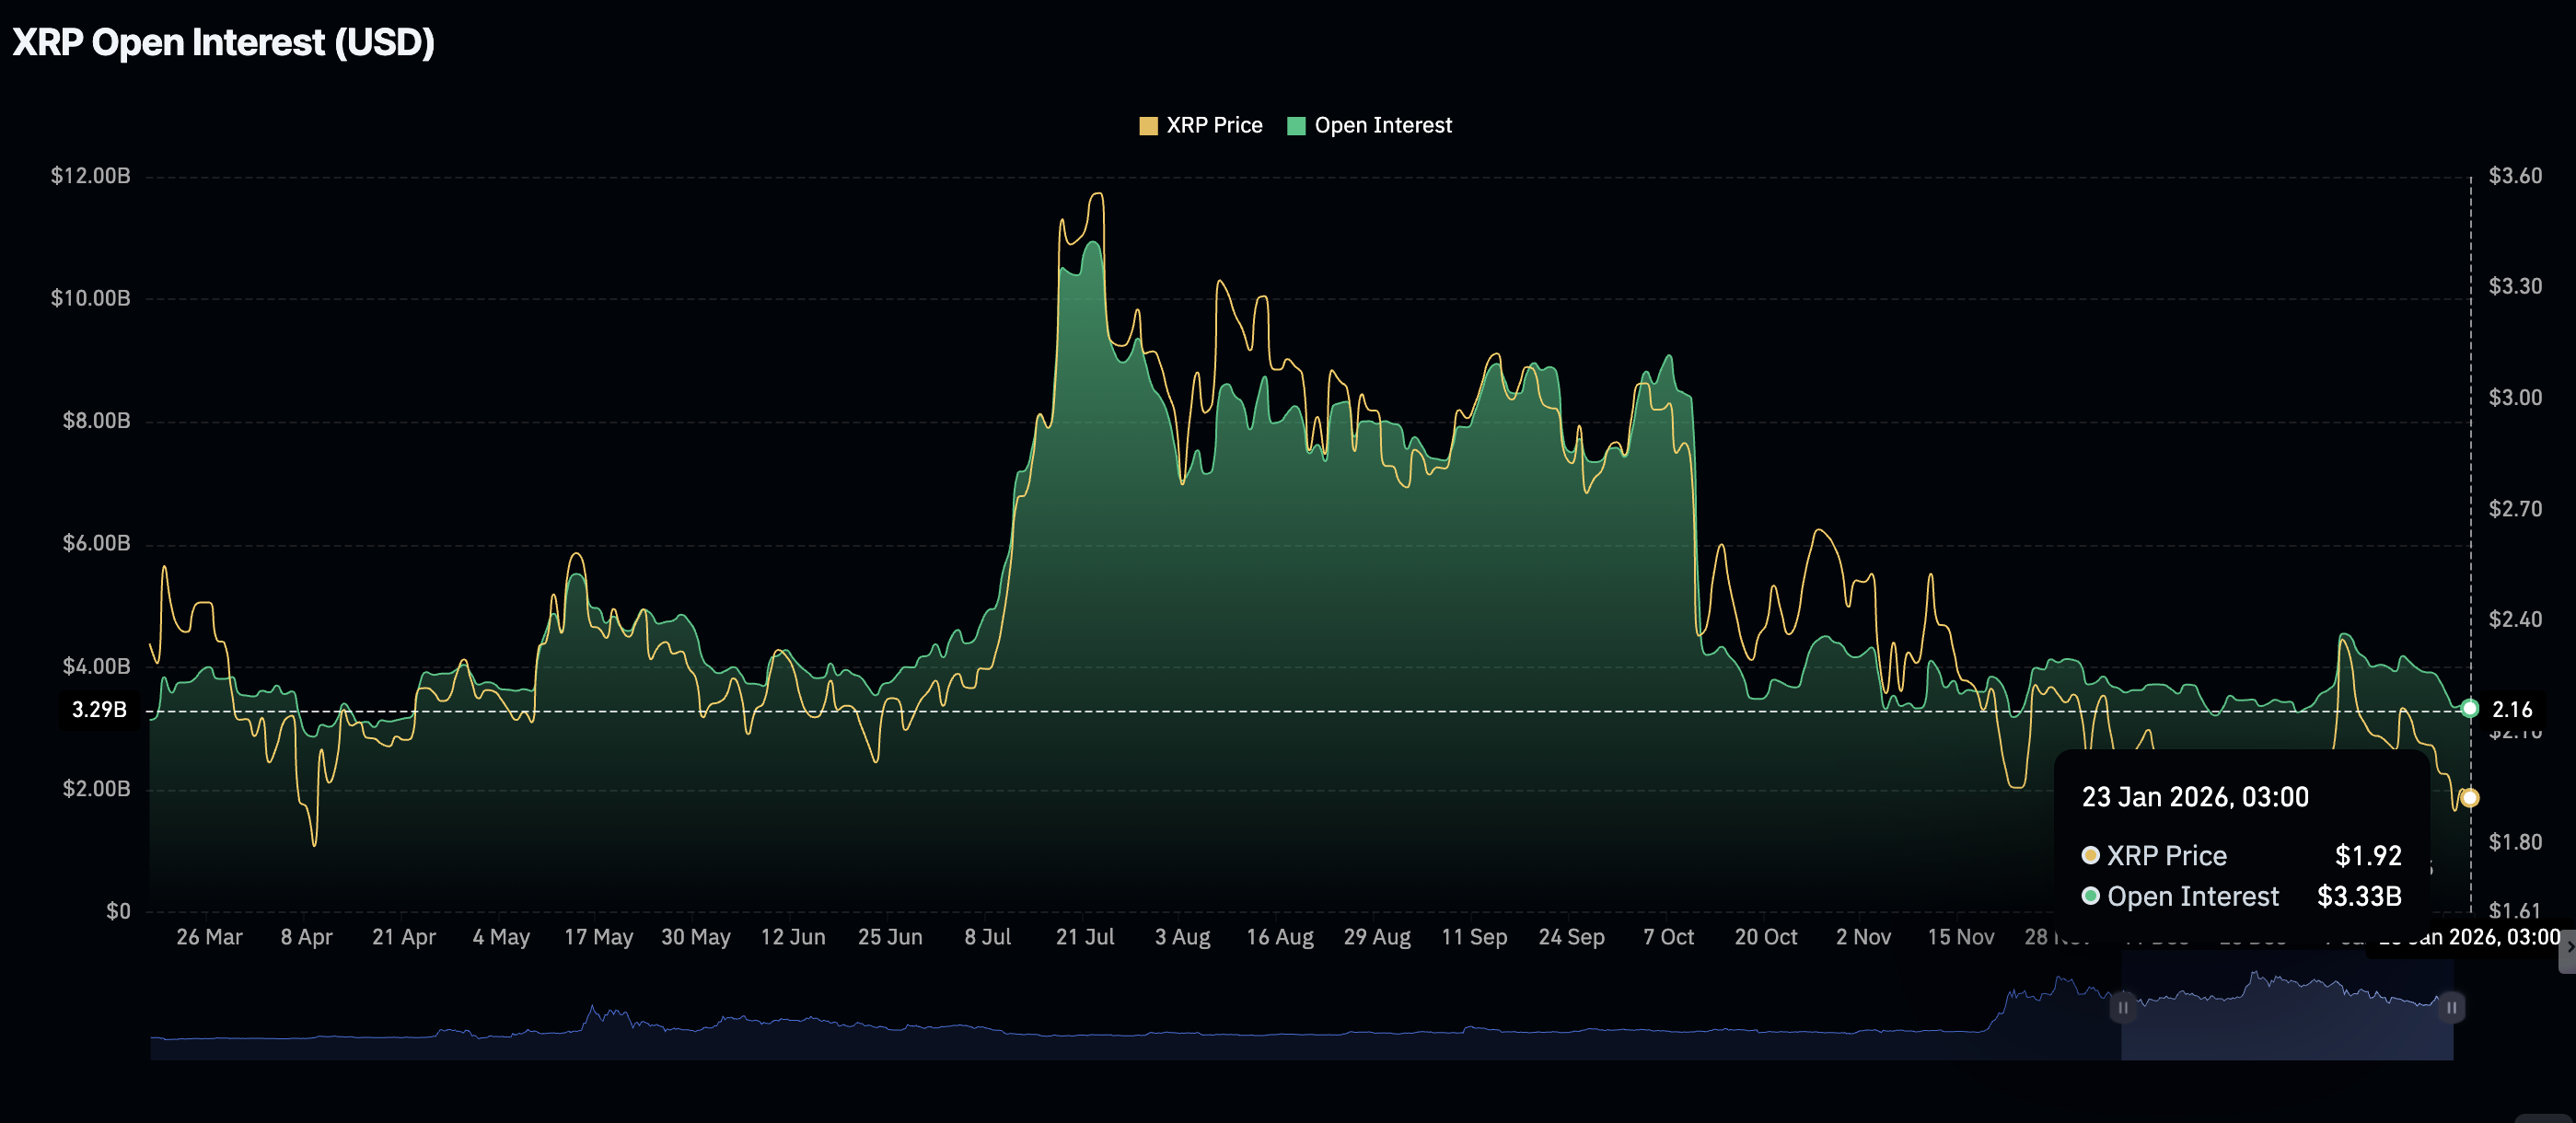
Chart of the day: Bitcoin trades under pressure
Bitcoin has extended its down leg toward the $89,000 threshold, as indicators continue to flash bearish signals. The Relative Strength Index (RSI) at 42 on the daily chart, is pointing downward, suggesting that BTC’s technical structure could continue to weaken.
The Moving Average Convergence Divergence (MACD) remains below its signal line on the same chart, prompting investors to reduce exposure. Bearish momentum may build, with the MACD histogram bars expanding below the zero line.
Still, holding support at $89,000 could signal stability and encourage risk-on sentiment. A return above $90,000 is required to keep bears in check.
Altcoins technical outlook: Ethereum, XRP wobble as selling pressure intensifies
Ethereum holds in a range between $2,900 and $3,000 amid the overall downward trend in the crypto market. The RSI at 38 on the daily chart is accelerating toward oversold territory, as bears tighten their grip.
The MACD indicator on the same chart remains below the signal line, which could prompt investors to reduce exposure and protect capital. A break below $2,900 could accelerate the downtrend to the December 1 low at $2,716.
Conversely, closing above the descending trendline could change ETH’s direction toward the 50-day Exponential Moving Average (EMA) at $3,134, the 100-day EMA at $3,262, and the 200-day EMA at $3,321.
As for XRP, the MACD indicator remains below the signal line on the daily chart, confirming the remittance token is trapped in bearish momentum. The histogram bars, which are expanding below the zero line, may prompt investors to reduce exposure. The area around $1.84 marks the next key support, with further losses likely to extend to April’s low at $1.61.
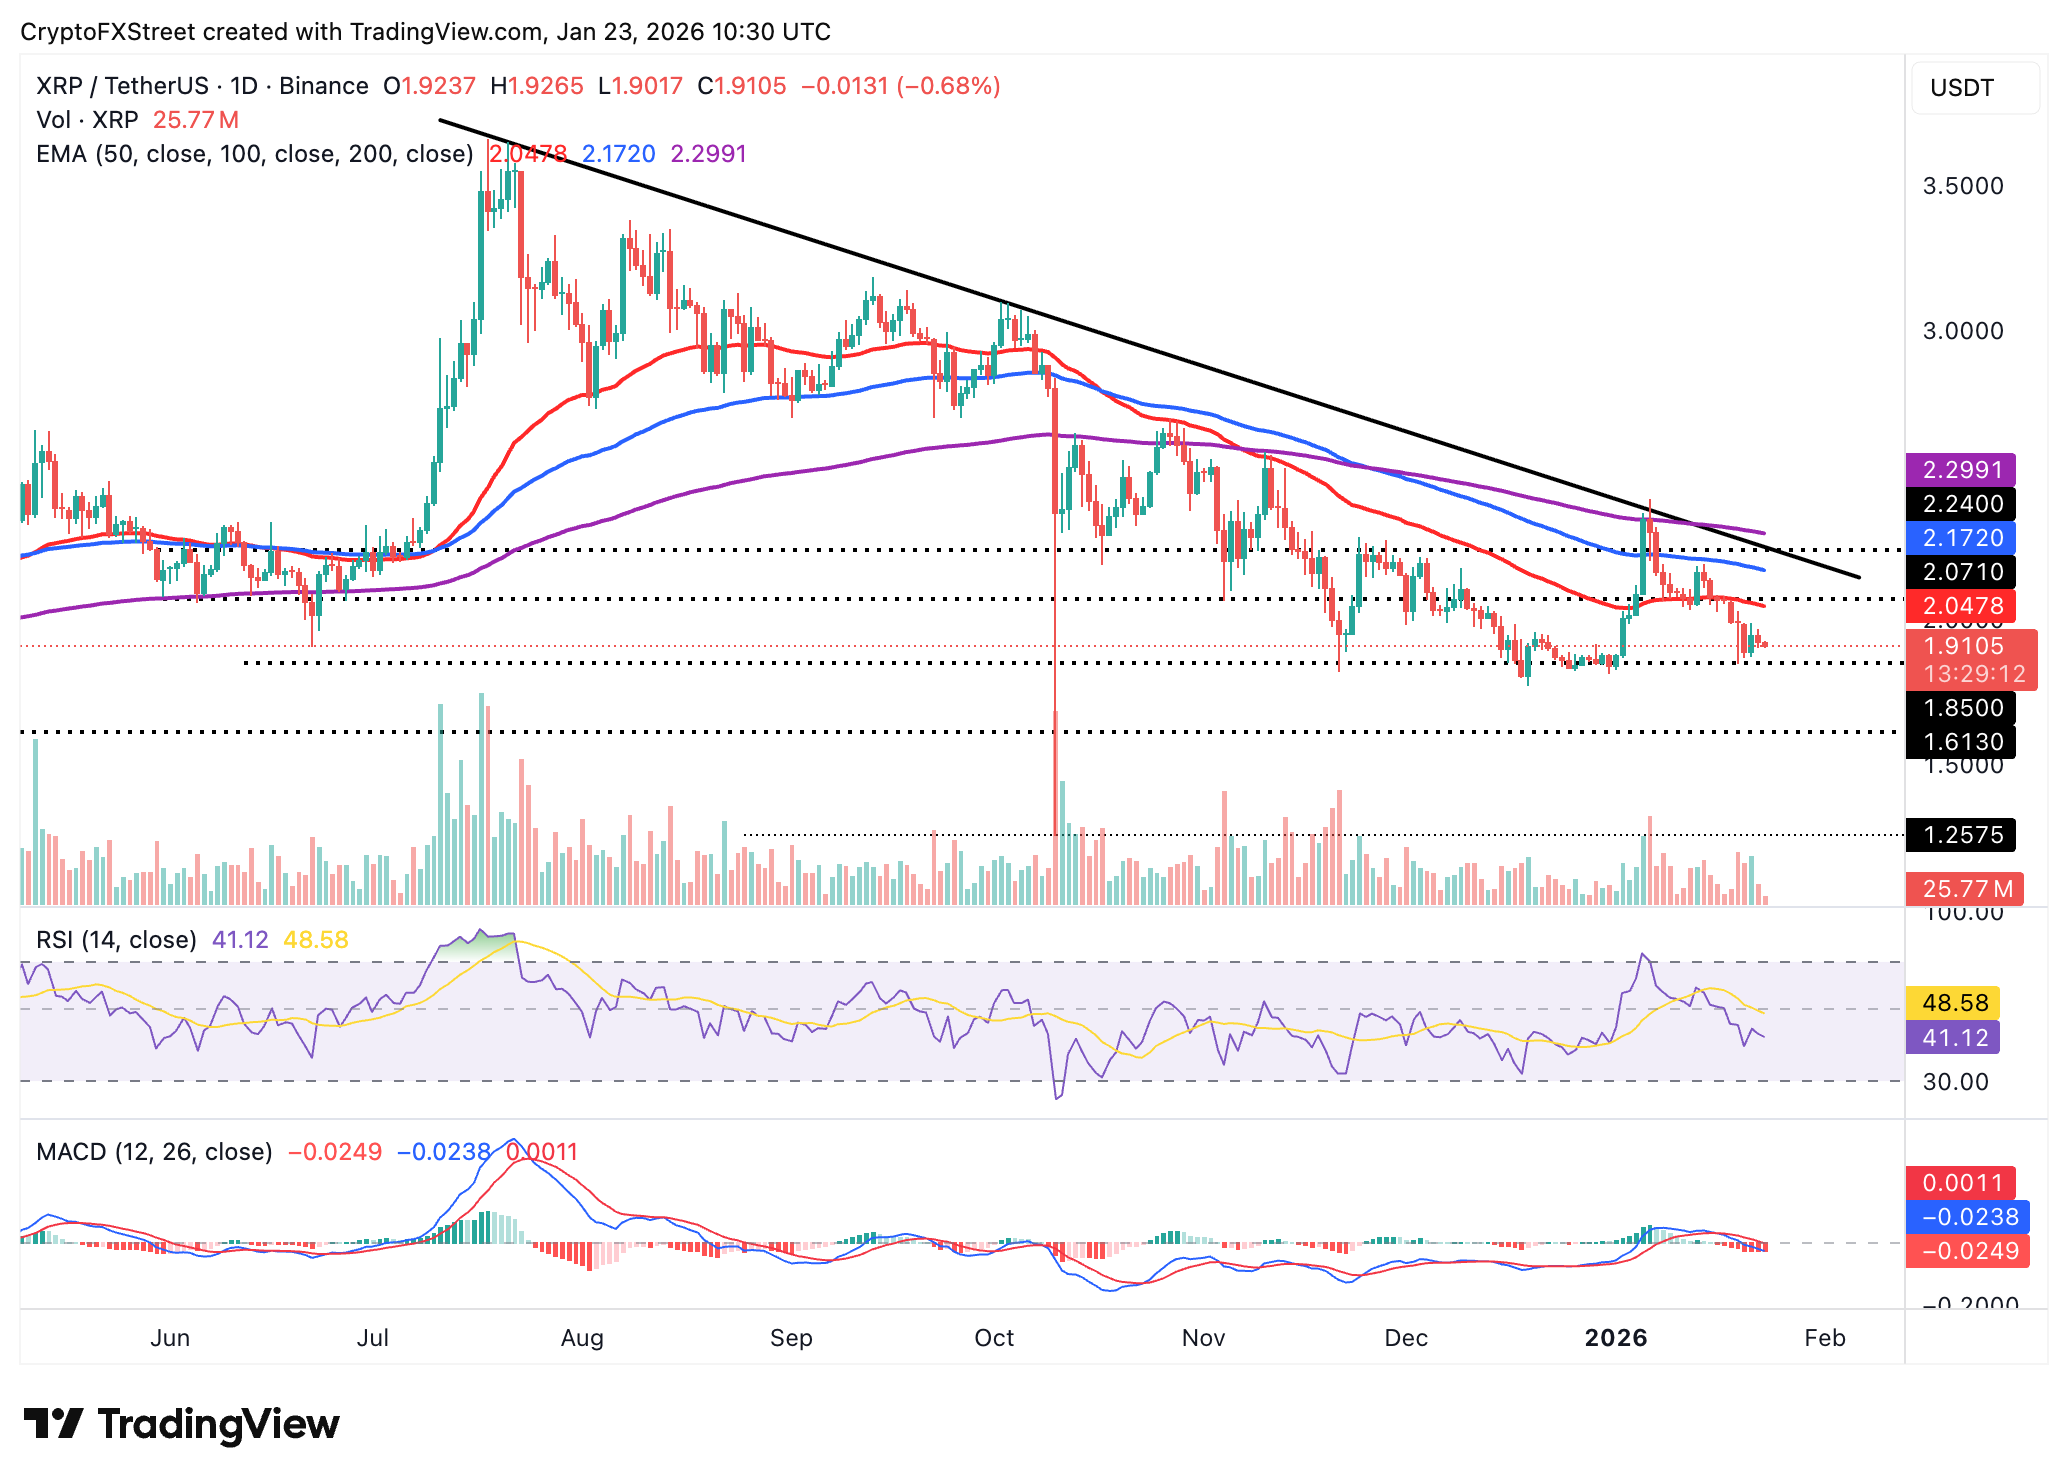
Meanwhile, the $1.90 support level remains critical for XRP to resume recovery and reclaim the $2.00 psychological threshold. Beyond this range, the 50-day EMA caps the upside at $2.05, the 100-day EMA at $2.17 and the 200-day EMA at $2.30.
Cryptocurrency metrics FAQs
The developer or creator of each cryptocurrency decides on the total number of tokens that can be minted or issued. Only a certain number of these assets can be minted by mining, staking or other mechanisms. This is defined by the algorithm of the underlying blockchain technology. On the other hand, circulating supply can also be decreased via actions such as burning tokens, or mistakenly sending assets to addresses of other incompatible blockchains.
Market capitalization is the result of multiplying the circulating supply of a certain asset by the asset’s current market value.
Trading volume refers to the total number of tokens for a specific asset that has been transacted or exchanged between buyers and sellers within set trading hours, for example, 24 hours. It is used to gauge market sentiment, this metric combines all volumes on centralized exchanges and decentralized exchanges. Increasing trading volume often denotes the demand for a certain asset as more people are buying and selling the cryptocurrency.
Funding rates are a concept designed to encourage traders to take positions and ensure perpetual contract prices match spot markets. It defines a mechanism by exchanges to ensure that future prices and index prices periodic payments regularly converge. When the funding rate is positive, the price of the perpetual contract is higher than the mark price. This means traders who are bullish and have opened long positions pay traders who are in short positions. On the other hand, a negative funding rate means perpetual prices are below the mark price, and hence traders with short positions pay traders who have opened long positions.

Higit sa isang milyong user ang umaasa sa FXStreet para sa real-time market data, charting tools, expert insights, at Forex news. Ang komprehensibong economic calendar at educational webinars nito ay tumutulong sa mga trader na manatiling may alam at gumawa ng kalkuladong mga desisyon. Sinusuportahan ang FXStreet ng humigit-kumulang 60 propesyonal sa pagitan ng Barcelona HQ at iba’t ibang rehiyon sa buong mundo.
Magbasa pa


