
Crypto Today: Bitcoin, Ethereum, XRP trade lower amid US-Iran uneasy ceasefire, ETF outflows
Ni John Isige
Na-update: 9 Apr 2026


Sikat na Artikulo

The crypto market is struggling to hold onto modest early-weekly gains on Thursday, as concerns over the United States (US) and Iran ceasefire deal keep markets on edge. Bitcoin (BTC) is battling to gain momentum above $70,000 after a rejection from its weekly high of $72,857.
- Bitcoin corrects for a second consecutive day but holds the 50-day EMA amid doubts over the US-Iran ceasefire.
- Ethereum drops below $2,200 as profit-taking and ETF outflows weigh.
- XRP upside remains capped within a broader downtrend, defined by descending major moving averages.
The crypto market is struggling to hold onto modest early-weekly gains on Thursday, as concerns over the United States (US) and Iran ceasefire deal keep markets on edge. Bitcoin (BTC) is battling to gain momentum above $70,000 after a rejection from its weekly high of $72,857. Altcoins, including Ethereum (ETH) and Ripple (XRP), are edging lower, trading below $2,200 and $1.35, respectively.
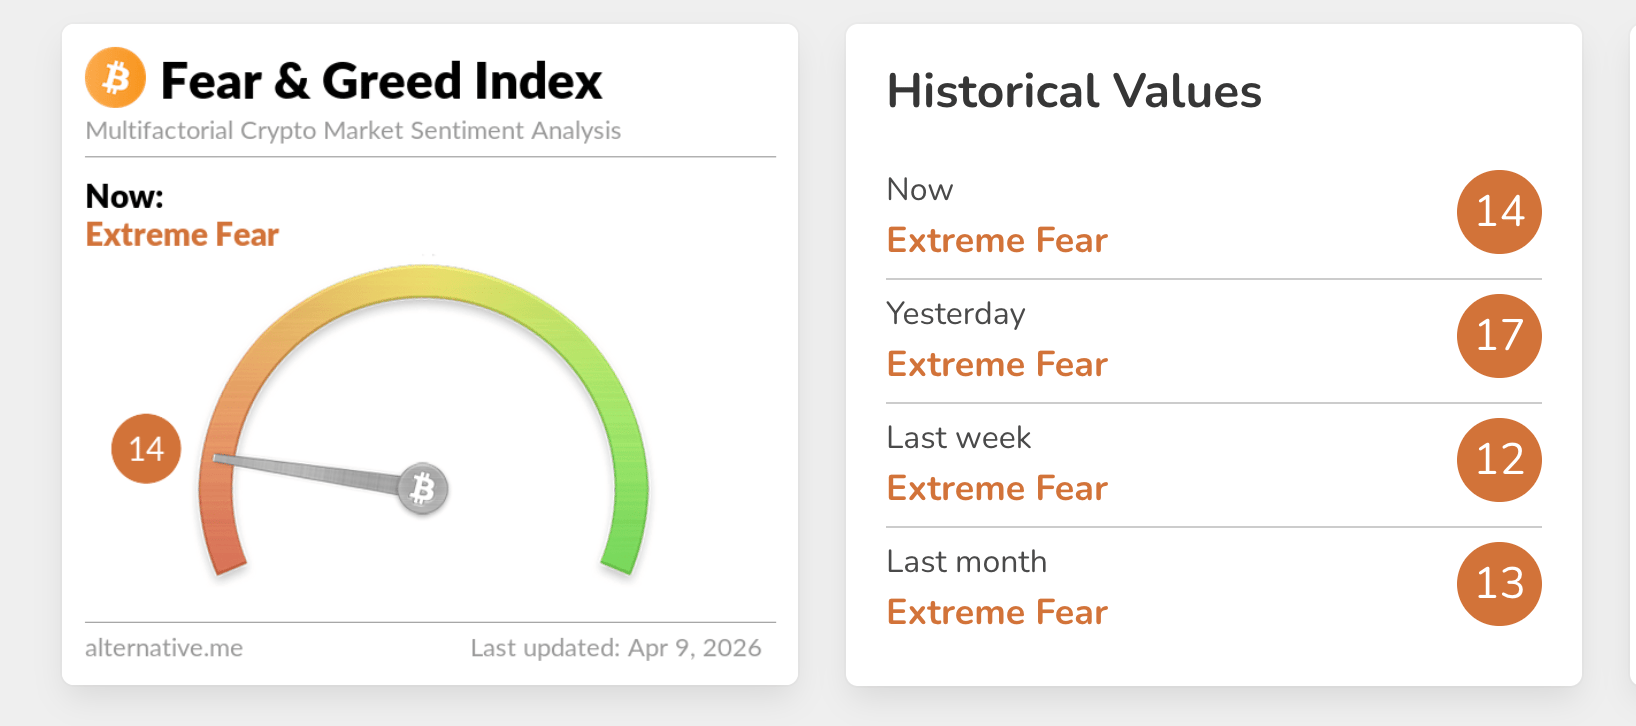
Interest in crypto assets appears to wobble amid deteriorating risk sentiment. The Fear & Greed Index is reading 14 in the extreme fear territory on Thursday, down from 17 the previous day.
US-Iran edgy ceasefire pressures Bitcoin, Ethereum and XRP
The US and Iran ceasefire deal continues to hold amid constraints, with Iran halting traffic through the Strait of Hormuz, Israel carrying on with strikes on Lebanon and conflicting reports regarding a long-term peace plan.
US President Donald Trump has warned that attacks will resume if a deal with Iran is not reached, adding that troops will remain stationed in the Middle East region. Trump has also rejected Iran’s publicized 10-point peace plan, arguing that the regime had put forth an entirely different negotiation position during the private talks.
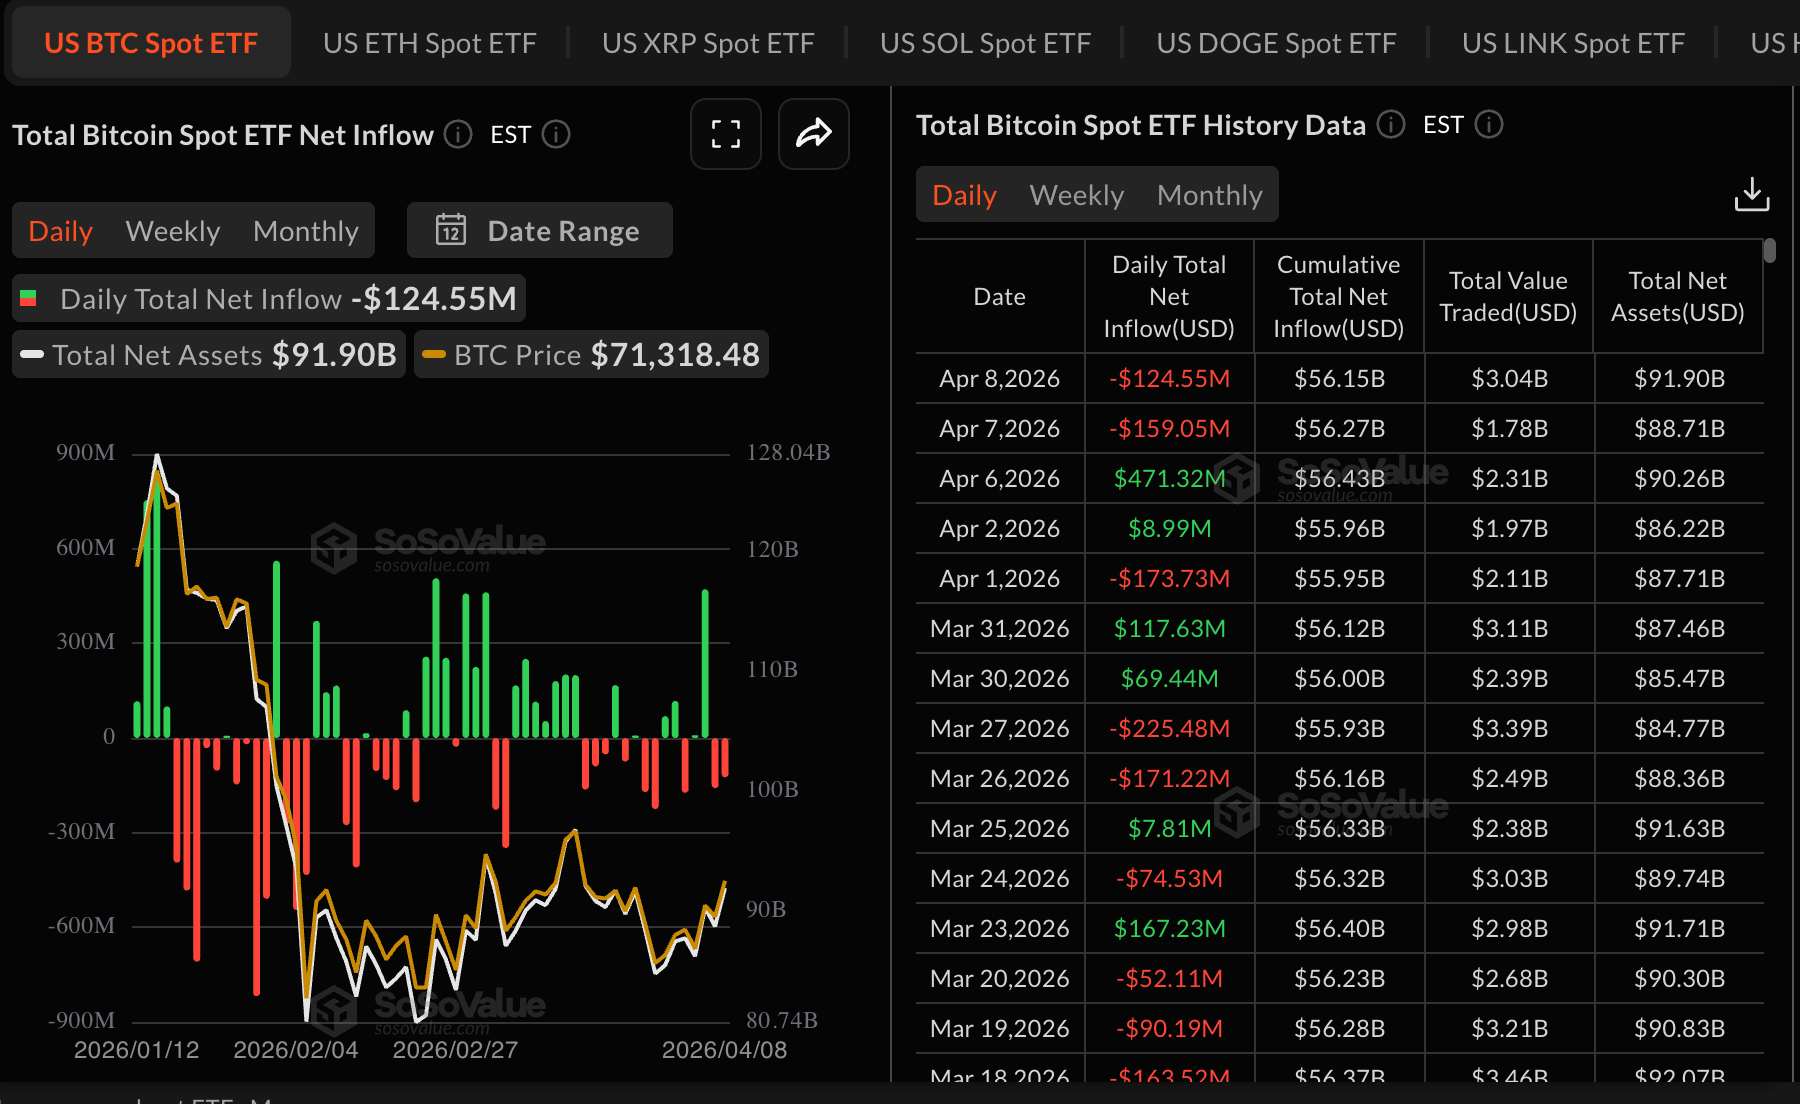
Meanwhile, investors appear to be sitting on the sidelines, as reflected in outflows from Exchange-Traded Funds (ETFs). SoSoValue data shows that nearly $125 million was withdrawn from US-listed BTC spot ETFs on Wednesday, bringing the cumulative inflows to $56.15 billion and net assets under management to $91.90 billion.
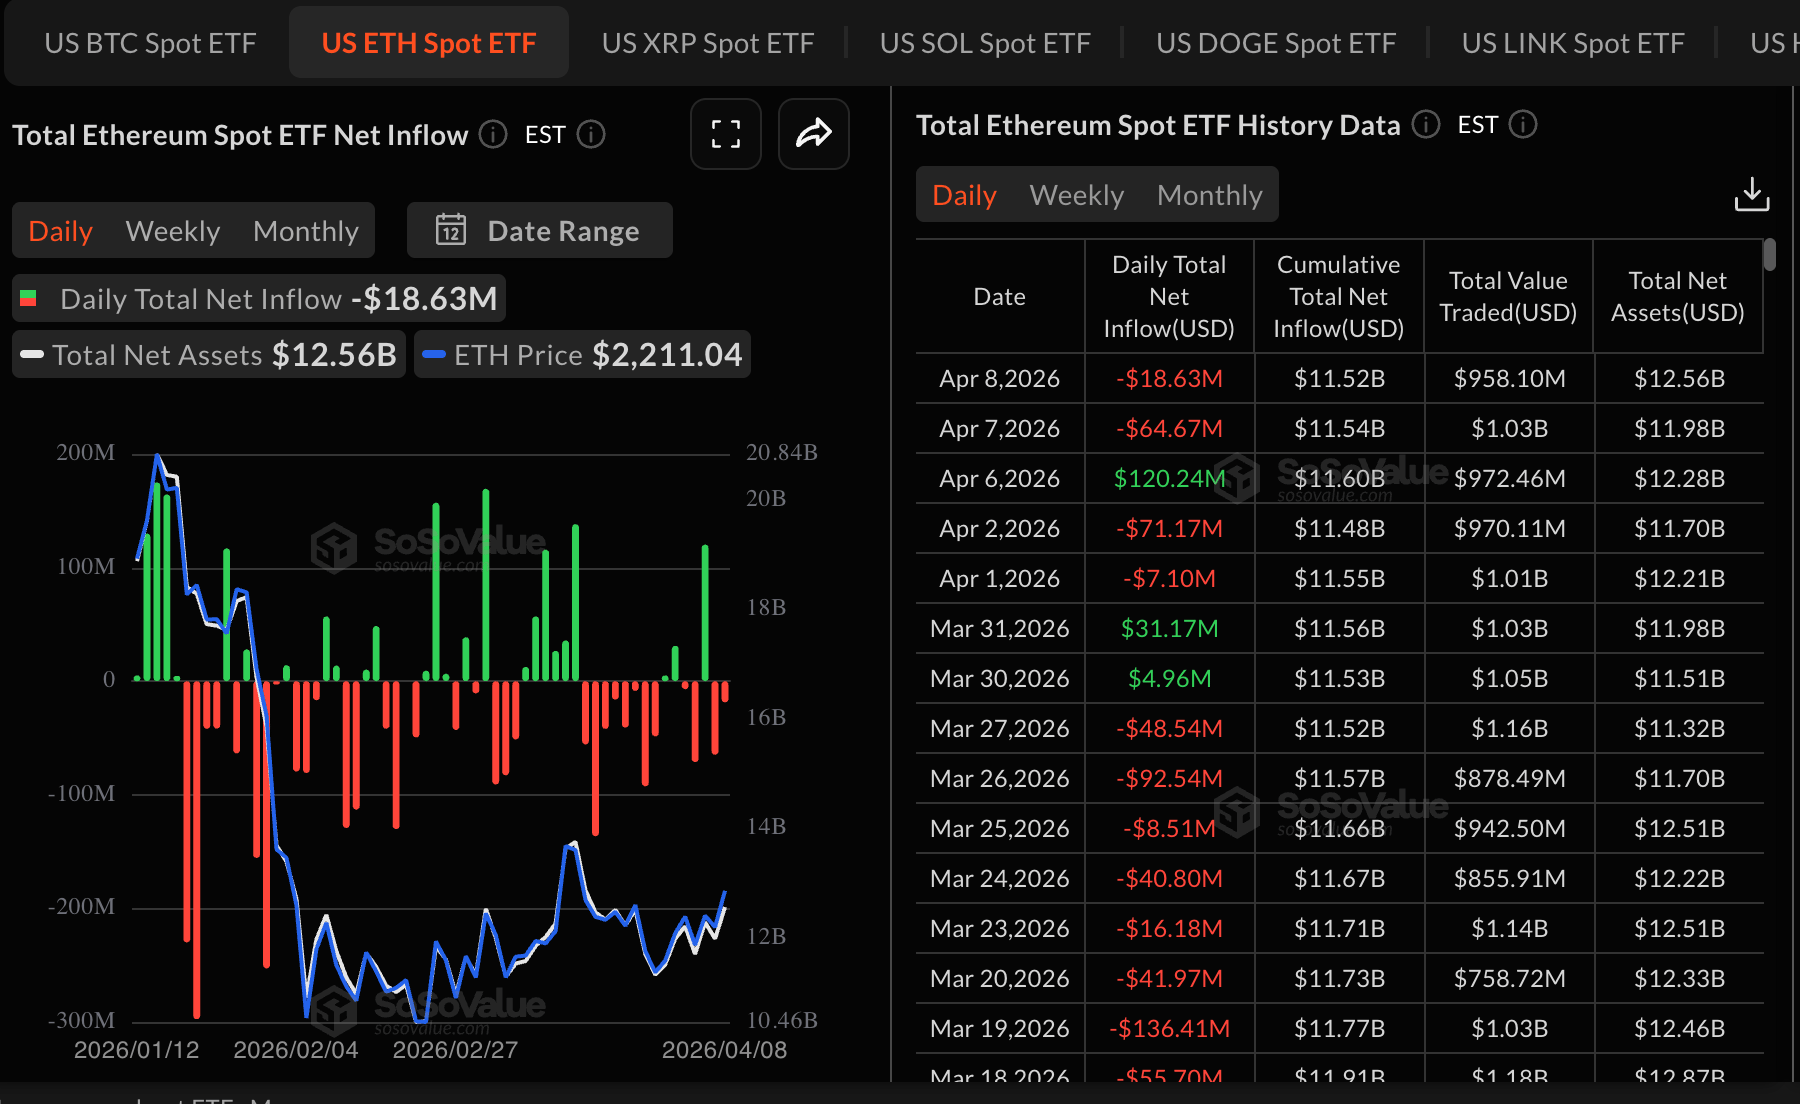
Ethereum ETFs also suffered outflows totaling nearly $19 million on Wednesday, extending the bearish streak from Tuesday when roughly $65 million was withdrawn from the US-listed investment products. Cumulative inflows stand at $11.52 billion, and net assets under management at $12.96 billion.
Meanwhile, activity in XRP spot ETFs remained muted on Wednesday, with cumulative inflows steadying at $1.21 billion and net assets at approximately $950 million.
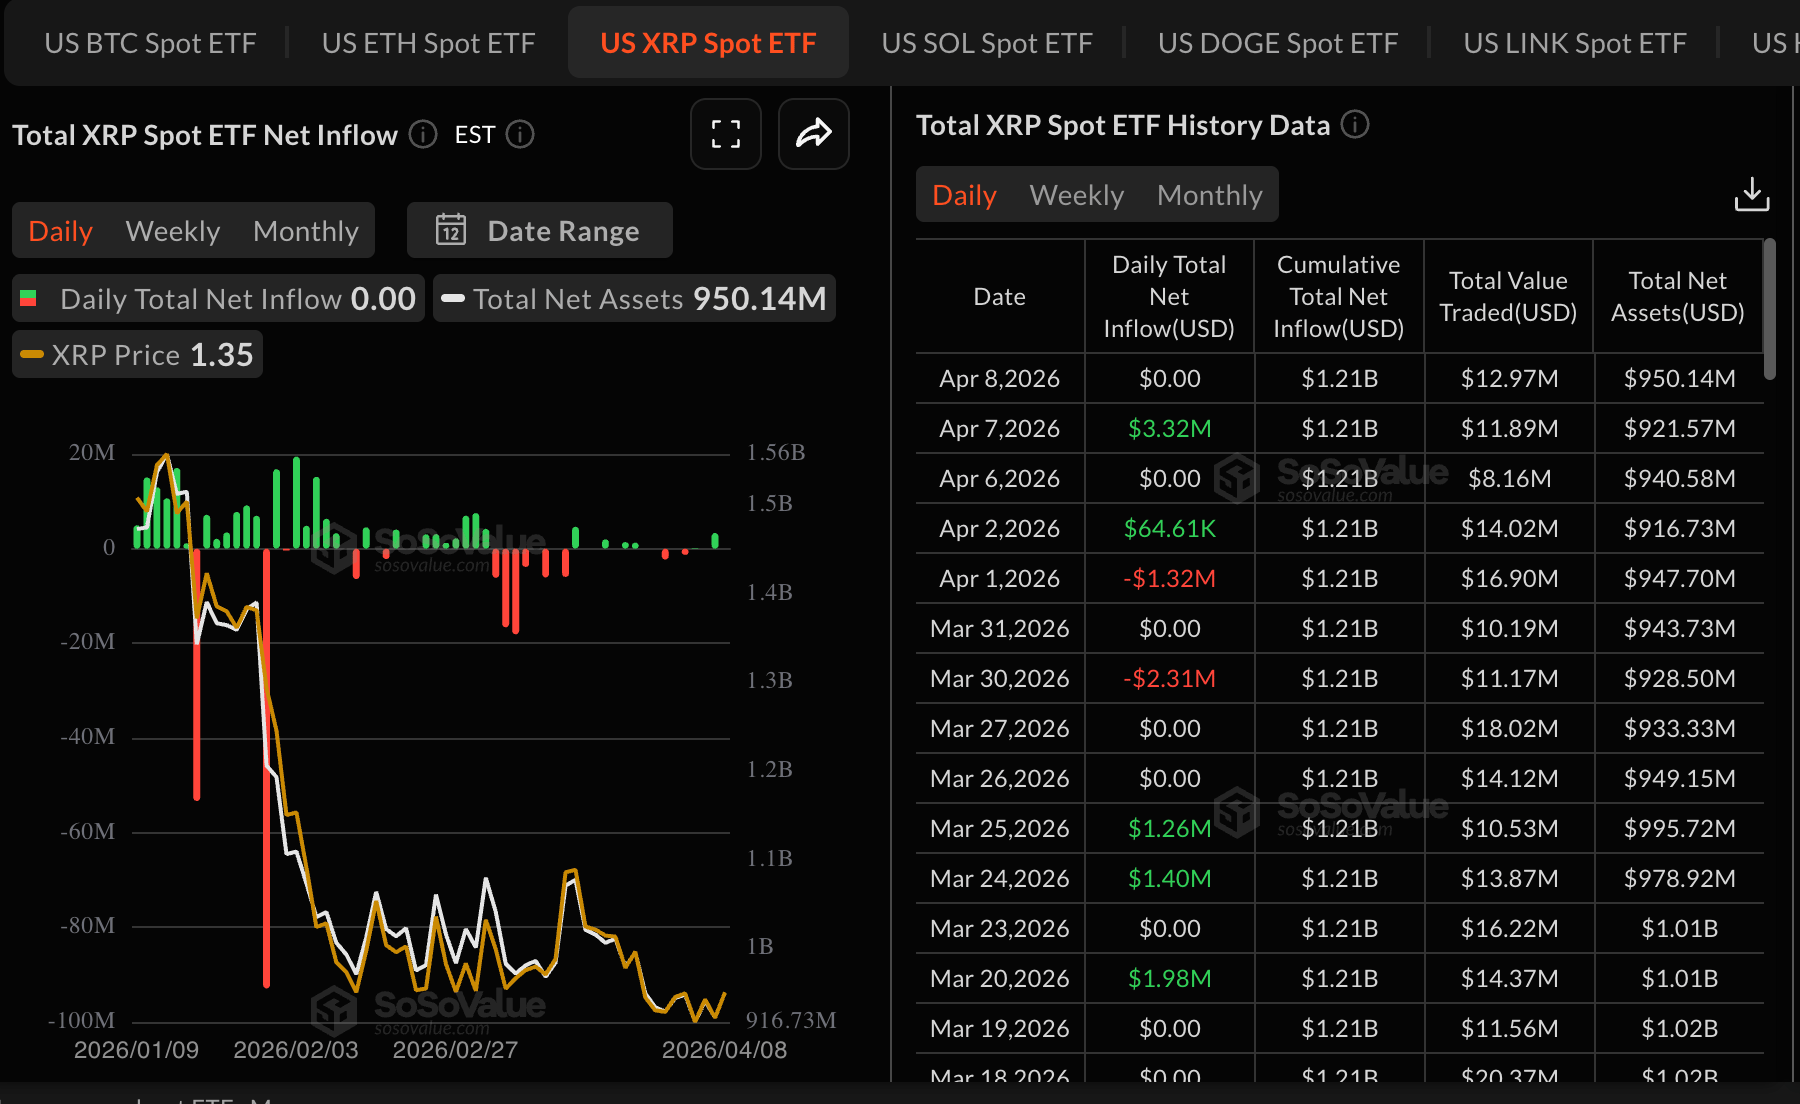
Chart of the day: Bitcoin consolidates above key support
Bitcoin is trading at around $70,950 at the time of writing on Thursday, retaining a constructive near-term bias as it holds above the 50-day Exponential Moving Average (EMA) at roughly $70,512. However, Bitcoin's price remains below the 100-day EMA near $75,511 and the broader downtrend resistance drawn from the all-time high of $126,199, so the bullish tone is still considered a recovery phase rather than a clear breakout.
The Moving Average Convergence Divergence (MACD) histogram is positive and expanding, while the Relative Strength Index (RSI) around 56 remains in positive territory on the daily chart, suggesting upside momentum is building but still needs a decisive move through overhead levels to accelerate.
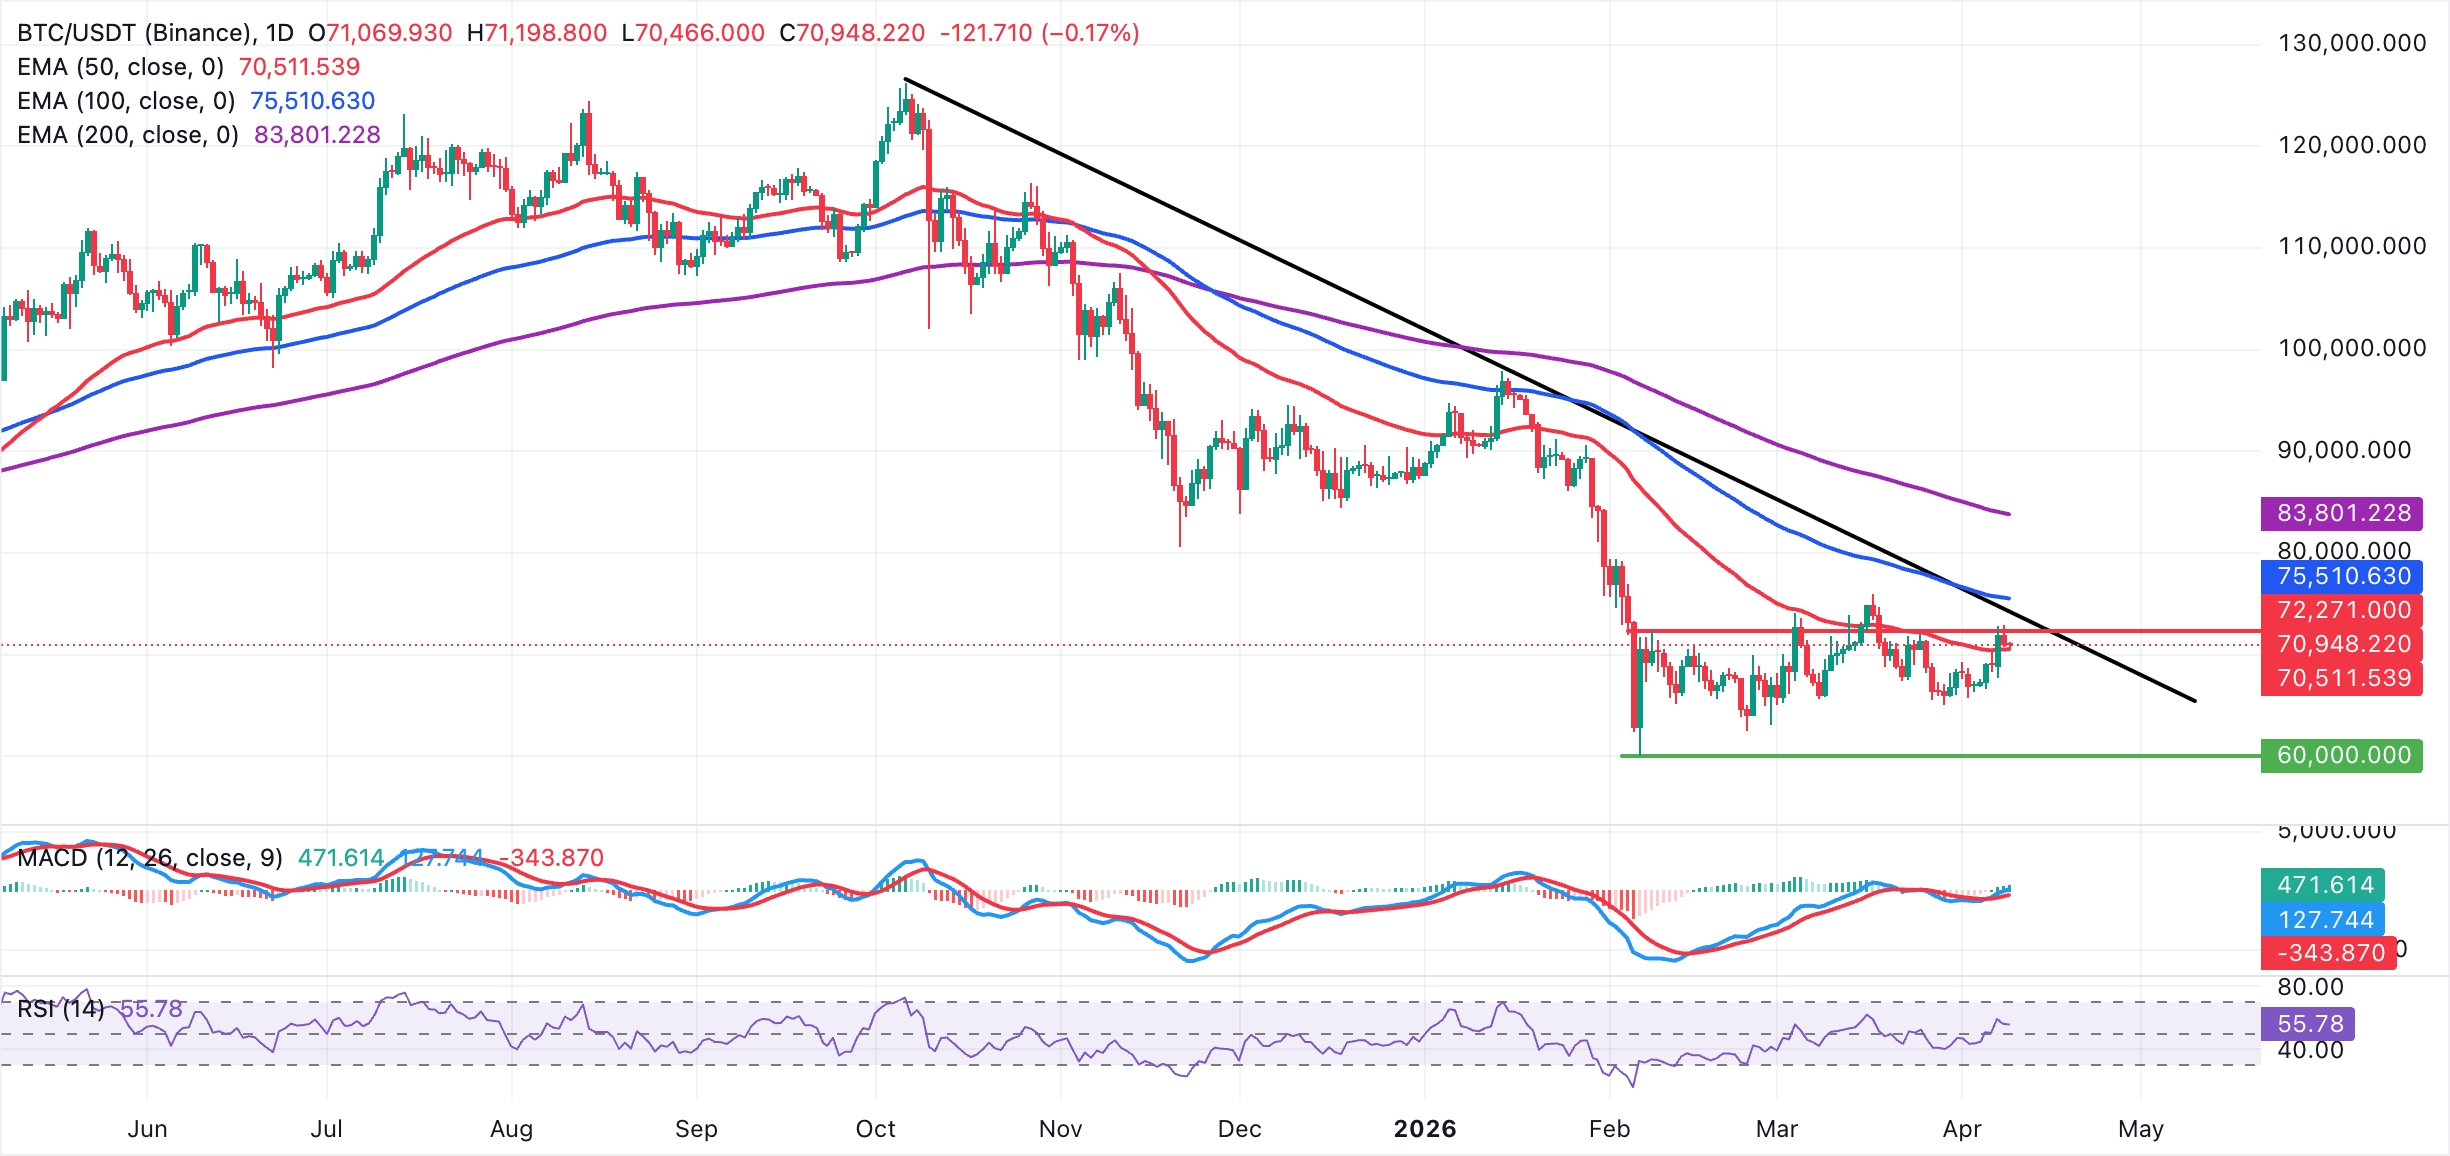
Bitcoin's initial support is defined by the 50-day EMA at $70,512. A daily close below it would signal fading demand and open the door to a deeper pullback. On the topside, immediate resistance is seen first at the weekly high of $72,857, the descending trendline barrier near $74,111, followed by the 100-day EMA at about $75,511. Moreover, the 200-day EMA up near $83,801 remains a more distant bullish objective should buyers regain control on a sustained basis.
Altcoins technical outlook: Ethereum and XRP struggle as overhead pressure expands
Ethereum is hovering at around $2,180, holding a neutral-to-slightly bullish stance as price has reclaimed the 50-day EMA at $2,152. Still, the smart contract token remains capped well below the 100-day EMA at $2,364 and the longer-term 200-day EMA at $2,689. Momentum is neutral, with the RSI consolidating at 56 on the daily chart and the MACD in positive territory. This outlook suggests that buyers have the upper hand in the short run but still face significant supply constraints.
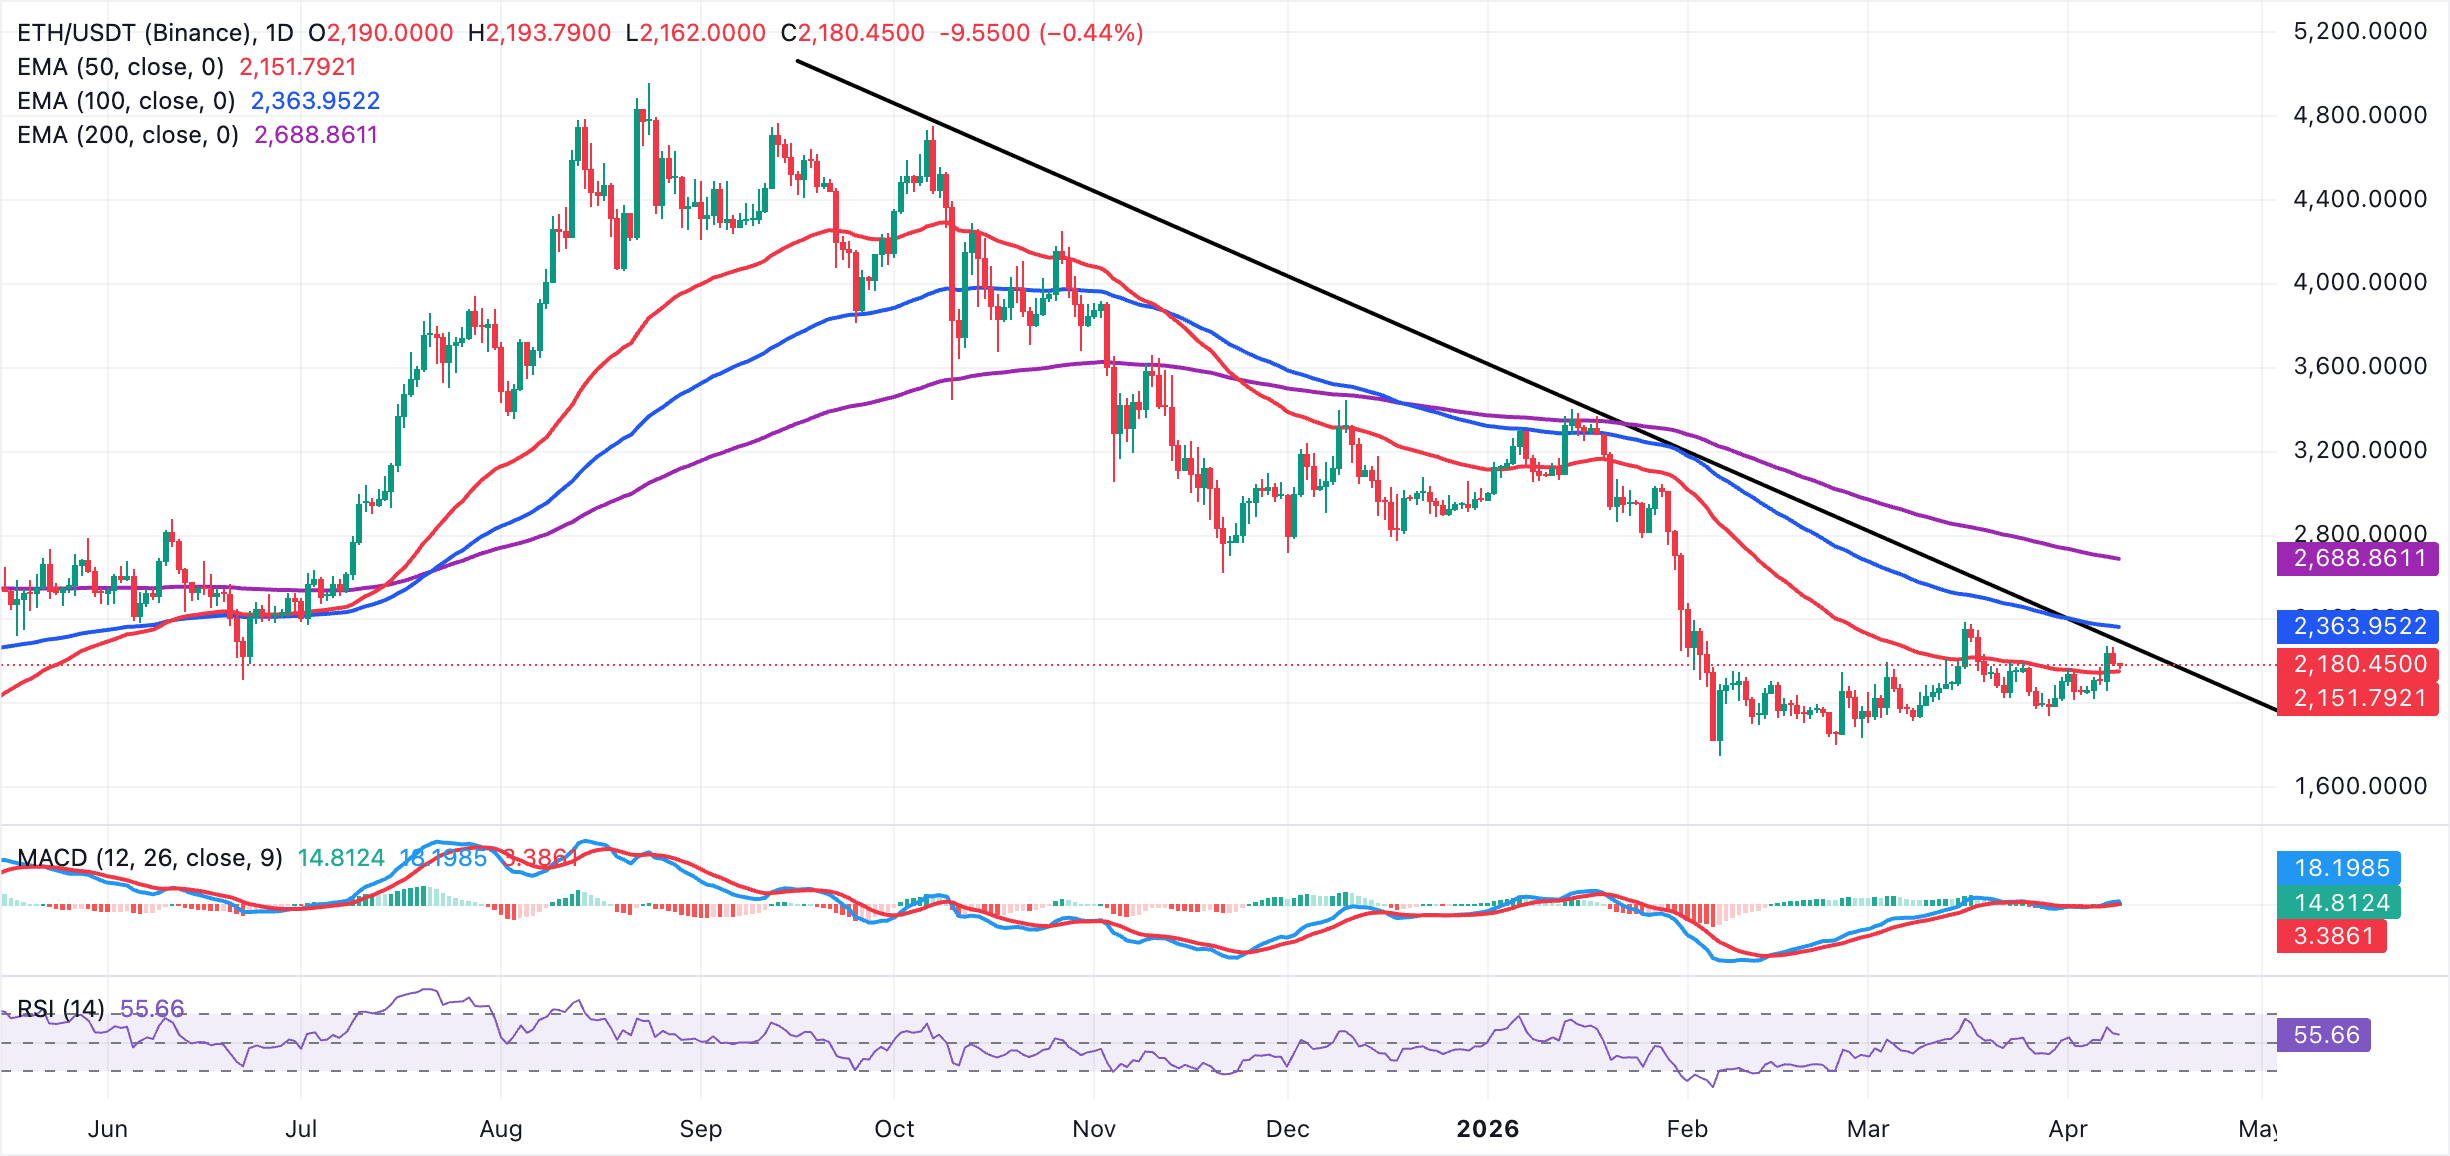
Ethereum's initial resistance is seen at the descending trendline break zone around $2,291. A daily close above this area would open the door toward the 100-day EMA at $2,364, with the 200-day EMA higher up at $2,689 acting as a more distant barrier in case of an extended advance. On the downside, immediate support lies with the 50-day EMA at $2,152, and a clear drop back below this level would undermine the nascent positive tone and expose ETH to deeper consolidation within the broader downtrend.
As for XRP, the price remains largely bearish, entrenched below the major moving averages. The 50-day EMA at $1.42 is the nearest dynamic cap, with the 100-day EMA at $1.58 and the 200-day EMA at $1.83 reinforcing a broader downside structure beneath the long-term descending trendline whose break level sits much higher at $1.76. Meanwhile, the MACD indicator is marginally positive and relatively flat, and the RSI at 44 remains in neutral-to-soft territory. XRP's momentum only hints at tentative stabilization rather than a clear bullish turn.
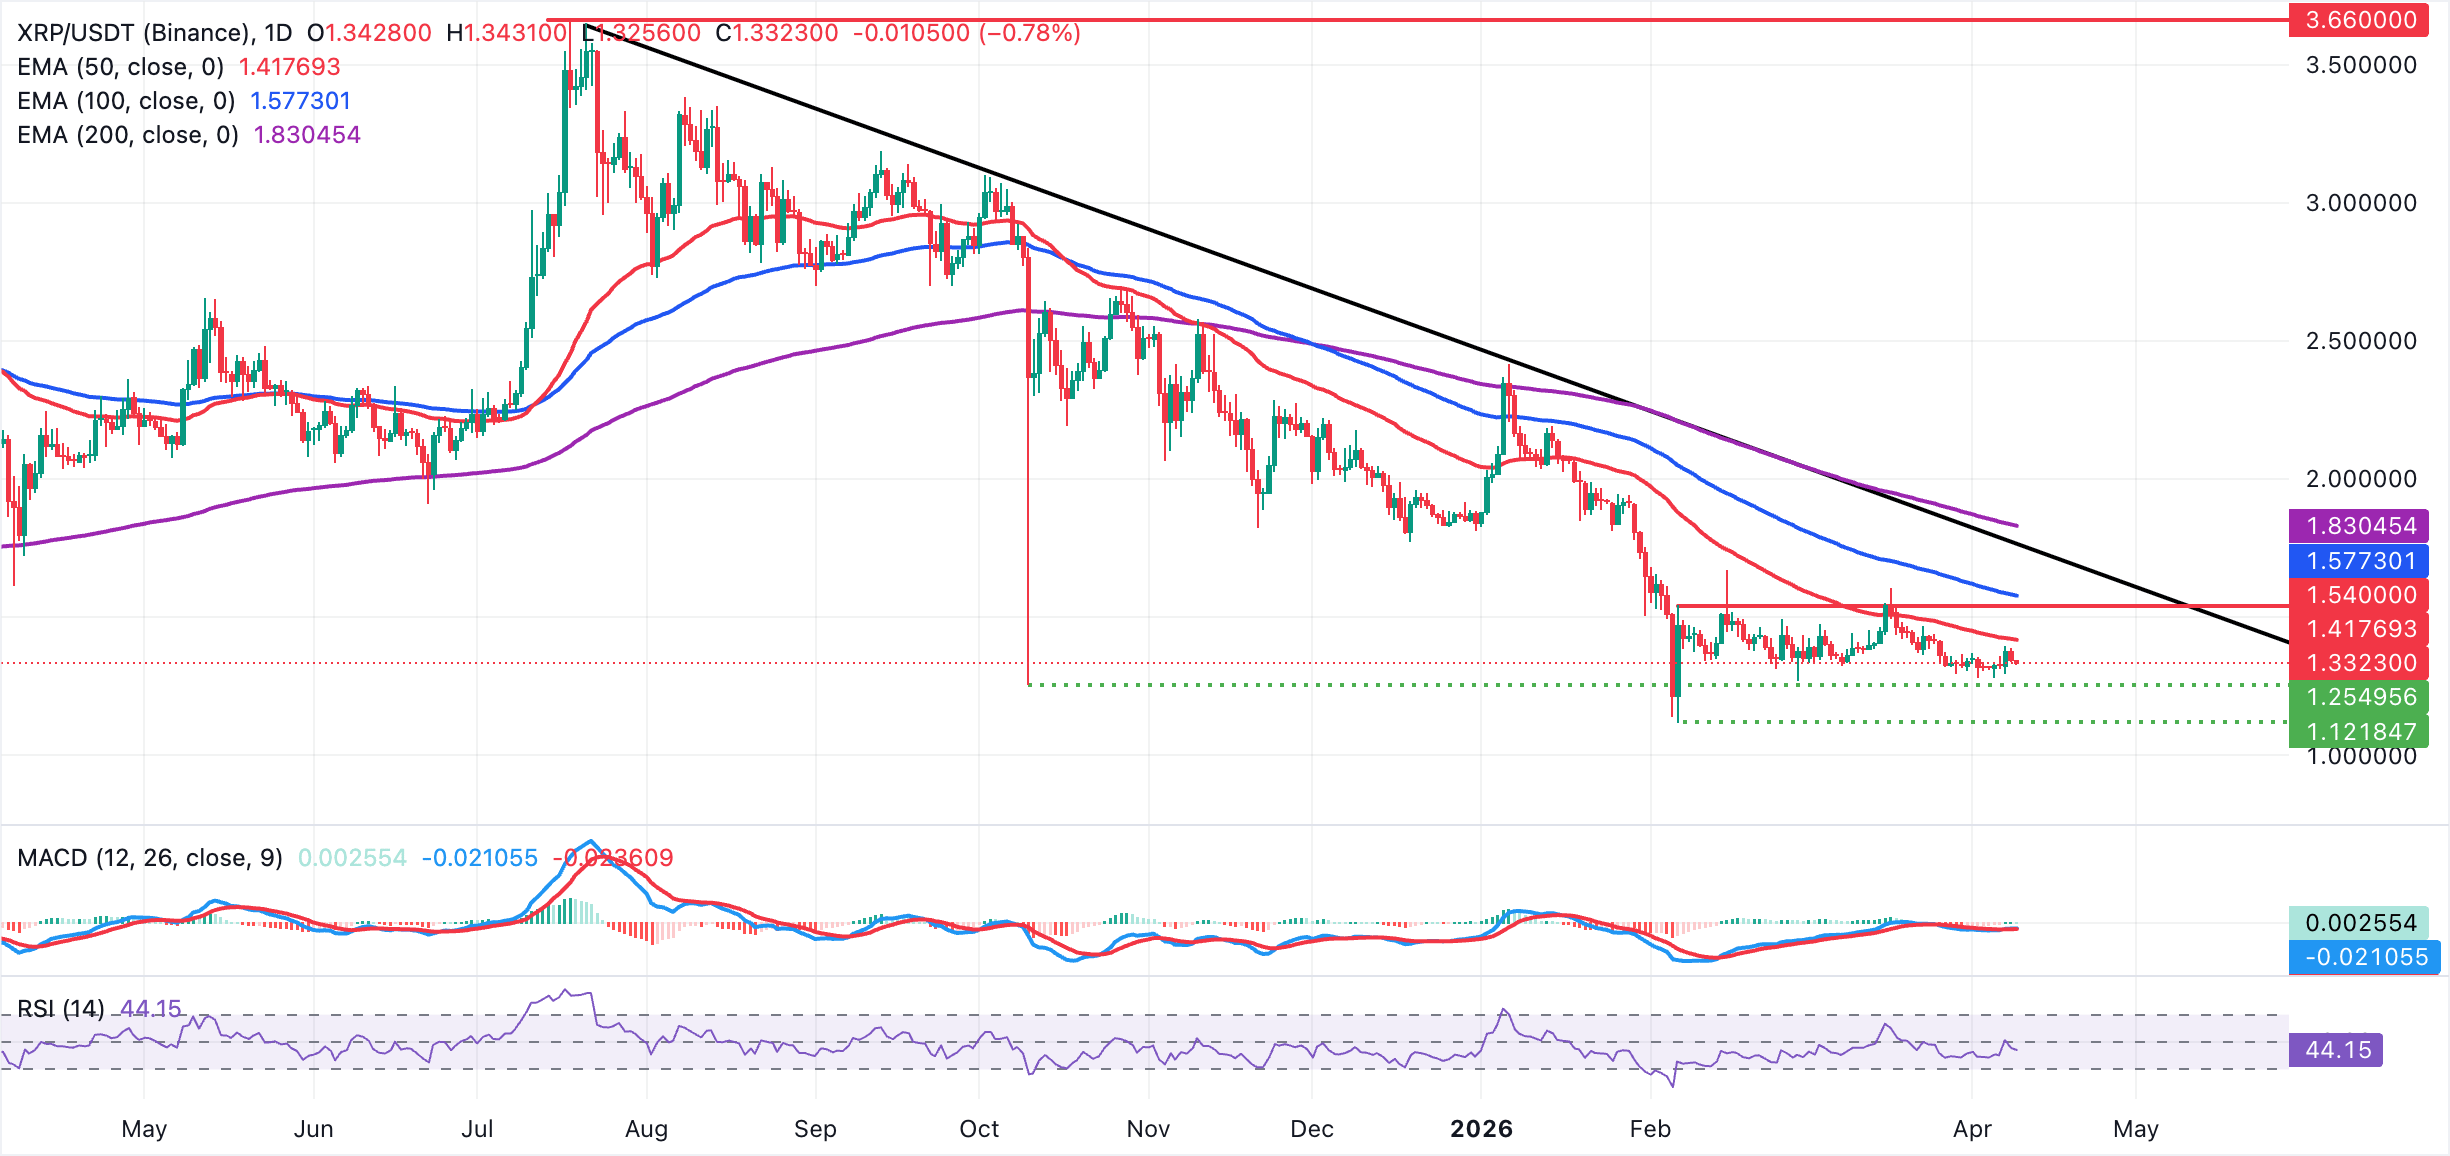
XRP's immediate resistance is at the 50-EMA near $1.42, where a daily close above would ease the current downside pressure and open the way toward the next bullish hurdle at $1.58. Beyond that area, the long-standing downward resistance trendline, with a break price near $1.76, and the 200-EMA at $1.83 form a major confluence zone that would likely cap any extended recovery.
Crypto ETF FAQs
An Exchange-Traded Fund (ETF) is an investment vehicle or an index that tracks the price of an underlying asset. ETFs can not only track a single asset, but a group of assets and sectors. For example, a Bitcoin ETF tracks Bitcoin’s price. ETF is a tool used by investors to gain exposure to a certain asset.
Yes. The first Bitcoin futures ETF in the US was approved by the US Securities & Exchange Commission in October 2021. A total of seven Bitcoin futures ETFs have been approved, with more than 20 still waiting for the regulator’s permission. The SEC says that the cryptocurrency industry is new and subject to manipulation, which is why it has been delaying crypto-related futures ETFs for the last few years.
Yes. The SEC approved in January 2024 the listing and trading of several Bitcoin spot Exchange-Traded Funds, opening the door to institutional capital and mainstream investors to trade the main crypto currency. The decision was hailed by the industry as a game changer.
The main advantage of crypto ETFs is the possibility of gaining exposure to a cryptocurrency without ownership, reducing the risk and cost of holding the asset. Other pros are a lower learning curve and higher security for investors since ETFs take charge of securing the underlying asset holdings. As for the main drawbacks, the main one is that as an investor you can’t have direct ownership of the asset, or, as they say in crypto, “not your keys, not your coins.” Other disadvantages are higher costs associated with holding crypto since ETFs charge fees for active management. Finally, even though investing in ETFs reduces the risk of holding an asset, price swings in the underlying cryptocurrency are likely to be reflected in the investment vehicle too.
(The technical analysis of this story was written with the help of an AI tool.)

Higit sa isang milyong user ang umaasa sa FXStreet para sa real-time market data, charting tools, expert insights, at Forex news. Ang komprehensibong economic calendar at educational webinars nito ay tumutulong sa mga trader na manatiling may alam at gumawa ng kalkuladong mga desisyon. Sinusuportahan ang FXStreet ng humigit-kumulang 60 propesyonal sa pagitan ng Barcelona HQ at iba’t ibang rehiyon sa buong mundo.
Magbasa pa


