
Dow Jones Industrial Average drops 600 points after shock -92K NFP print
Ni Joshua Gibson
Petsa ng Pag-publish: 7 Mar 2026 | Petsa ng Pag-edit: 7 Mar 2026


Sikat na Artikulo

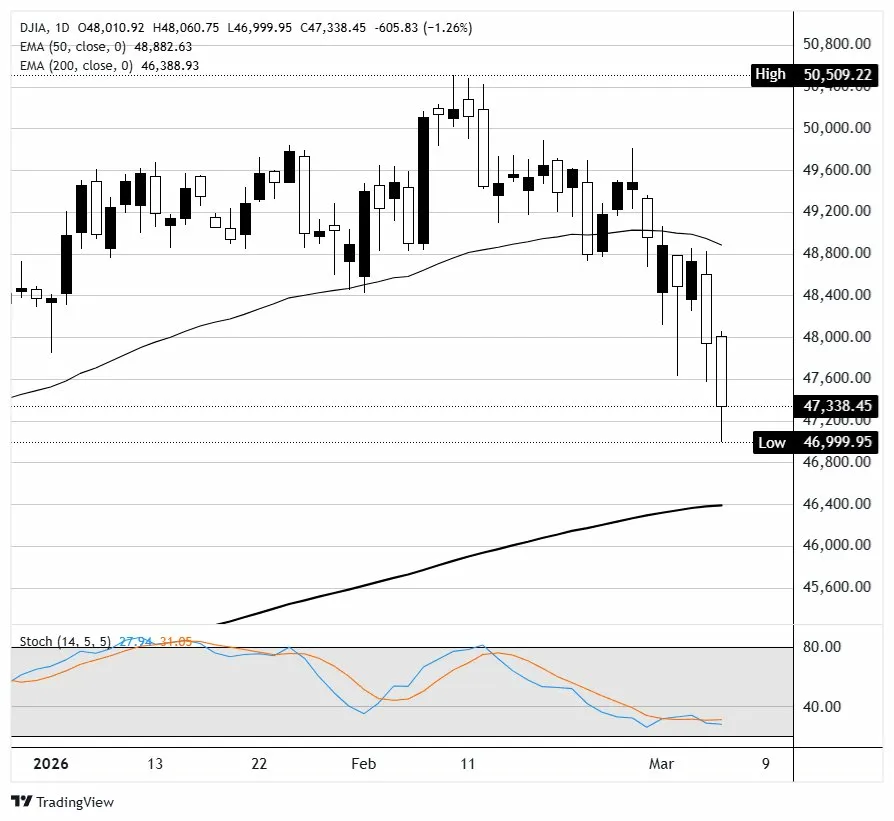
The Dow Jones Industrial Average was down around 600 points, or 1.26%, near 47,340 on Friday at the time of writing, capping off a brutal week that saw the blue-chip index shed over 1K points.
- The Dow fell around 600 points on Friday, extending its weekly loss to over 1K points amid a toxic mix of labor market weakness and surging Oil prices.
- Nonfarm Payrolls came in at -92K for February, massively undershooting the +59K consensus and marking the third negative print in five months.
- The Unemployment Rate ticked up to 4.4% while Average Hourly Earnings ran hot at 0.4% MoM, painting a stagflationary picture.
- Rate cut expectations shifted forward, with traders now pricing the next Federal Reserve cut for July and increasing odds of two cuts before year-end.
The Dow Jones Industrial Average was down around 600 points, or 1.26%, near 47,340 on Friday at the time of writing, capping off a brutal week that saw the blue-chip index shed over 1K points. The S&P 500 traded near 6,750, down around 1.1%, while the Nasdaq Composite hovered near 22,550, off roughly 0.9%. The session's damage was driven by a combination of a historically bad jobs report and escalating Oil prices tied to the US-Iran conflict, with WTI crude breaking above $89 and Brent topping $91.
Payrolls plunge catches Wall Street off guard
February's Nonfarm Payrolls (NFP) print of -92K was a gut punch. The consensus had expected a modest 59K gain after January's downwardly revised 126K, making the miss one of the widest in recent memory — a deviation of more than three standard errors from expectations. To make matters worse, December's figure was revised sharply lower, from 48K down to -17K, meaning the economy actually lost jobs in two of the last three months. The Bureau of Labor Statistics (BLS) attributed much of the February decline to a 28K drop in healthcare employment, largely driven by the Kaiser Permanente strike in California and Hawaii that sidelined over 30K workers. Federal government payrolls continued to shrink, down another 10K, extending a trend that has now seen 330K federal jobs disappear since October 2024. Construction shed 11K after a strong January, manufacturing lost 12K, and transportation and warehousing dropped 11K. Long-term unemployment also rose, with the average duration hitting 25.7 weeks — the longest since December 2021.
Unemployment rate rises, wages stay sticky
The Unemployment Rate edged up to 4.4% from 4.3%, above the consensus expectation of no change. Labor Force Participation also slipped to 62% from 62.1%, suggesting some workers are dropping out of the workforce entirely rather than finding new roles. On the wage side, Average Hourly Earnings came in hotter than expected at 0.4% month-over-month and 3.8% year-over-year, both a tenth above forecast. That's the wrong combination for the Federal Reserve (Fed) — a weakening labor market paired with sticky wage growth feeds directly into the stagflation narrative that has been building since Oil prices started spiking earlier this week. Fed Governor Christopher Waller, speaking earlier Friday morning in what FXStreet Speech Tracker rated as a hawkish 6.6 appearance, had notably left the door open for a rate move depending on the data. Waller has been one of the more dovish voices on the Federal Open Market Committee (FOMC), so his willingness to entertain action underscores how fluid the policy picture has become.
Retail sales offer little relief
January Retail Sales data, also released Friday, did little to improve the mood. The headline came in at -0.2% month-over-month, slightly better than the -0.3% consensus but still a negative read that points to a consumer pulling back after the holiday season. Retail Sales ex-Autos were flat at 0.0%, while the Control Group — which feeds into Gross Domestic Product (GDP) calculations — managed a 0.3% gain, offering a faint silver lining. Taken together with the payrolls data though, the consumer picture is softening. Fewer people working, lower participation, and declining retail activity don't paint a picture of an economy that can sustain elevated interest rates much longer.
Rate expectations shift but Oil complicates everything
Following the NFP release, traders pulled forward expectations for the next Fed rate cut to July and increased the probability of two cuts before year-end, according to CME FedWatch data. The March 18 meeting remains a near-certain hold, with a roughly 96% probability of no change, but the calculus beyond that is shifting quickly. The problem is Oil. With WTI above $89 and Brent above $91, the inflationary impulse from energy prices threatens to offset any dovish pivot the Fed might otherwise make on the back of weak labor data. It's a classic stagflation bind — the economy is weakening, but the cost of energy is rising, and the Fed can't ease aggressively without risking an inflation resurgence. Treasury yields reflected this tension, with the 10-year pushing above 4.17% and the 2s10s spread widening to 57 basis points.
Financials and industrials lead the selloff
Goldman Sachs (GS) dropped around 3.4%, American Express (AXP) fell 3.2%, and JPMorgan (JPM) slid roughly 3%, making financials the worst-performing group in the Dow for a second straight session. Caterpillar (CAT) continued its slide, down around 2.8%, as the weakening jobs picture and slowing global growth weighed on industrial names. Asset managers had a particularly rough day, with Blue Owl (OWL) dropping 6% amid concerns over private credit exposure, while BlackRock (BLK) and Blackstone (BX) each fell around 4%. On the other end, energy was the only sector in the green — Exxon Mobil (XOM) and Chevron (CVX) each gained more than 1%, while Occidental Petroleum (OXY) climbed 3.3% on the back of surging crude. Gold caught a bid as well, trading above $5,150 as the risk-off mood and rate cut repricing supported haven demand. The VIX spiked nearly 10% to above 26, reflecting the elevated anxiety heading into the weekend.
Dow Jones daily chart
Dow Jones FAQs
The Dow Jones Industrial Average, one of the oldest stock market indices in the world, is compiled of the 30 most traded stocks in the US. The index is price-weighted rather than weighted by capitalization. It is calculated by summing the prices of the constituent stocks and dividing them by a factor, currently 0.152. The index was founded by Charles Dow, who also founded the Wall Street Journal. In later years it has been criticized for not being broadly representative enough because it only tracks 30 conglomerates, unlike broader indices such as the S&P 500.
Many different factors drive the Dow Jones Industrial Average (DJIA). The aggregate performance of the component companies revealed in quarterly company earnings reports is the main one. US and global macroeconomic data also contributes as it impacts on investor sentiment. The level of interest rates, set by the Federal Reserve (Fed), also influences the DJIA as it affects the cost of credit, on which many corporations are heavily reliant. Therefore, inflation can be a major driver as well as other metrics which impact the Fed decisions.
Dow Theory is a method for identifying the primary trend of the stock market developed by Charles Dow. A key step is to compare the direction of the Dow Jones Industrial Average (DJIA) and the Dow Jones Transportation Average (DJTA) and only follow trends where both are moving in the same direction. Volume is a confirmatory criteria. The theory uses elements of peak and trough analysis. Dow’s theory posits three trend phases: accumulation, when smart money starts buying or selling; public participation, when the wider public joins in; and distribution, when the smart money exits.
There are a number of ways to trade the DJIA. One is to use ETFs which allow investors to trade the DJIA as a single security, rather than having to buy shares in all 30 constituent companies. A leading example is the SPDR Dow Jones Industrial Average ETF (DIA). DJIA futures contracts enable traders to speculate on the future value of the index and Options provide the right, but not the obligation, to buy or sell the index at a predetermined price in the future. Mutual funds enable investors to buy a share of a diversified portfolio of DJIA stocks thus providing exposure to the overall index.

Higit sa isang milyong user ang umaasa sa FXStreet para sa real-time market data, charting tools, expert insights, at Forex news. Ang komprehensibong economic calendar at educational webinars nito ay tumutulong sa mga trader na manatiling may alam at gumawa ng kalkuladong mga desisyon. Sinusuportahan ang FXStreet ng humigit-kumulang 60 propesyonal sa pagitan ng Barcelona HQ at iba’t ibang rehiyon sa buong mundo.
Magbasa pa


