
Dow Jones Industrial Average futures rebound above 50,000
Ni Joshua Gibson
Na-update: 14 May 2026


Sikat na Artikulo

Dow Jones Industrial Average (DJIA) futures traded above 50,000 in the overnight and premarket sessions on Thursday, more than reversing the modest pullback in the cash index on Wednesday.
- DJIA futures pushed back above 50,000 in the overnight and premarket sessions on Thursday, recouping Wednesday's modest cash-index loss.
- April Retail Sales matched expectations at 0.5%, while the Control Group reading beat at 0.5% versus 0.4% consensus.
- Initial Jobless Claims climbed to 211K, above the 205K consensus and the prior week's 199K print.
Dow Jones Industrial Average (DJIA) futures traded above 50,000 in the overnight and premarket sessions on Thursday, more than reversing the modest pullback in the cash index on Wednesday. The recovery came as traders digested a mixed batch of US data and looked ahead to a packed lineup of Fed speakers, with the S&P 500 and Nasdaq Composite both sitting on record closes from Wednesday's session.
Overnight tone steadies after Wednesday's PPI shock
DJIA futures opened the overnight session on a constructive footing despite Wednesday's mild cash close, where the index slipped around 0.1% as financials and home improvement names dragged. The Asian and European sessions traded with a narrow upside bias, helped by a softer US Dollar and a small pullback in crude prices into Thursday morning. Treasury yields, which had pushed to fresh 2026 highs after Wednesday's hot Producer Price Index (PPI) print, stabilized just below the recent peaks. Headline PPI surged 1.4% MoM in April and 6% YoY, the steepest annual increase since December 2022, layering onto Tuesday's Consumer Price Index (CPI) reading of 3.8% YoY, the hottest since May 2023.
Retail sales hold up as consumer absorbs higher gas prices
April Retail Sales matched expectations at 0.5% MoM, marking a third straight monthly gain, though the headline slowed sharply from the upwardly revised 1.6% in March. The Retail Sales Control Group, which feeds directly into Gross Domestic Product (GDP) calculations, rose 0.5% versus 0.4% consensus. Retail Sales ex-Autos beat at 0.7% against 0.6% expected. The print carried its usual asterisk that nominal sales reflect higher prices rather than higher volumes, with gasoline station receipts again a meaningful contributor to the increase. On a YoY basis, headline sales rose 4.9%, suggesting the US consumer is still spending through the inflation pipeline driven by the ongoing US-Iran conflict.
Jobless claims tick up but labor market signals remain tight
Initial Jobless Claims rose to 211K for the week ending May 9, above the 205K consensus and the prior week's 199K (revised from 200K). Continuing Jobless Claims edged up 24K to 1.782 million, while the four-week moving average climbed only marginally to 203.75K. Despite the uptick, claims remain well below year-ago averages and consistent with a tight labor market by historical standards. The reading does not materially shift the Fed calculus, especially against the backdrop of accelerating price pressures earlier in the week.
Fed speaker slate in focus as 2026 cut bets evaporate
The data tape gives way to a string of Federal Reserve (Fed) appearances with the potential to extend the recent move higher in Treasury yields. Kansas City Fed President Jeff Schmid is scheduled at 14:15 GMT and carries a clear hawkish bias, having dissented at the December meeting in favor of holding rates rather than cutting. Cleveland Fed President Beth Hammack follows at 17:00 GMT, with New York Fed President John Williams at 21:45 GMT and Vice Chair for Supervision Michael Barr at 23:00 GMT. Per the CME FedWatch tool, markets now price essentially zero probability of a rate cut at the June 17 Federal Open Market Committee (FOMC) meeting and through year-end, a sharp reversal from earlier in 2026. Bank of America and JPMorgan have pushed first-cut forecasts into 2027.
Setup for Friday and the Warsh handover
Friday's data slate includes the New York Empire State Manufacturing Index (consensus 7.5 versus 11 prior) and Industrial Production (consensus 0.3% MoM versus a revised -0.5% prior reading). Neither is typically a major market mover, but both are worth tracking given the manufacturing complex's sensitivity to higher input costs from the energy spike. The bigger calendar item is the formal Fed handover, with Kevin Warsh set to take over as Chair from Jerome Powell on Friday. Warsh's hawkish lean on inflation, the unresolved US-Iran conflict that continues to keep crude near three-figure levels, and the hot CPI and PPI prints earlier this week leave the path of least resistance for yields skewed higher. The bar for any DJIA futures breakout above the 50,000 area runs through the tone Schmid sets later in the session.
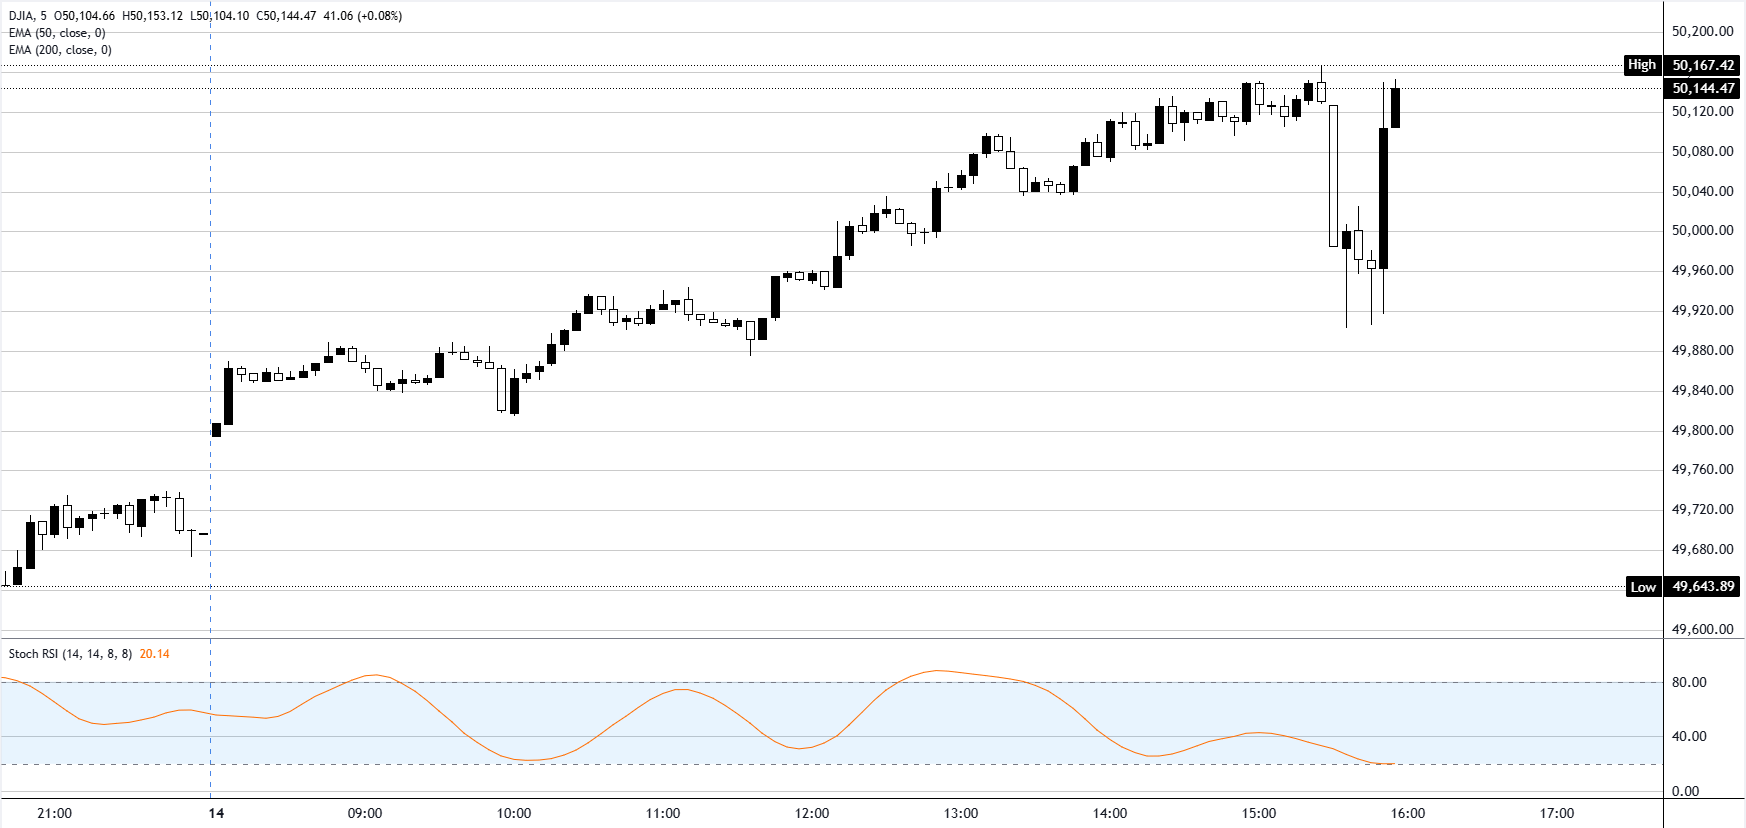
Dow Jones 5-minute chart
Dow Jones FAQs
The Dow Jones Industrial Average, one of the oldest stock market indices in the world, is compiled of the 30 most traded stocks in the US. The index is price-weighted rather than weighted by capitalization. It is calculated by summing the prices of the constituent stocks and dividing them by a factor, currently 0.152. The index was founded by Charles Dow, who also founded the Wall Street Journal. In later years it has been criticized for not being broadly representative enough because it only tracks 30 conglomerates, unlike broader indices such as the S&P 500.
Many different factors drive the Dow Jones Industrial Average (DJIA). The aggregate performance of the component companies revealed in quarterly company earnings reports is the main one. US and global macroeconomic data also contributes as it impacts on investor sentiment. The level of interest rates, set by the Federal Reserve (Fed), also influences the DJIA as it affects the cost of credit, on which many corporations are heavily reliant. Therefore, inflation can be a major driver as well as other metrics which impact the Fed decisions.
Dow Theory is a method for identifying the primary trend of the stock market developed by Charles Dow. A key step is to compare the direction of the Dow Jones Industrial Average (DJIA) and the Dow Jones Transportation Average (DJTA) and only follow trends where both are moving in the same direction. Volume is a confirmatory criteria. The theory uses elements of peak and trough analysis. Dow’s theory posits three trend phases: accumulation, when smart money starts buying or selling; public participation, when the wider public joins in; and distribution, when the smart money exits.
There are a number of ways to trade the DJIA. One is to use ETFs which allow investors to trade the DJIA as a single security, rather than having to buy shares in all 30 constituent companies. A leading example is the SPDR Dow Jones Industrial Average ETF (DIA). DJIA futures contracts enable traders to speculate on the future value of the index and Options provide the right, but not the obligation, to buy or sell the index at a predetermined price in the future. Mutual funds enable investors to buy a share of a diversified portfolio of DJIA stocks thus providing exposure to the overall index.

Higit sa isang milyong user ang umaasa sa FXStreet para sa real-time market data, charting tools, expert insights, at Forex news. Ang komprehensibong economic calendar at educational webinars nito ay tumutulong sa mga trader na manatiling may alam at gumawa ng kalkuladong mga desisyon. Sinusuportahan ang FXStreet ng humigit-kumulang 60 propesyonal sa pagitan ng Barcelona HQ at iba’t ibang rehiyon sa buong mundo.
Magbasa pa


