
Dow Jones Industrial Average plunges as Iran war fears rattle Wall Street
Ni Joshua Gibson
Petsa ng Pag-publish: 4 Mar 2026 | Petsa ng Pag-edit: 4 Mar 2026


Sikat na Artikulo

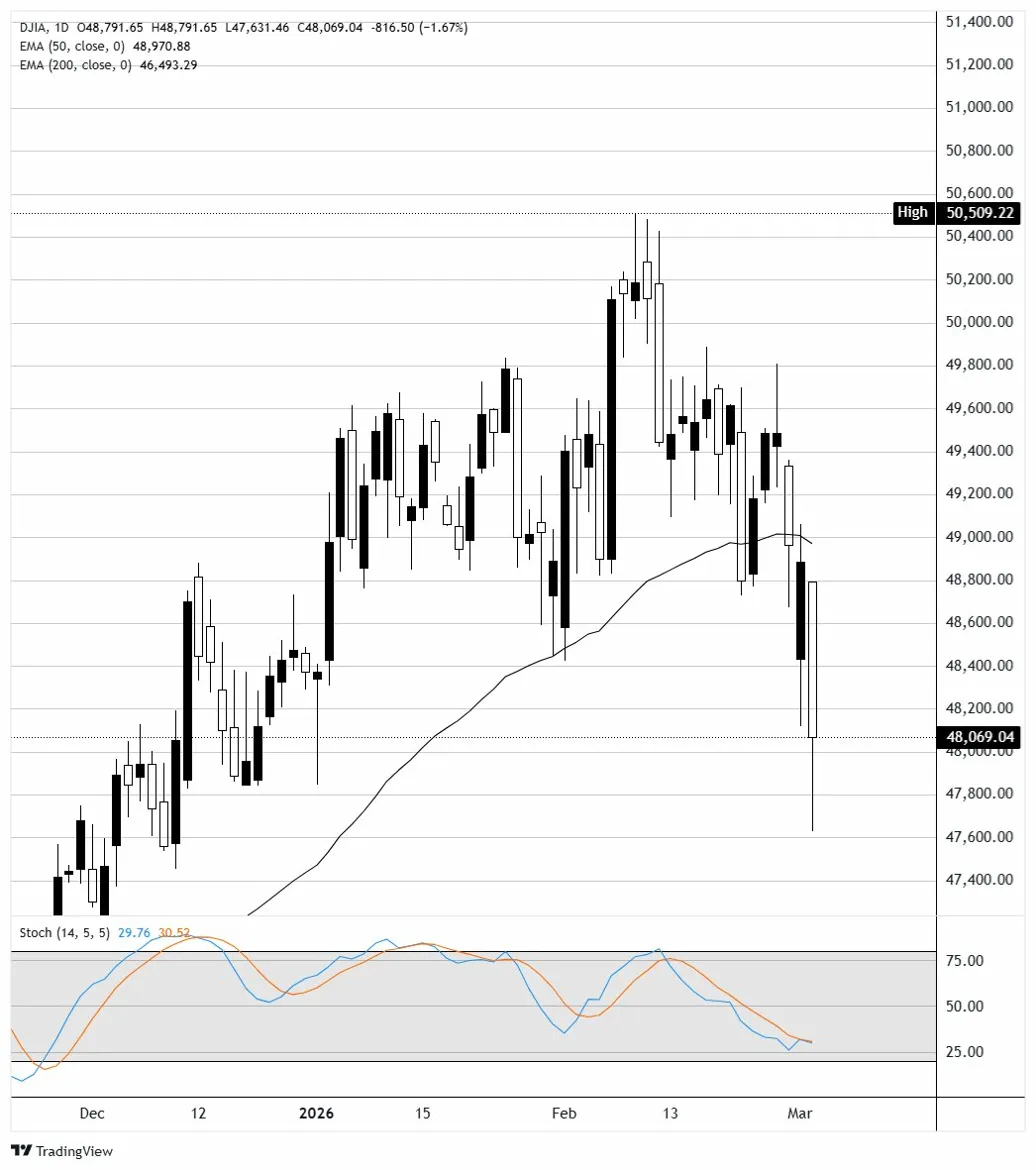
The Dow Jones Industrial Average (DJIA) dropped around 850 points, or 1.7%, to trade near 48,000 at midday Tuesday as escalating conflict in the Middle East sent shockwaves through global markets. The S&P 500 fell 1.62% to 6,770, while the Nasdaq Composite shed 1.72% to 22,357.
- All four major US indexes fell sharply as the Iran conflict entered its fourth day, with the Russell 2000 leading losses at -2.55%.
- Crude Oil surged above $76 per barrel on Strait of Hormuz closure fears, driving energy stocks higher while crushing airlines and travel names.
- Target and Best Buy both topped earnings per share estimates, but gains were muted by the broader risk-off selloff.
- Rate cut expectations shifted lower as rising energy costs reignited inflation concerns, with traders now pricing fewer Federal Reserve cuts in 2026.
The Dow Jones Industrial Average (DJIA) dropped around 850 points, or 1.7%, to trade near 48,000 at midday Tuesday as escalating conflict in the Middle East sent shockwaves through global markets. The S&P 500 fell 1.62% to 6,770, while the Nasdaq Composite shed 1.72% to 22,357. The Russell 2000 bore the brunt of the selling, tumbling 2.55% to 2,588. Tuesday's session marked a sharp reversal from Monday's late-day recovery, which had seen US equities claw back earlier losses to finish roughly flat. Overnight reports of drone strikes on the US Embassy in Riyadh and Iran's reported closure of the Strait of Hormuz dramatically ratcheted up anxiety, with the CBOE Volatility Index (VIX) surging above 25.
Iran conflict sends Oil surging, Strait of Hormuz fears intensify
West Texas Intermediate (WTI) crude jumped roughly 7% on Tuesday to trade above $76 per barrel, extending Monday's 8.4% surge that had already pushed prices to their highest since June. Brent crude rose to around $84 per barrel. The escalation followed reports that Iran's Revolutionary Guard declared the Strait of Hormuz closed and would fire on any ship attempting to pass. Roughly a third of the world's seaborne crude exports flow through the strait, and analysts warned that a prolonged disruption could push Brent above $100. Exxon Mobil (XOM) continued to climb after rallying more than 5% on Monday to an intraday record, while ConocoPhillips (COP) and Chevron (CVX) extended their multi-day gains. Defense contractors also benefited from the conflict, with Lockheed Martin (LMT), RTX Corporation (RTX), and Northrop Grumman (NOC) all posting solid gains. Palantir Technologies (PLTR) was upgraded to buy at Rosenblatt, which raised its price target to $200, citing the company's defense and AI capabilities.
Rising energy costs cloud the Federal Reserve rate cut outlook
The oil-driven inflation scare sent US Treasury yields sharply higher, with the 10-year yield climbing toward 4.10% after briefly dipping below 4.00% on Sunday. The move marked the biggest two-day advance in yields since April. According to the CME FedWatch tool, markets are pricing in a 94% probability that the Federal Reserve (Fed) will hold rates steady at 3.50%-3.75% at its March 18-19 meeting, with traders now betting on fewer total cuts in 2026. Bloomberg reported that traders are now pricing in reduced chances of two Fed rate cuts this year, as surging energy prices threaten to keep inflation elevated longer than anticipated. New York Fed President Williams said Tuesday that the tariff burden falls overwhelmingly on US businesses and consumers, adding another layer of uncertainty to the inflation picture. Friday's Nonfarm Payrolls (NFP) report will be the next critical data point for rate expectations.
Airlines and travel stocks hammered by conflict fallout
Travel-related names were among the hardest hit on Tuesday as the war disrupted global tourism and sent fuel costs soaring. United Airlines Holdings (UAL), the most internationally exposed US carrier, extended Monday's 6% decline. American Airlines Group (AAL) and Delta Air Lines (DAL) both fell sharply again after dropping more than 5% on Monday. Cruise operators continued their slide, with Carnival Corporation (CCL) pacing for its worst two-day stretch since the pandemic after plunging nearly 12% on Monday. Royal Caribbean Group (RCL) and Norwegian Cruise Line Holdings (NCLH) also remained under heavy pressure. Hotel chains Marriott International (MAR) and Hilton Worldwide Holdings (HLT) continued to bleed lower, while online platforms Booking Holdings (BKNG) and Expedia Group (EXPE) fell further.
Retail earnings beat expectations but gains capped by selloff
Target (TGT) reported fourth-quarter adjusted earnings per share (EPS) of $2.44, comfortably beating the $2.16 consensus estimate. Revenue of $30.45 billion came in just below expectations. Despite a 2.5% decline in comparable sales, CEO Michael Fiddelke struck an optimistic tone, noting that sales turned positive year over year in February. Target guided full-year EPS of $7.50-$8.50, with the midpoint above analyst expectations, and projected a 2% sales increase. Shares rose roughly 3% premarket but gains were tempered by the broader selloff. Best Buy (BBY) also beat on the bottom line, posting adjusted EPS of $2.61 versus the $2.47 estimate. Revenue of $13.81 billion narrowly missed consensus. Comparable sales declined 0.8%, reflecting soft demand in home theater and appliances, though computing and mobile phones showed strength. Best Buy raised its dividend by 1% and guided FY27 revenue of $41.2-$42.1 billion. Shares surged as much as 9% premarket before the broader market weakness weighed on the move.
Gold, US Dollar and haven assets in focus
Gold futures opened Tuesday at $5,205 per ounce, pulling back roughly 2% from Monday's close of $5,312 after an explosive rally driven by safe-haven demand. Spot Gold had briefly touched $5,400 on Monday, its highest level in a month, before the stronger US Dollar began to cap gains. The US Dollar Index climbed nearly 1.7% over five days, erasing its year-to-date losses and hitting a five-week high as investors sought safety. Silver also saw volatile swings, bouncing nearly 2% in Asian trading after a 6% plunge on Monday. Meanwhile, the momentum trades that had defined early 2026 came under pressure, with Lithium, Uranium, and memory semiconductor stocks all falling sharply. The Global X Lithium & Battery Tech ETF (LIT) dropped 10%, while Uranium miners shed double digits. Semiconductor equipment names like Applied Materials (AMAT), Lam Research (LRCX), KLA Corporation (KLAC), and ASML Holding (ASML) all fell more than 6%.
Dow Jones daily chart
Dow Jones FAQs
The Dow Jones Industrial Average, one of the oldest stock market indices in the world, is compiled of the 30 most traded stocks in the US. The index is price-weighted rather than weighted by capitalization. It is calculated by summing the prices of the constituent stocks and dividing them by a factor, currently 0.152. The index was founded by Charles Dow, who also founded the Wall Street Journal. In later years it has been criticized for not being broadly representative enough because it only tracks 30 conglomerates, unlike broader indices such as the S&P 500.
Many different factors drive the Dow Jones Industrial Average (DJIA). The aggregate performance of the component companies revealed in quarterly company earnings reports is the main one. US and global macroeconomic data also contributes as it impacts on investor sentiment. The level of interest rates, set by the Federal Reserve (Fed), also influences the DJIA as it affects the cost of credit, on which many corporations are heavily reliant. Therefore, inflation can be a major driver as well as other metrics which impact the Fed decisions.
Dow Theory is a method for identifying the primary trend of the stock market developed by Charles Dow. A key step is to compare the direction of the Dow Jones Industrial Average (DJIA) and the Dow Jones Transportation Average (DJTA) and only follow trends where both are moving in the same direction. Volume is a confirmatory criteria. The theory uses elements of peak and trough analysis. Dow’s theory posits three trend phases: accumulation, when smart money starts buying or selling; public participation, when the wider public joins in; and distribution, when the smart money exits.
There are a number of ways to trade the DJIA. One is to use ETFs which allow investors to trade the DJIA as a single security, rather than having to buy shares in all 30 constituent companies. A leading example is the SPDR Dow Jones Industrial Average ETF (DIA). DJIA futures contracts enable traders to speculate on the future value of the index and Options provide the right, but not the obligation, to buy or sell the index at a predetermined price in the future. Mutual funds enable investors to buy a share of a diversified portfolio of DJIA stocks thus providing exposure to the overall index.

Higit sa isang milyong user ang umaasa sa FXStreet para sa real-time market data, charting tools, expert insights, at Forex news. Ang komprehensibong economic calendar at educational webinars nito ay tumutulong sa mga trader na manatiling may alam at gumawa ng kalkuladong mga desisyon. Sinusuportahan ang FXStreet ng humigit-kumulang 60 propesyonal sa pagitan ng Barcelona HQ at iba’t ibang rehiyon sa buong mundo.
Magbasa pa


