
EUR/USD Price Forecast: Ends week near 1.1400, down below the 200-DMA
Ni Christian Borjon Valencia
Petsa ng Pag-publish: 13 Mar 2026 | Petsa ng Pag-edit: 13 Mar 2026


Sikat na Artikulo

The Euro finalized the week posting losses of over 1.74% against the Greenback and 0.84% in the day. The EUR/USD posted four bearish days after falling below the 200-day Simple Moving Average (SMA) at 1.1672, turning the pair bearishly biased. At the time of writing, the pair trades at 1.1414.
- EUR/USD drops 1.74% on the week, trading near 1.1414 after slipping below the 200-day SMA.
- Break under 1.1400 exposes 1.1300 and the 100-week SMA at 1.1165.
- Momentum remains bearish as RSI holds below the 50-neutral level.
The Euro finalized the week posting losses of over 1.74% against the Greenback and 0.84% in the day. The EUR/USD posted four bearish days after falling below the 200-day Simple Moving Average (SMA) at 1.1672, turning the pair bearishly biased. At the time of writing, the pair trades at 1.1414.
EUR/USD Price Forecast: Technical Outlook
Weekly analysis
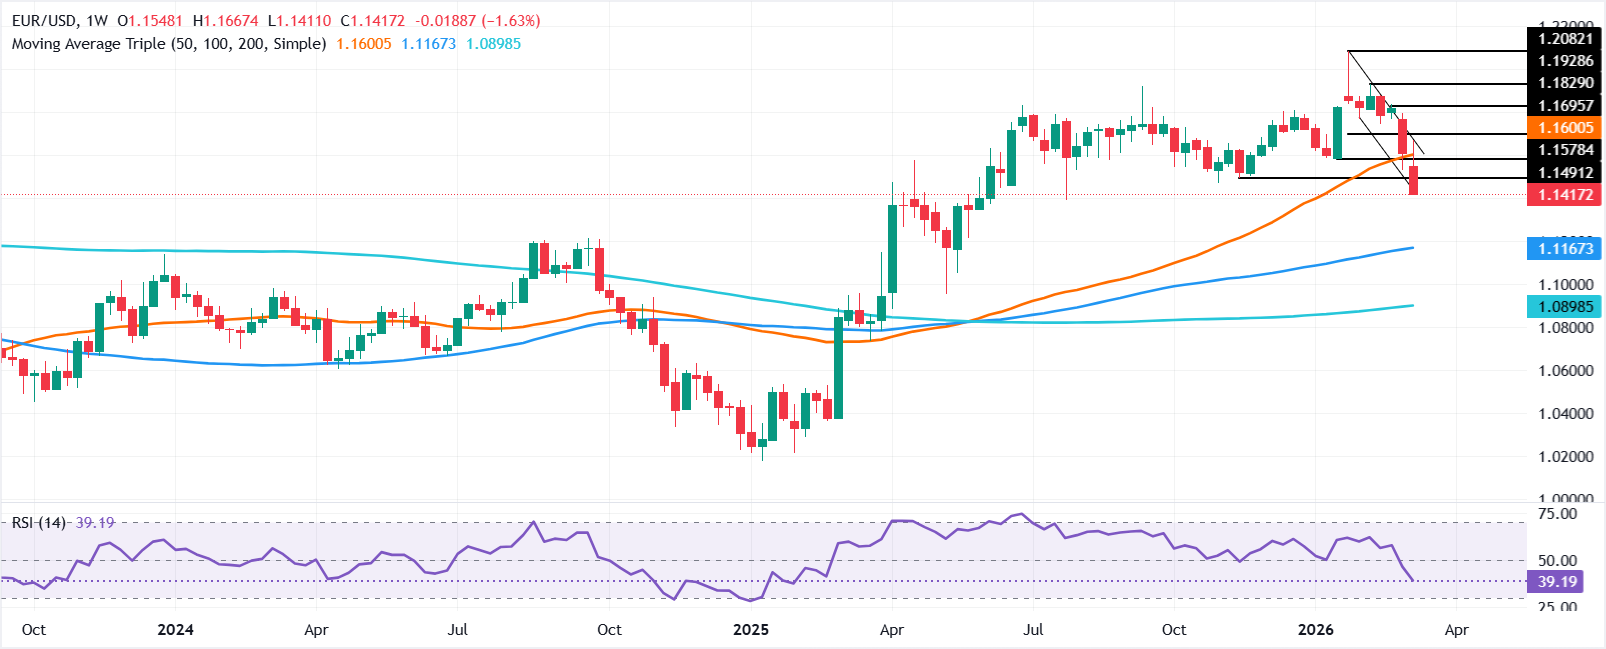
The EUR/USD weekly chart shows the pair is dipping below 1.1450, opening the door to further downside. Momentum is bearish as the Relative Strength Index (RSI) turned negative three weeks ago, after falling below the 50-neutral level.
Hence, the most likely scenario for EUR/USD is to extend its losses. The first key support level would be 1.1400, followed by 1.1300. A breach of those levels will expose the next major support area, the 100-week SMA at 1.1165.
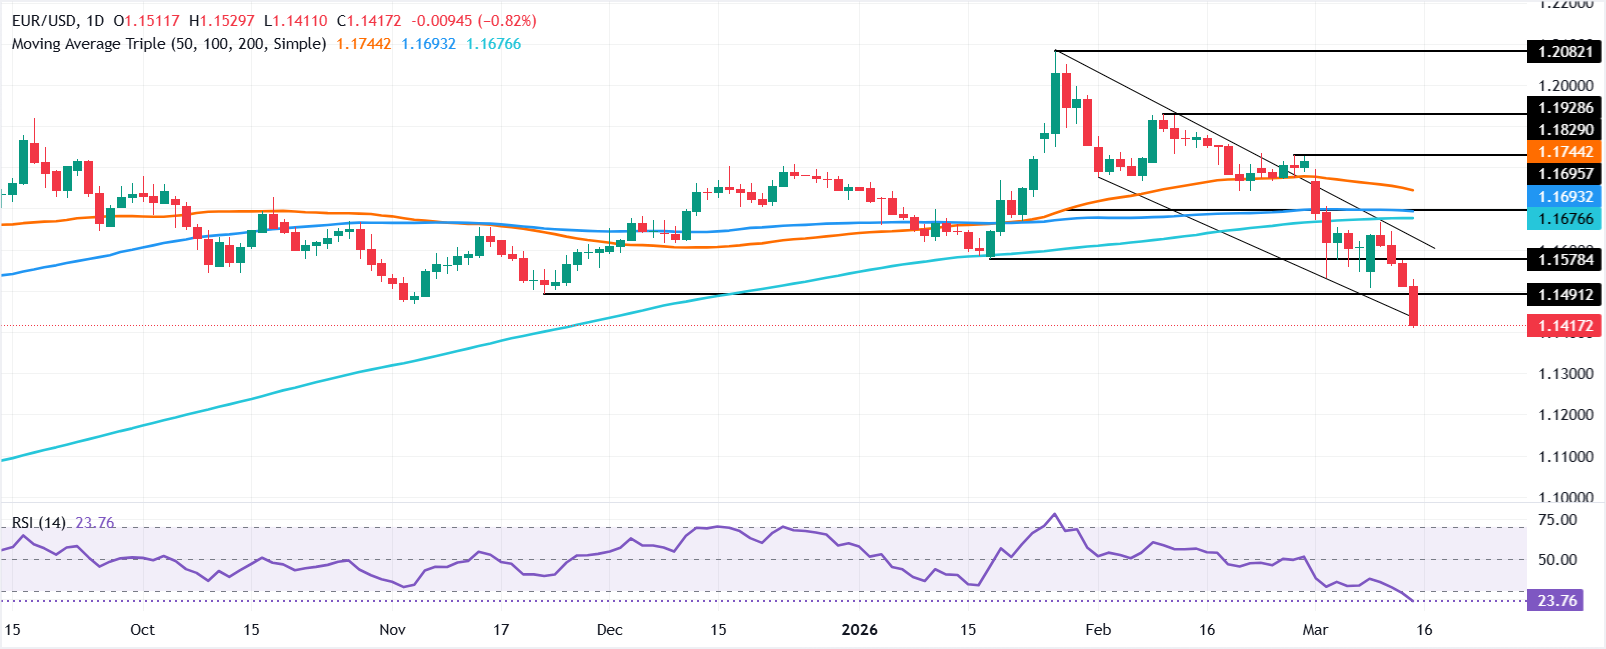
Daily analysis
The EUR/USD daily chart shows a similar picture, though the first key support level will be the August 1, 2025, swing low at 1.1391. If breached, it opens the door to further downside, with the May 29, 2025, daily low at 1.1210. On further weakness, the next area of interest would be the May 12, 2025, bottom at 1.1065.
Euro Price This week
The table below shows the percentage change of Euro (EUR) against listed major currencies this week. Euro was the strongest against the New Zealand Dollar.
| USD | EUR | GBP | JPY | CAD | AUD | NZD | CHF | |
|---|---|---|---|---|---|---|---|---|
| USD | 1.15% | 0.89% | 1.04% | 0.86% | 0.05% | 1.68% | 1.51% | |
| EUR | -1.15% | -0.36% | -0.11% | -0.32% | -1.12% | 0.37% | 0.34% | |
| GBP | -0.89% | 0.36% | 0.19% | 0.05% | -0.76% | 0.77% | 0.66% | |
| JPY | -1.04% | 0.11% | -0.19% | -0.19% | -0.97% | 0.48% | 0.48% | |
| CAD | -0.86% | 0.32% | -0.05% | 0.19% | -0.82% | 0.73% | 0.61% | |
| AUD | -0.05% | 1.12% | 0.76% | 0.97% | 0.82% | 1.54% | 1.35% | |
| NZD | -1.68% | -0.37% | -0.77% | -0.48% | -0.73% | -1.54% | -0.11% | |
| CHF | -1.51% | -0.34% | -0.66% | -0.48% | -0.61% | -1.35% | 0.11% |
The heat map shows percentage changes of major currencies against each other. The base currency is picked from the left column, while the quote currency is picked from the top row. For example, if you pick the Euro from the left column and move along the horizontal line to the US Dollar, the percentage change displayed in the box will represent EUR (base)/USD (quote).

Higit sa isang milyong user ang umaasa sa FXStreet para sa real-time market data, charting tools, expert insights, at Forex news. Ang komprehensibong economic calendar at educational webinars nito ay tumutulong sa mga trader na manatiling may alam at gumawa ng kalkuladong mga desisyon. Sinusuportahan ang FXStreet ng humigit-kumulang 60 propesyonal sa pagitan ng Barcelona HQ at iba’t ibang rehiyon sa buong mundo.
Magbasa pa


