
EUR/USD Price Forecast: Hovers around nine-day EMA above 1.1800
Ni Akhtar Faruqui
Petsa ng Pag-publish: 9 Feb 2026 | Petsa ng Pag-edit: 9 Feb 2026


Sikat na Artikulo

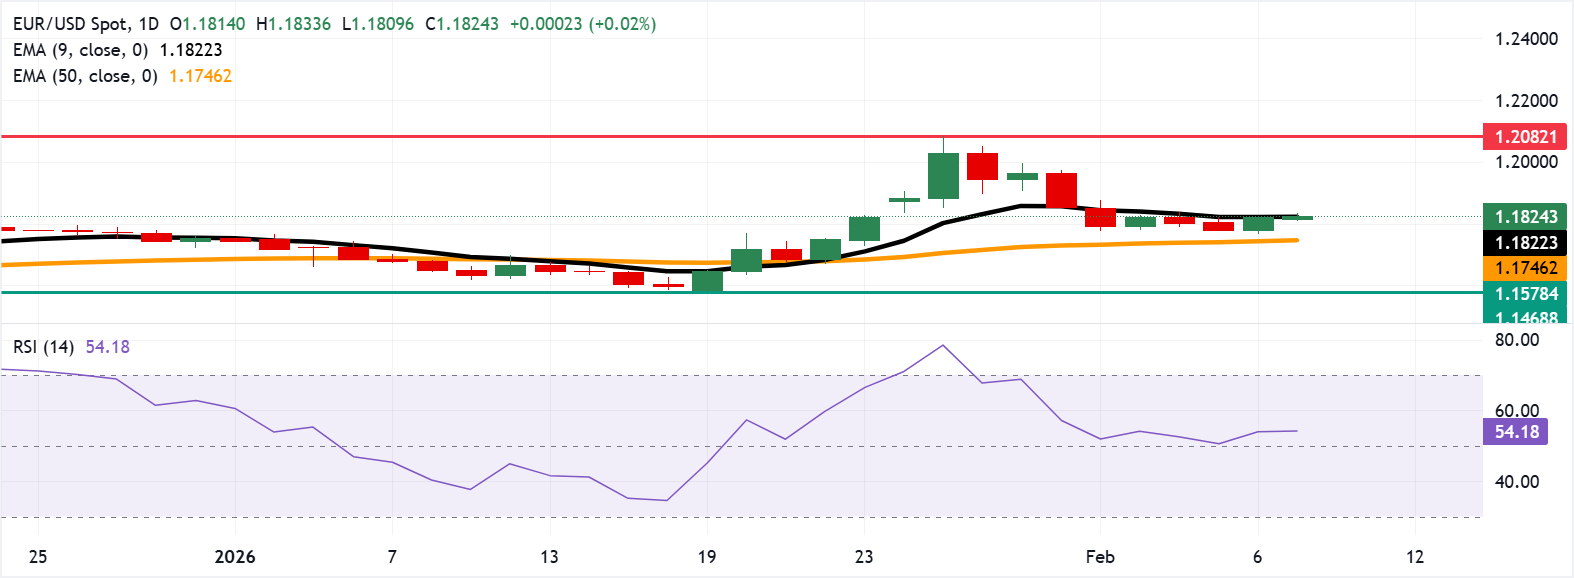
EUR/USD remains in the positive territory after registering modest gains in the previous session, trading around 1.1820 during the Asian hours on Monday. The 14-day Relative Strength Index (RSI) momentum indicator at 54 (neutral) is edging higher, signaling improving momentum.
- EUR/USD trades near a flattening nine-day EMA, while a rising 50-day EMA supports a mild bullish bias.
- The 14-day Relative Strength Index at 54 rises from neutral levels, signaling improving bullish momentum.
- A break below the nine-day EMA at 1.1822 could expose the 50-day EMA near 1.1746.
EUR/USD remains in the positive territory after registering modest gains in the previous session, trading around 1.1820 during the Asian hours on Monday. The 14-day Relative Strength Index (RSI) momentum indicator at 54 (neutral) is edging higher, signaling improving momentum. RSI near mid-50s keeps momentum balanced. A sustained push above 60 would firm bullish control.
The technical analysis of the daily chart shows that the pair hovers around a flattening nine-day Exponential Moving Average (EMA), while the 50-day EMA trends higher, underpinning a mild bullish bias. Holding above the rising 50-day EMA would preserve the upward tone.
With the short-term average still above the medium-term average, trend context favors dips being supported, though consolidation may persist while the nine-day EMA remains flat. A daily close above that short-term average at 1.1822 could unlock continuation higher toward the region around 1.2082, the highest level since June 2021.
Whereas a break back below the short-term average would expose the 50-day EMA at 1.1746 and shift focus to deeper supports toward the three-month low at 1.1578, set on January 19.
(The technical analysis of this story was written with the help of an AI tool.)
Euro Price Today
The table below shows the percentage change of Euro (EUR) against listed major currencies today. Euro was the strongest against the British Pound.
| USD | EUR | GBP | JPY | CAD | AUD | NZD | CHF | |
|---|---|---|---|---|---|---|---|---|
| USD | -0.02% | 0.12% | -0.24% | 0.02% | -0.08% | 0.06% | 0.04% | |
| EUR | 0.02% | 0.14% | -0.24% | 0.04% | -0.06% | 0.10% | 0.06% | |
| GBP | -0.12% | -0.14% | -0.36% | -0.09% | -0.20% | -0.05% | -0.08% | |
| JPY | 0.24% | 0.24% | 0.36% | 0.25% | 0.15% | 0.28% | 0.27% | |
| CAD | -0.02% | -0.04% | 0.09% | -0.25% | -0.10% | 0.03% | 0.02% | |
| AUD | 0.08% | 0.06% | 0.20% | -0.15% | 0.10% | 0.13% | 0.12% | |
| NZD | -0.06% | -0.10% | 0.05% | -0.28% | -0.03% | -0.13% | -0.02% | |
| CHF | -0.04% | -0.06% | 0.08% | -0.27% | -0.02% | -0.12% | 0.02% |
The heat map shows percentage changes of major currencies against each other. The base currency is picked from the left column, while the quote currency is picked from the top row. For example, if you pick the Euro from the left column and move along the horizontal line to the US Dollar, the percentage change displayed in the box will represent EUR (base)/USD (quote).

Higit sa isang milyong user ang umaasa sa FXStreet para sa real-time market data, charting tools, expert insights, at Forex news. Ang komprehensibong economic calendar at educational webinars nito ay tumutulong sa mga trader na manatiling may alam at gumawa ng kalkuladong mga desisyon. Sinusuportahan ang FXStreet ng humigit-kumulang 60 propesyonal sa pagitan ng Barcelona HQ at iba’t ibang rehiyon sa buong mundo.
Magbasa pa


