
EUR/USD Price Forecast: Trades around 1.1700 after rebounding from 50-day EMA
Ni Akhtar Faruqui
Petsa ng Pag-publish: 7 Jan 2026 | Petsa ng Pag-edit: 7 Jan 2026


Sikat na Artikulo

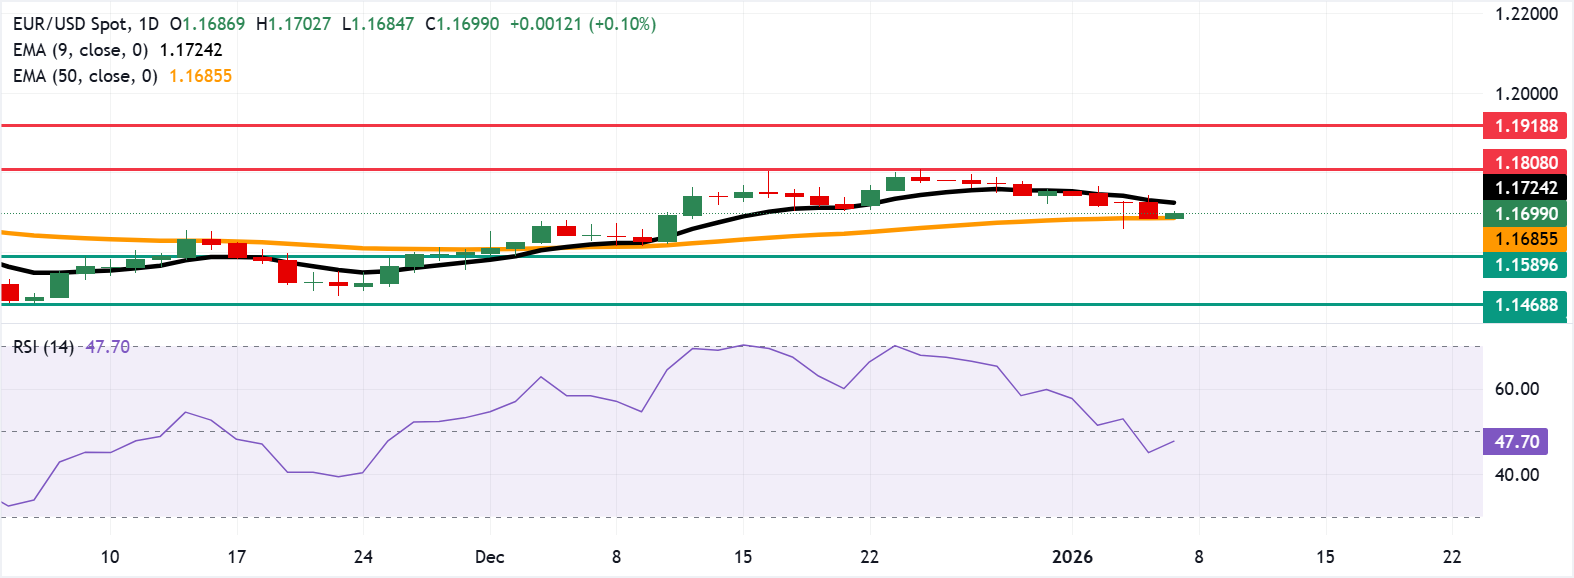
EUR/USD gains ground after three days of losses, trading around 1.1700 during the Asian hours on Wednesday. On the daily chart, technical analysis indicates a potential for a bearish bias; the 14-day Relative Strength Index (RSI) at 47 (neutral) confirms waning momentum.
- EUR/USD may find its immediate support at the 50-day EMA of 1.1684.
- The 14-day Relative Strength Index at 47 signals neutral conditions and fading momentum.
- The initial resistance lies at the nine-day EMA of 1.1724.
EUR/USD gains ground after three days of losses, trading around 1.1700 during the Asian hours on Wednesday. On the daily chart, technical analysis indicates a potential for a bearish bias; the 14-day Relative Strength Index (RSI) at 47 (neutral) confirms waning momentum.
The EUR/USD pair holds above the rising 50-day Exponential Moving Average (EMA), but sits beneath the nine-day EMA, which caps upside. The broader tone remains positive while above the medium-term average, though failure to reclaim the short-term average would keep the pullback intact.
The EUR/USD pair could re-test its immediate support at the 50-day EMA of 1.1684. A close below the first support would weaken the medium-term price momentum and put downward pressure on the pair to test the monthly low of 1.1589, set on December 1.
On the upside, the EUR/USD pair could target the nine-day EMA at 1.1724, followed by the three-month high of 1.1808, which was recorded on December 24. Further advances would improve the short-term momentum and open the doors toward the 1.1918, the highest level since June 2021.
Euro Price Today
The table below shows the percentage change of Euro (EUR) against listed major currencies today. Euro was the strongest against the Canadian Dollar.
| USD | EUR | GBP | JPY | CAD | AUD | NZD | CHF | |
|---|---|---|---|---|---|---|---|---|
| USD | -0.11% | -0.10% | -0.02% | 0.03% | -0.16% | -0.09% | -0.10% | |
| EUR | 0.11% | 0.00% | 0.09% | 0.13% | -0.06% | 0.04% | 0.00% | |
| GBP | 0.10% | -0.01% | 0.08% | 0.13% | -0.06% | 0.04% | 0.00% | |
| JPY | 0.02% | -0.09% | -0.08% | 0.06% | -0.13% | -0.04% | -0.07% | |
| CAD | -0.03% | -0.13% | -0.13% | -0.06% | -0.19% | -0.09% | -0.13% | |
| AUD | 0.16% | 0.06% | 0.06% | 0.13% | 0.19% | 0.10% | 0.07% | |
| NZD | 0.09% | -0.04% | -0.04% | 0.04% | 0.09% | -0.10% | -0.04% | |
| CHF | 0.10% | -0.01% | -0.00% | 0.07% | 0.13% | -0.07% | 0.04% |
The heat map shows percentage changes of major currencies against each other. The base currency is picked from the left column, while the quote currency is picked from the top row. For example, if you pick the Euro from the left column and move along the horizontal line to the US Dollar, the percentage change displayed in the box will represent EUR (base)/USD (quote).
(The technical analysis of this story was written with the help of an AI tool.)

Higit sa isang milyong user ang umaasa sa FXStreet para sa real-time market data, charting tools, expert insights, at Forex news. Ang komprehensibong economic calendar at educational webinars nito ay tumutulong sa mga trader na manatiling may alam at gumawa ng kalkuladong mga desisyon. Sinusuportahan ang FXStreet ng humigit-kumulang 60 propesyonal sa pagitan ng Barcelona HQ at iba’t ibang rehiyon sa buong mundo.
Magbasa pa


