
GBP/JPY Price Forecast: Stalls at 213.00 as bearish flag looms
Ni Christian Borjon Valencia
Na-update: 26 Mar 2026


Sikat na Artikulo

The GBP/JPY consolidates around 213.00 for the second straight day, losses 0.09%, snapping a four-day streak of consecutive gains as traders clash with key resistance at the March 11 peak at 213.31.
- GBP/JPY capped below 213.31 as range trading extends nine days.
- Bearish flag pattern hints at downside risk if support breaks.
- Move above 213.00 targets 215.00, below 212.00 exposes deeper losses.
The GBP/JPY consolidates around 213.00 for the second straight day, losses 0.09%, snapping a four-day streak of consecutive gains as traders clash with key resistance at the March 11 peak at 213.31.
GBP/JPY Price Forecast: Technical Outlook
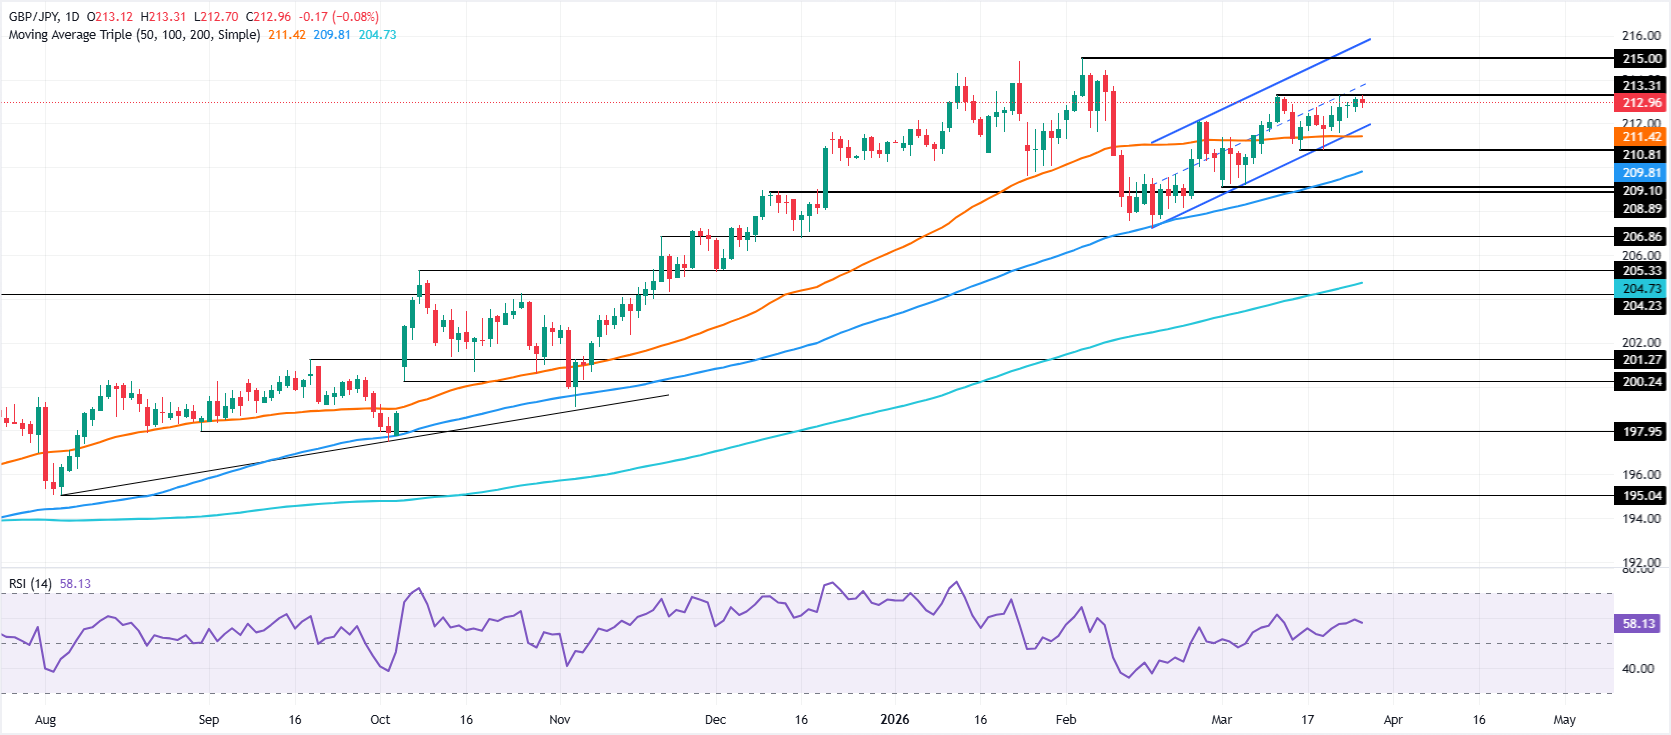
The technical picture shows GBP/JPY trading within the 211.00-213.00 range over the last 9 days, range-bound amid the lack of a clear catalyst. Additionally, it remains within a bearish flag, which, if confirmed, could open the door for further downside.
Momentum, as measured by the Relative Strength Index (RSI), is bullish, but the slope is trending lower, indicating neither buyers nor sellers are in charge.
For a bullish continuation, the GBP/JPY must clear the top of the range at 213.00. Once surpassed, the next stop would be the year-to-date (YTD) high at 215.00.
Downwards, the first area of interest would be the 212.00 figure, right around the bottom trendline of the bearish flag. A breach of the latter will expose the 50-day Simple Moving Average (SMA) at 211.42, ahead of testing the March 16 swing low of 210.81.
GBP/JPY Price Chart – Daily
Australian Dollar Price This week
The table below shows the percentage change of Australian Dollar (AUD) against listed major currencies this week. Australian Dollar was the strongest against the New Zealand Dollar.
| USD | EUR | GBP | JPY | CAD | AUD | NZD | CHF | |
|---|---|---|---|---|---|---|---|---|
| USD | -0.01% | -0.19% | 0.19% | 0.95% | 1.55% | 0.96% | 0.76% | |
| EUR | 0.01% | -0.15% | 0.24% | 0.97% | 1.56% | 0.99% | 0.78% | |
| GBP | 0.19% | 0.15% | 0.34% | 1.14% | 1.73% | 1.15% | 0.88% | |
| JPY | -0.19% | -0.24% | -0.34% | 0.72% | 1.34% | 0.74% | 0.46% | |
| CAD | -0.95% | -0.97% | -1.14% | -0.72% | 0.61% | 0.02% | -0.20% | |
| AUD | -1.55% | -1.56% | -1.73% | -1.34% | -0.61% | -0.58% | -0.85% | |
| NZD | -0.96% | -0.99% | -1.15% | -0.74% | -0.02% | 0.58% | -0.27% | |
| CHF | -0.76% | -0.78% | -0.88% | -0.46% | 0.20% | 0.85% | 0.27% |
The heat map shows percentage changes of major currencies against each other. The base currency is picked from the left column, while the quote currency is picked from the top row. For example, if you pick the Australian Dollar from the left column and move along the horizontal line to the US Dollar, the percentage change displayed in the box will represent AUD (base)/USD (quote).

Higit sa isang milyong user ang umaasa sa FXStreet para sa real-time market data, charting tools, expert insights, at Forex news. Ang komprehensibong economic calendar at educational webinars nito ay tumutulong sa mga trader na manatiling may alam at gumawa ng kalkuladong mga desisyon. Sinusuportahan ang FXStreet ng humigit-kumulang 60 propesyonal sa pagitan ng Barcelona HQ at iba’t ibang rehiyon sa buong mundo.
Magbasa pa


