
GBP/JPY Price Forecasts: Pound holds gains right below the 213.70 resistance area
Ni Guillermo Alcala
Na-update: 21 May 2026


Sikat na Artikulo

The British Pound (GBP) is trading practically flat against the Japanese Yen (JPY) on Thursday, right below one-week highs around 213.70.
- GBP/JPY stalls below 213.70 resistance, after a 0.85% weekly appreciation.
- The Pound has shrugged off soft CPI data and concerns about the UK's political uncertainty.
- In Japan, strong trade data and hawkish comments by BoJ's Koeda have failed to lift the Yen.
The British Pound (GBP) is trading practically flat against the Japanese Yen (JPY) on Thursday, right below one-week highs around 213.70. The Sterling has shrugged off soft UK CPI data released on Wednesday and investors’ concerns about the UK labour Cabinet’s weakness, and rallies 0.85% so far this week.
In Japan, April's Trade Balance data released earlier on the day showed an unexpected surplus amid a larger-than-expected increase in exports. Beyond that, Bank of Japan (BoJ) Board member Junko Koeda stated that the bank should raise interest rates as price pressures grow. The positive impact on the yen, however, has been marginal.
Technical Analysis: Bulls eye range top at 214.38
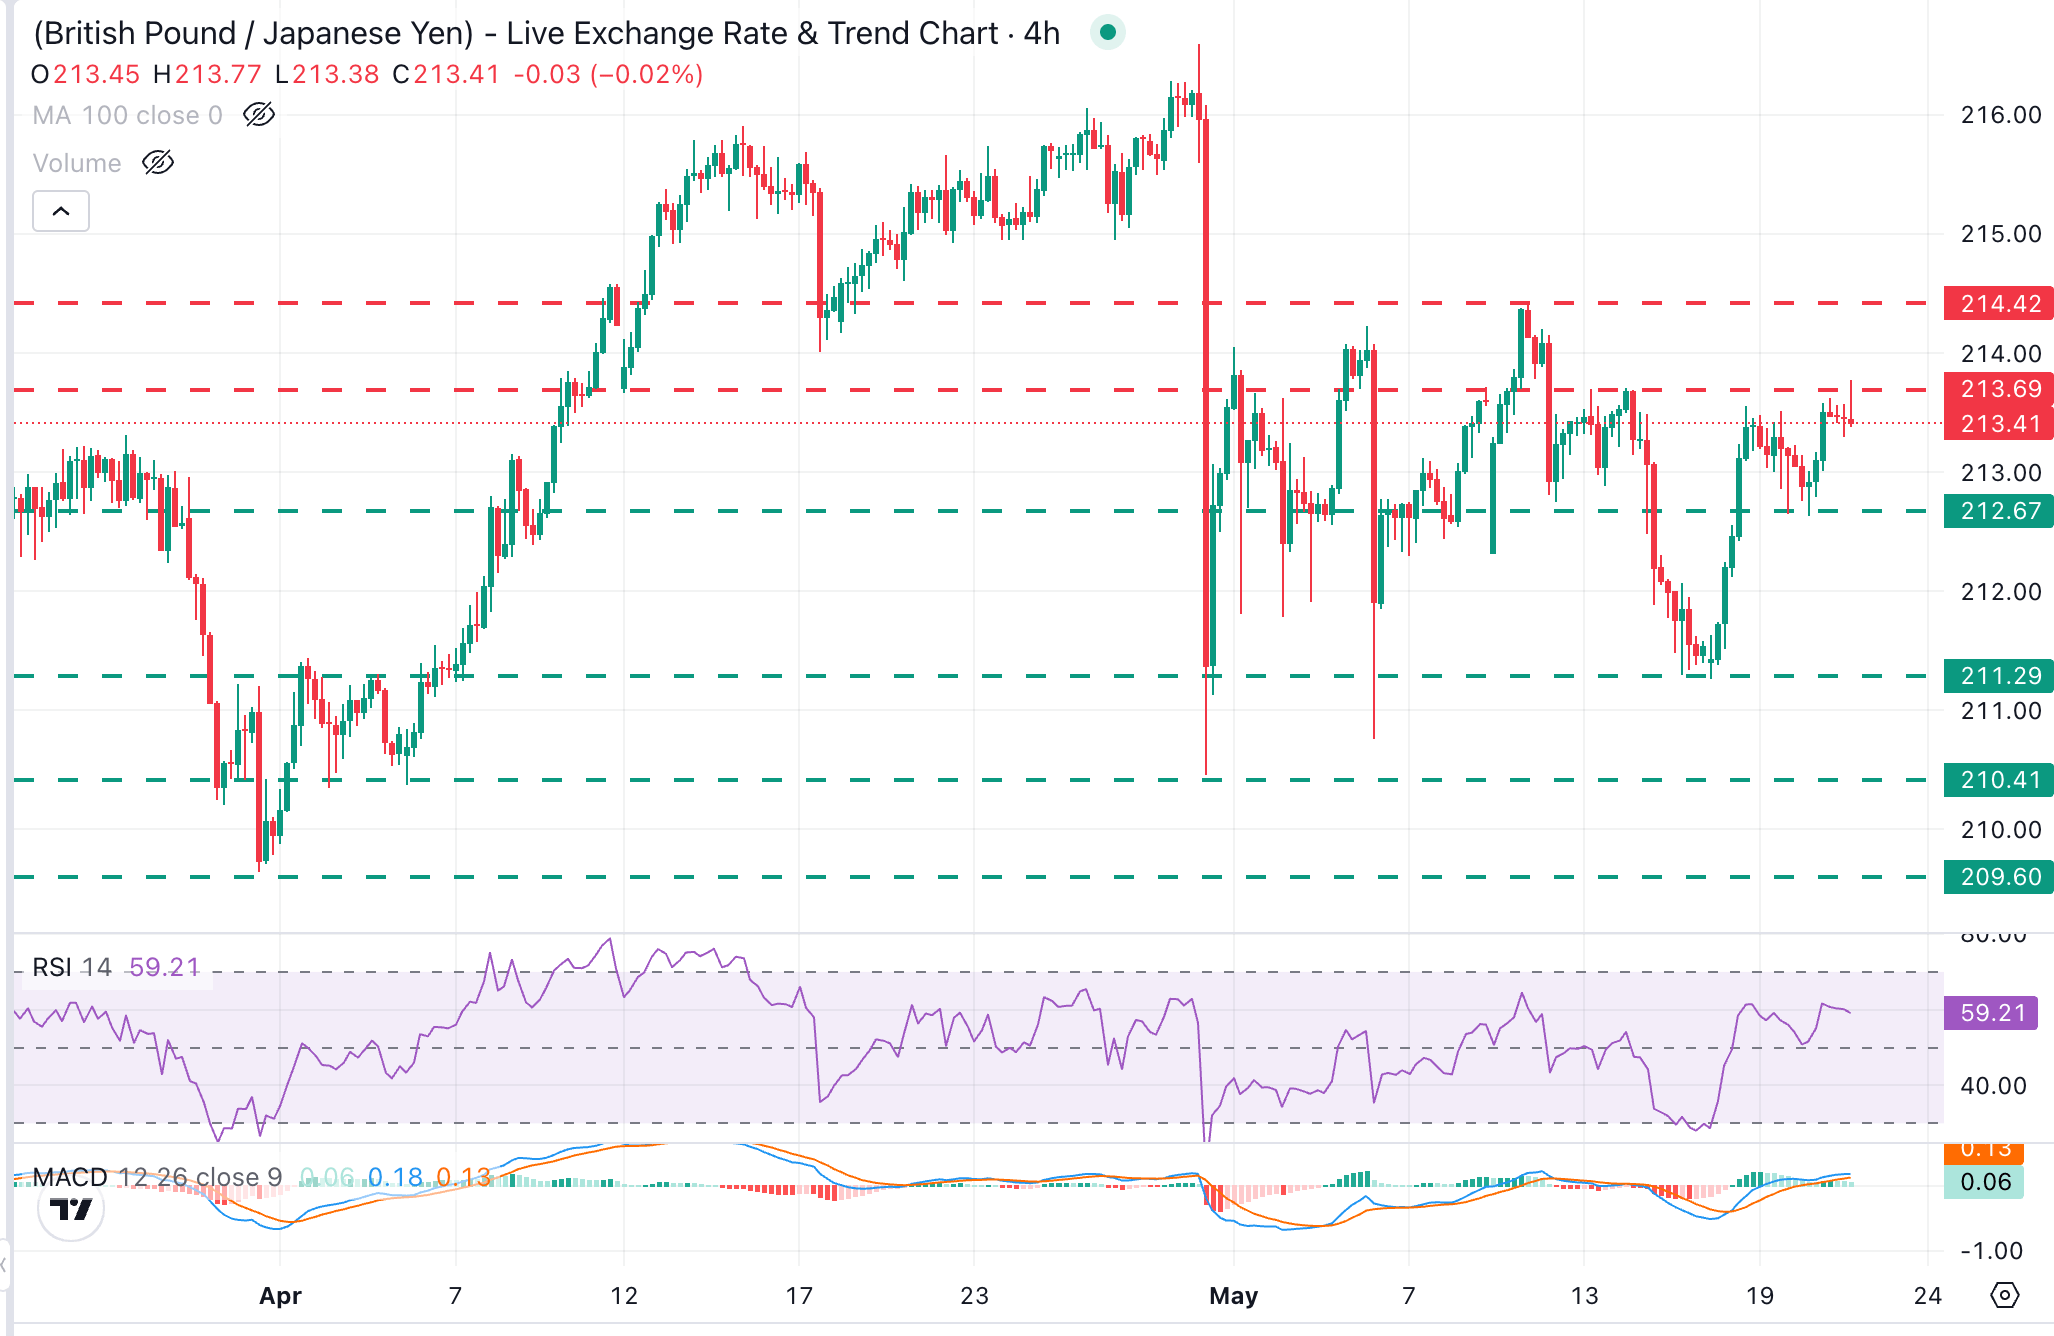
GBP/JPY trades at 213.41, holding a constructive bias, with nearby resistance at 213.70 under pressure. Momentum indicators in the 4-hour chart support the positive view. The Relative Strength Index (RSI) at 59.21 leans towards the bullish side without being overbought, and the Moving Average Convergence Divergence (MACD) indicator holds slightly positive territory, hinting that upside momentum is still intact but not explosive
Bulls are looking beyond the mentioned 213,70 resistance level to the May 11 high, near 214.40, the top of May's trading range. Above here, the next target would be the April 30 high, at 216.60.
On the downside, initial support is located at Tuesday's low, of 212.65, followed by the May 17 low near 211.25 and the April 2, 3, and 30 lows, near 210.40
(The technical analysis of this story was written with the help of an AI tool.)
Pound Sterling Price Today
The table below shows the percentage change of British Pound (GBP) against listed major currencies today. British Pound was the strongest against the Australian Dollar.
| USD | EUR | GBP | JPY | CAD | AUD | NZD | CHF | |
|---|---|---|---|---|---|---|---|---|
| USD | 0.14% | 0.04% | 0.06% | 0.21% | 0.47% | 0.19% | 0.04% | |
| EUR | -0.14% | -0.11% | -0.06% | 0.05% | 0.32% | -0.00% | -0.11% | |
| GBP | -0.04% | 0.11% | 0.04% | 0.16% | 0.44% | 0.13% | -0.01% | |
| JPY | -0.06% | 0.06% | -0.04% | 0.11% | 0.41% | 0.05% | -0.03% | |
| CAD | -0.21% | -0.05% | -0.16% | -0.11% | 0.30% | -0.02% | -0.17% | |
| AUD | -0.47% | -0.32% | -0.44% | -0.41% | -0.30% | -0.32% | -0.48% | |
| NZD | -0.19% | 0.00% | -0.13% | -0.05% | 0.02% | 0.32% | -0.15% | |
| CHF | -0.04% | 0.11% | 0.01% | 0.03% | 0.17% | 0.48% | 0.15% |
The heat map shows percentage changes of major currencies against each other. The base currency is picked from the left column, while the quote currency is picked from the top row. For example, if you pick the British Pound from the left column and move along the horizontal line to the US Dollar, the percentage change displayed in the box will represent GBP (base)/USD (quote).

Higit sa isang milyong user ang umaasa sa FXStreet para sa real-time market data, charting tools, expert insights, at Forex news. Ang komprehensibong economic calendar at educational webinars nito ay tumutulong sa mga trader na manatiling may alam at gumawa ng kalkuladong mga desisyon. Sinusuportahan ang FXStreet ng humigit-kumulang 60 propesyonal sa pagitan ng Barcelona HQ at iba’t ibang rehiyon sa buong mundo.
Magbasa pa


