
GBP/JPY slips as Iran signals Hormuz reopening, Oil prices tumble
Ni Vishal Chaturvedi
Na-update: 17 Apr 2026


Sikat na Artikulo

GBP/JPY trades with a mild downside bias on Friday in relatively calm market conditions, with the Japanese Yen modestly outperforming the British Pound as growing expectations around a potential US–Iran peace agreement weigh on Oil prices.
- GBP/JPY eases from multi-year highs as falling Oil prices support the Japanese Yen.
- Strait of Hormuz reopening sends WTI sharply lower, easing pressure on Japan’s import costs.
- Technically, GBP/JPY remains constructive above the 20-day SMA, upside capped near 216.40
GBP/JPY trades with a mild downside bias on Friday in relatively calm market conditions, with the Japanese Yen modestly outperforming the British Pound as growing expectations around a potential US–Iran peace agreement weigh on Oil prices. At the time of writing, the cross is trading around 215.05, easing from an intraday high of 215.69.
Earlier this week, GBP/JPY rallied to its highest level since July 2008, reaching 215.91, as a surge in Oil prices weighed on the Japanese Yen, given Japan’s heavy reliance on energy imports. However, with Oil prices now trimming some of the geopolitical risk premium, the Yen is regaining traction. Despite the recent pullback, the cross remains on track for a second consecutive weekly advance.
Iran’s Foreign Minister Abbas Araghchi said on Friday that the Strait of Hormuz is now “completely open” for all commercial vessels for the duration of the ceasefire, in line with the truce in Lebanon. In reaction, Crude prices retreated sharply with West Texas Intermediate (WTI) sliding to its lowest level since March 11. At the time of writing, WTI is trading around $81.50, down nearly 9% on the day.
Technical Analysis:
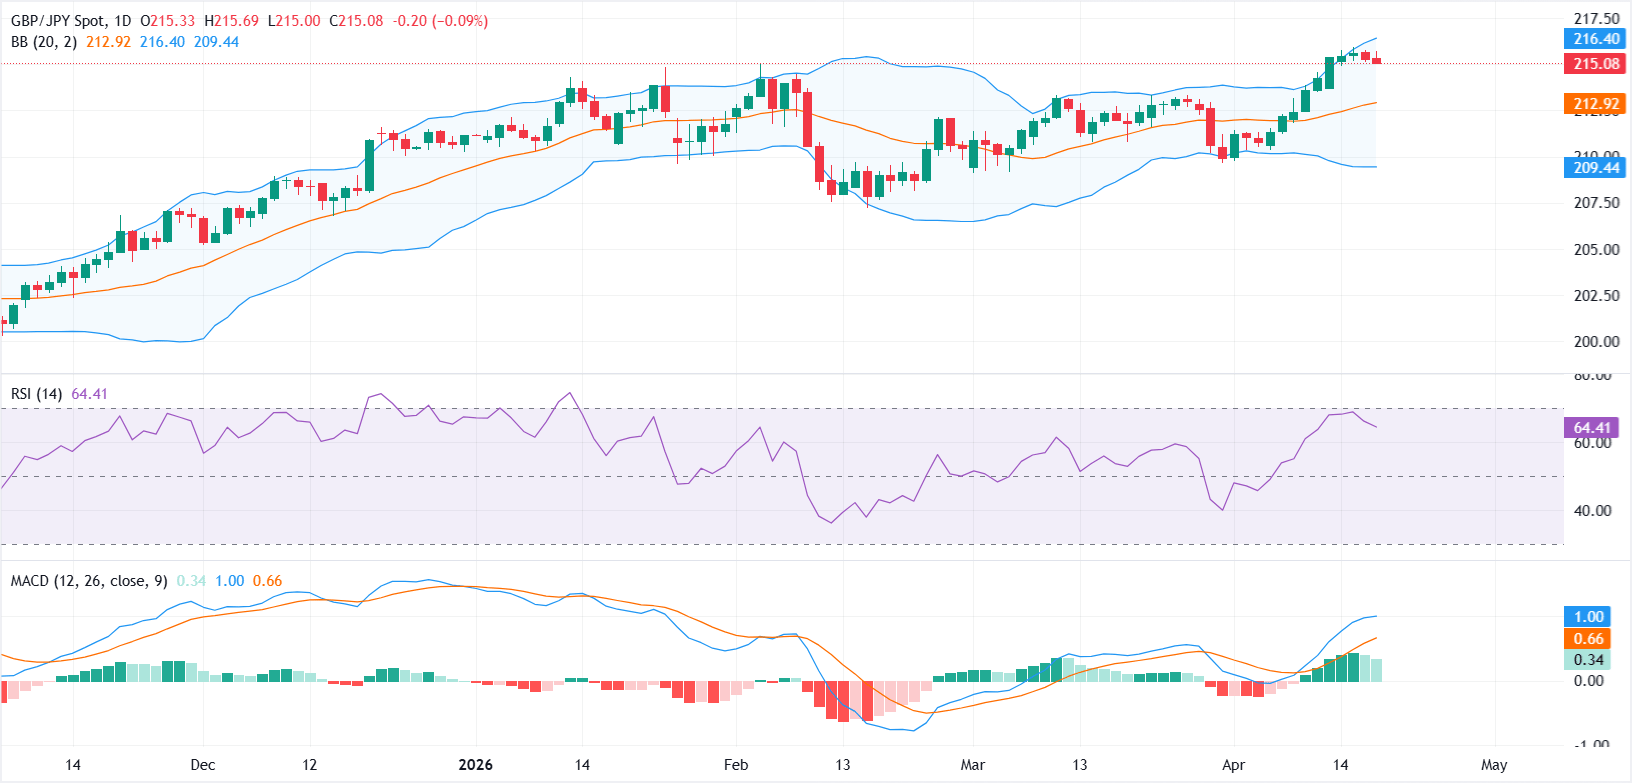
In the daily chart, GBP/JPY holds a constructive bullish bias, holding well above the 20-day Simple Moving Average (SMA) from the Bollinger Bands at 212.92. The pair is pressing into the upper half of the recent volatility envelope, with the upper Bollinger band at 216.39 acting as the next upside cap. Momentum remains supportive, as the 14-day Relative Strength Index at 63.83 stays in positive territory without yet signaling extreme overbought conditions, while the Moving Average Convergence Divergence (MACD) histogram remains positive around 0.33, hinting that buyers still retain control.
On the topside, immediate resistance is located at the Bollinger upper band near 216.39, and a daily close above this barrier would open the way to further gains in the short term. On the downside, initial support emerges at the 20-day SMA Bollinger midline around 212.92, ahead of a deeper technical floor at the lower band near 209.45, where any pullback would be expected to attract renewed demand while the broader bullish structure remains intact.
(The technical analysis of this story was written with the help of an AI tool.)
Japanese Yen Price Today
The table below shows the percentage change of Japanese Yen (JPY) against listed major currencies today. Japanese Yen was the strongest against the US Dollar.
| USD | EUR | GBP | JPY | CAD | AUD | NZD | CHF | |
|---|---|---|---|---|---|---|---|---|
| USD | -0.52% | -0.43% | -0.52% | -0.33% | -0.75% | -0.53% | -0.64% | |
| EUR | 0.52% | 0.09% | -0.04% | 0.17% | -0.23% | -0.01% | -0.14% | |
| GBP | 0.43% | -0.09% | -0.13% | 0.09% | -0.31% | -0.11% | -0.21% | |
| JPY | 0.52% | 0.04% | 0.13% | 0.21% | -0.21% | 0.00% | -0.11% | |
| CAD | 0.33% | -0.17% | -0.09% | -0.21% | -0.41% | -0.20% | -0.30% | |
| AUD | 0.75% | 0.23% | 0.31% | 0.21% | 0.41% | 0.21% | 0.10% | |
| NZD | 0.53% | 0.01% | 0.11% | -0.00% | 0.20% | -0.21% | -0.12% | |
| CHF | 0.64% | 0.14% | 0.21% | 0.11% | 0.30% | -0.10% | 0.12% |
The heat map shows percentage changes of major currencies against each other. The base currency is picked from the left column, while the quote currency is picked from the top row. For example, if you pick the Japanese Yen from the left column and move along the horizontal line to the US Dollar, the percentage change displayed in the box will represent JPY (base)/USD (quote).

Higit sa isang milyong user ang umaasa sa FXStreet para sa real-time market data, charting tools, expert insights, at Forex news. Ang komprehensibong economic calendar at educational webinars nito ay tumutulong sa mga trader na manatiling may alam at gumawa ng kalkuladong mga desisyon. Sinusuportahan ang FXStreet ng humigit-kumulang 60 propesyonal sa pagitan ng Barcelona HQ at iba’t ibang rehiyon sa buong mundo.
Magbasa pa


