

Gold Price Forecast: XAU/USD rebounds above $4,000 with US CPI in focus
- Gold price rises to near $4,020 ahead of the US CPI data for June.
- The US Dollar trades lower in the countdown to the US inflation data.
- Increasing military aggression between the US and Iran has lifted oil prices.
Gold price (XAU/USD) is up 0.5% to near $4,020 during the European trading session on Tuesday. The precious metal gains as the US Dollar (USD) corrects ahead of the United States (US) Consumer Price Index (CPI) data for June, which will be published at 12:30 GMT.

US Dollar Price Today
The table below shows the percentage change of US Dollar (USD) against listed major currencies today. US Dollar was the weakest against the New Zealand Dollar.
| USD | EUR | GBP | JPY | CAD | AUD | NZD | CHF | |
|---|---|---|---|---|---|---|---|---|
| USD | -0.12% | -0.21% | -0.15% | -0.44% | -0.42% | -0.91% | -0.30% | |
| EUR | 0.12% | -0.09% | -0.04% | -0.32% | -0.31% | -0.76% | -0.17% | |
| GBP | 0.21% | 0.09% | 0.07% | -0.21% | -0.19% | -0.69% | -0.07% | |
| JPY | 0.15% | 0.04% | -0.07% | -0.28% | -0.28% | -0.78% | -0.17% | |
| CAD | 0.44% | 0.32% | 0.21% | 0.28% | 0.00% | -0.47% | 0.14% | |
| AUD | 0.42% | 0.31% | 0.19% | 0.28% | -0.01% | -0.48% | 0.14% | |
| NZD | 0.91% | 0.76% | 0.69% | 0.78% | 0.47% | 0.48% | 0.62% | |
| CHF | 0.30% | 0.17% | 0.07% | 0.17% | -0.14% | -0.14% | -0.62% |
The heat map shows percentage changes of major currencies against each other. The base currency is picked from the left column, while the quote currency is picked from the top row. For example, if you pick the US Dollar from the left column and move along the horizontal line to the Japanese Yen, the percentage change displayed in the box will represent USD (base)/JPY (quote).
At press time, the US Dollar Index (DXY), which gauges the Greenback’s value against six major currencies, trades 0.18% lower to near 101.10.
Technically, a lower US Dollar makes the Gold price an attractive bet for investors.
Investors will closely track the US CPI data to get fresh cues regarding the Federal Reserve’s (Fed) monetary policy outlook, as latest Federal Open Market Committee (FOMC) minutes of the June policy meeting showed that policymakers see high inflation as a “dominant risk”.
The US headline CPI is expected to arrive lower at 3.8% Year-on-Year (YoY) from 4.2% in May, with core figures growing steadily by 2.9%.
Meanwhile, surging oil prices due to ongoing military attacks between the US and Iran have de-anchored global inflation expectations, a scenario that forces central banks to tighten monetary conditions, which is unfavorable for non-yielding assets, such as Gold.
Gold technical analysis
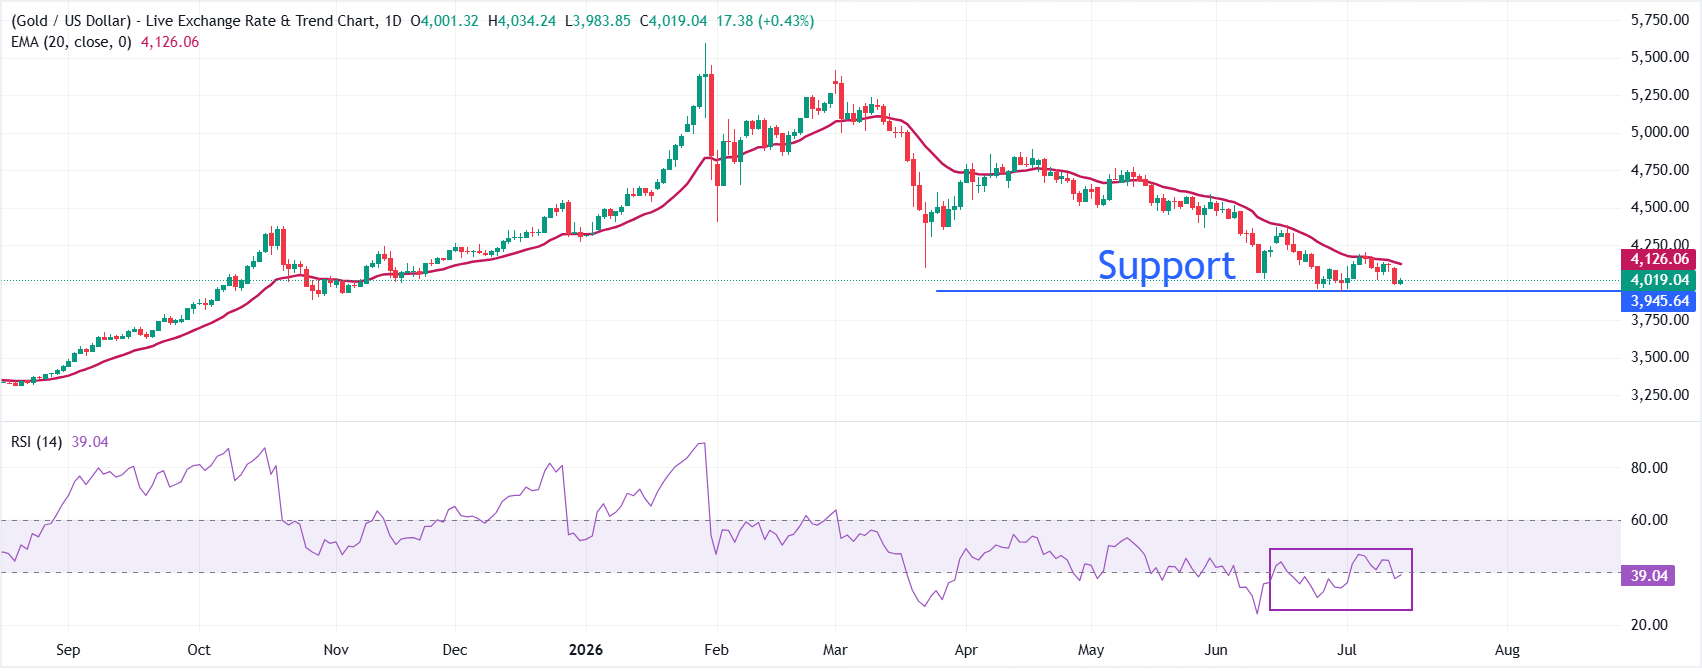
XAU/USD trades slightly higher at around $4,020 at press time. However, the precious metal reflects a bearish near-term bias as spot remains below the 20-day exponential moving average (EMA) at $4,126.07. The positioning under this key EMA suggests that rallies are still being capped by overhead supply, while the Relative Strength Index (14) around 39 hints at subdued but stabilizing downside momentum rather than aggressive selling.
On the topside, immediate resistance is defined by the 20-day EMA at $4,126.07, and a daily close above this barrier would be needed to ease current bearish pressure and open the way for a more sustained recovery. Looking up, the July 6 high at $4,202.61 will be the key barrier. On the downside, the Gold price could be exposed to a fresh downside leg if it drops below the June low at $3,941.76. The October 28 low at $3,886.62 will be a key support level, followed by the September 21 low at $3,717.51.
(The technical analysis of this story was written with the help of an AI tool. Know more.)
Gold FAQs
Gold has played a key role in human’s history as it has been widely used as a store of value and medium of exchange. Currently, apart from its shine and usage for jewelry, the precious metal is widely seen as a safe-haven asset, meaning that it is considered a good investment during turbulent times. Gold is also widely seen as a hedge against inflation and against depreciating currencies as it doesn’t rely on any specific issuer or government.
Central banks are the biggest Gold holders. In their aim to support their currencies in turbulent times, central banks tend to diversify their reserves and buy Gold to improve the perceived strength of the economy and the currency. High Gold reserves can be a source of trust for a country’s solvency. Central banks added 1,136 tonnes of Gold worth around $70 billion to their reserves in 2022, according to data from the World Gold Council. This is the highest yearly purchase since records began. Central banks from emerging economies such as China, India and Turkey are quickly increasing their Gold reserves.
Gold has an inverse correlation with the US Dollar and US Treasuries, which are both major reserve and safe-haven assets. When the Dollar depreciates, Gold tends to rise, enabling investors and central banks to diversify their assets in turbulent times. Gold is also inversely correlated with risk assets. A rally in the stock market tends to weaken Gold price, while sell-offs in riskier markets tend to favor the precious metal.
The price can move due to a wide range of factors. Geopolitical instability or fears of a deep recession can quickly make Gold price escalate due to its safe-haven status. As a yield-less asset, Gold tends to rise with lower interest rates, while higher cost of money usually weighs down on the yellow metal. Still, most moves depend on how the US Dollar (USD) behaves as the asset is priced in dollars (XAU/USD). A strong Dollar tends to keep the price of Gold controlled, whereas a weaker Dollar is likely to push Gold prices up.














