
Hyperliquid Price Forecast: HYPE consolidates as traders show mixed sentiment
Ni Manish Chhetri
Petsa ng Pag-publish: 10 Feb 2026 | Petsa ng Pag-edit: 10 Feb 2026


Sikat na Artikulo

Hyperliquid (HYPE) price is trading sideways at the time of writing on Tuesday, reflecting market indecision as traders await a clearer directional signal. The derivatives data further supports this mixed sentiment, with rising short bets while funding rates remain positive.
- Hyperliquid price trades sideways, holding within the $30.78-$36.51 range.
- Mixed sentiment among traders with rising short bets while funding rates stay positive.
- The technical outlook suggests a wait-and-see approach to the next directional move.
Hyperliquid (HYPE) price is trading sideways at the time of writing on Tuesday, reflecting market indecision as traders await a clearer directional signal. The derivatives data further supports this mixed sentiment, with rising short bets while funding rates remain positive.
Mixed signals among HYPE traders
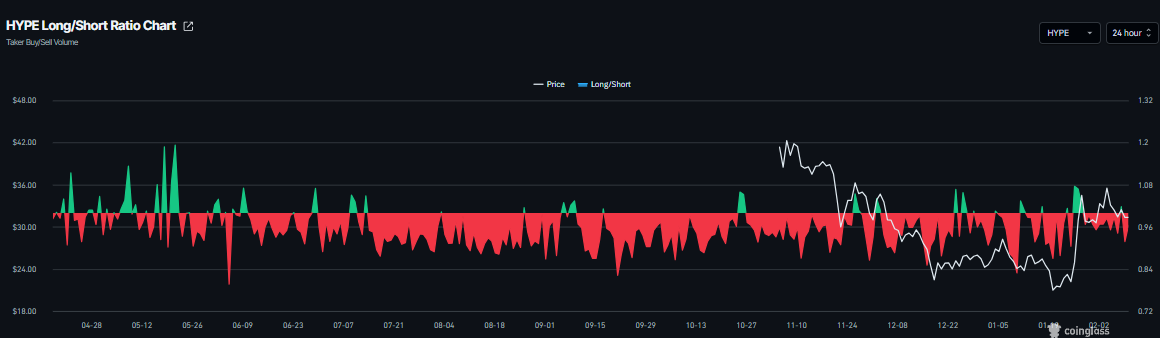
Hyperliquid’s derivatives data shows mixed signals. CoinGlass long-to-short ratio for HYPE reads 0.91 on Tuesday. This ratio, being below one, reflects bearish sentiment in the market, as more traders are betting on the asset's price to fall.
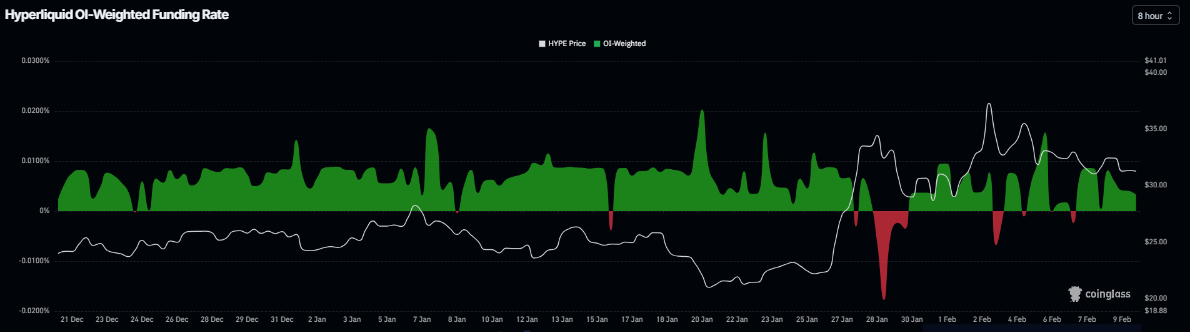
Meanwhile, the funding rates support a bullish thesis. CoinGlass’s OI-Weighted Funding Rate data shows that the number of traders betting that the price of HYPE will slide further is lower than those anticipating a price increase.
The metric flipped to a positive rate on Saturday and currently stands at 0.0033% on Tuesday, indicating that longs are paying shorts. Historically, as shown in the chart below, when the funding rates have flipped from negative to positive, Hyperliquid’s price has rallied sharply.
Hyperliquid Price Forecast: Wait-and-see approach for the next direction move
Hyperliquid price has been trading sideways between the 100-day Exponential Moving Average (EMA) at $30.77 and the daily resistance at $36.51 since January 28. At the time of writing on Tuesday, HYPE is nearing the lower consolidating boundary at $30.77.
Traders looking to short HYPE could do so if it breaks and closes below the 100-day EMA at $30.77 on a daily basis; this could extend the decline toward weekly support at $26.85.
The Relative Strength Index (RSI) on the daily chart is 53, pointing downward toward the neutral 50 level, indicating fading bullish momentum. The Moving Average Convergence Divergence (MACD) is showing a bearish crossover on Tuesday, suggesting early signs of bearish momentum.
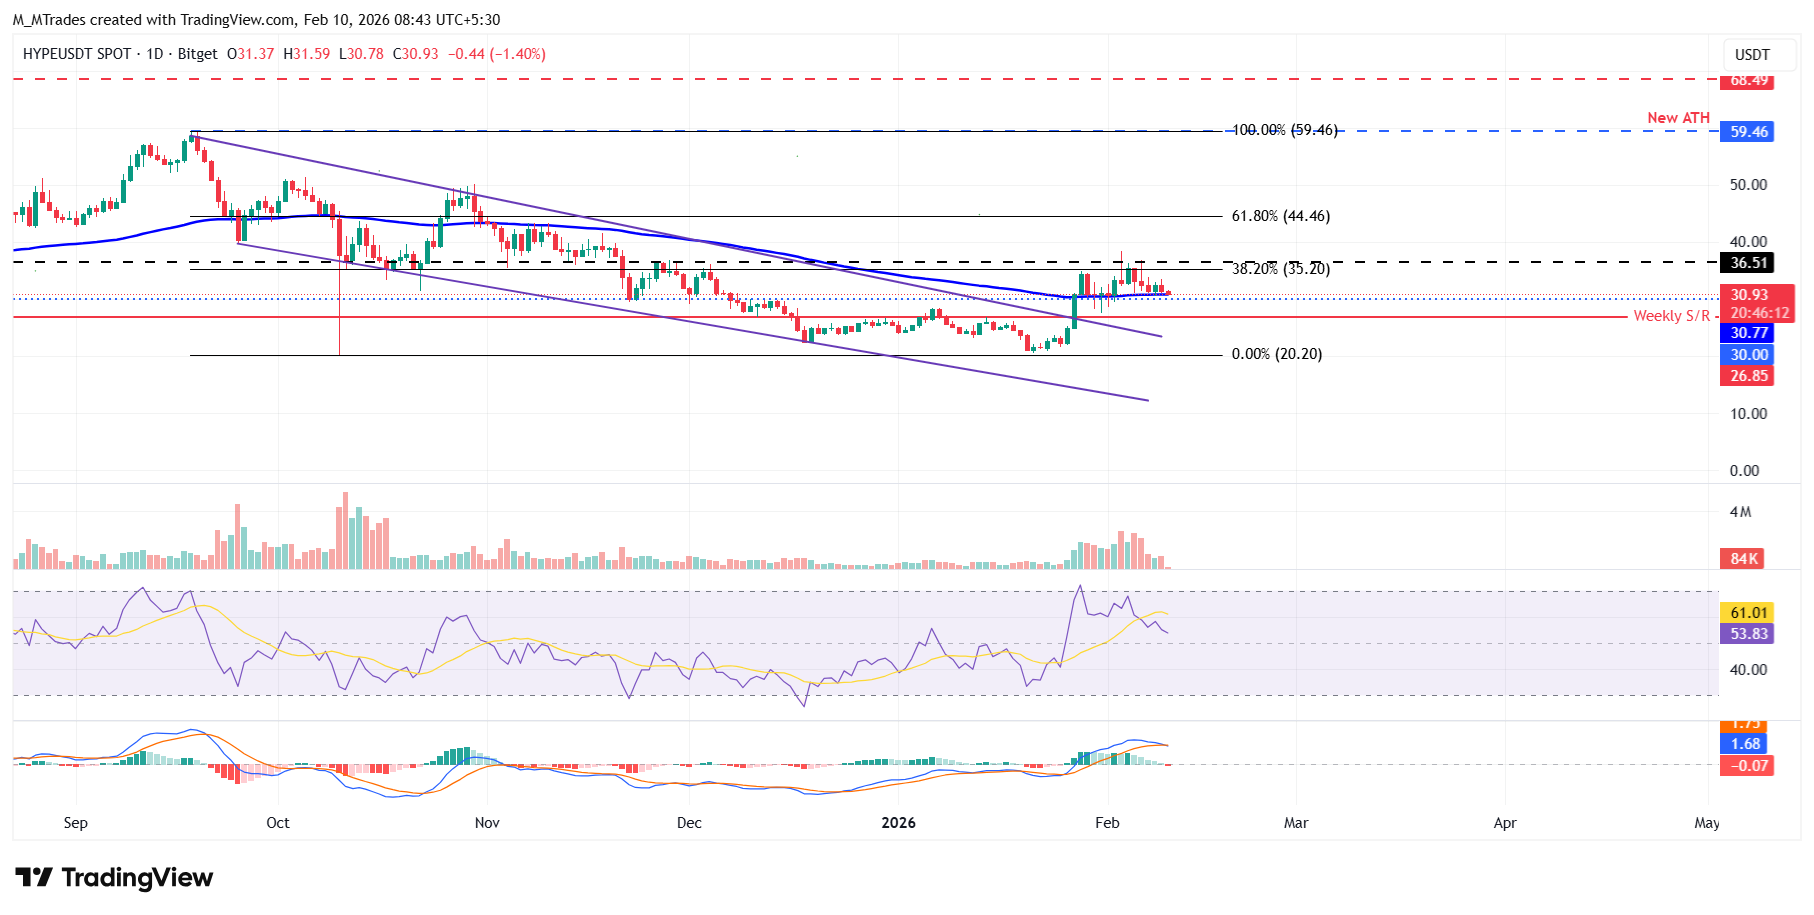
However, if HYPE breaks and closes above the upper consolidation range at $36.51 on a daily basis, it could extend the rally toward the 61.8% Fibonacci retracement level at $44.46.

Higit sa isang milyong user ang umaasa sa FXStreet para sa real-time market data, charting tools, expert insights, at Forex news. Ang komprehensibong economic calendar at educational webinars nito ay tumutulong sa mga trader na manatiling may alam at gumawa ng kalkuladong mga desisyon. Sinusuportahan ang FXStreet ng humigit-kumulang 60 propesyonal sa pagitan ng Barcelona HQ at iba’t ibang rehiyon sa buong mundo.
Magbasa pa


