
Kiwi slides below 0.58 as GDP miss deepens sell-off
Ni Joshua Gibson
Petsa ng Pag-publish: 18 Mar 2026 | Petsa ng Pag-edit: 18 Mar 2026


Sikat na Artikulo

NZD/USD dropped around 1.25% on Wednesday, knocking against the 200-day Exponential Moving Average (EMA) before sellers drove the pair sharply lower to settle near 0.5790.
- New Zealand Dollar hits multi-week lows after Q4 GDP disappoints and Fed Chair Powell flags slow inflation progress.
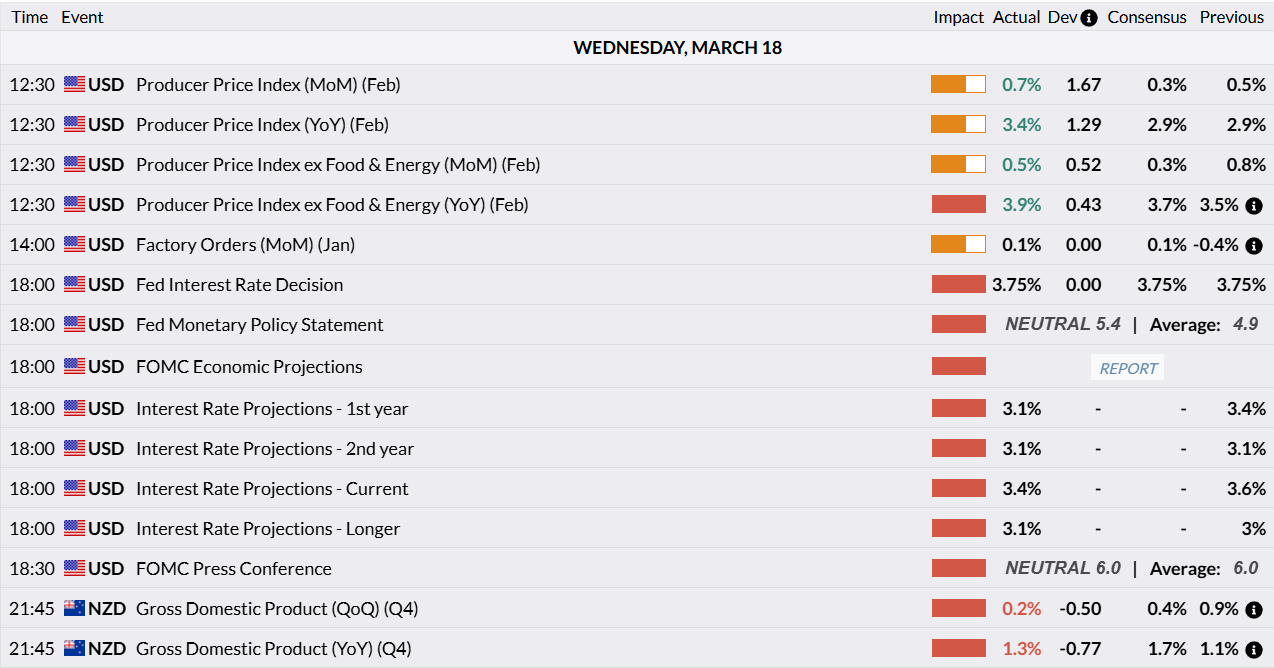
- NZ Q4 GDP rose just 0.2% QoQ versus 0.4% consensus and the RBNZ's 0.5% forecast, with Q3 growth revised down to 0.9% from 1.1%; the next OCR decision is April 8.
- Fed held rates at 3.50% to 3.75% with one cut still projected for 2026; Wednesday's PPI came in hot at 0.7% MoM versus 0.3% expected, reinforcing Powell's hawkish tone.
NZD/USD dropped around 1.25% on Wednesday, knocking against the 200-day Exponential Moving Average (EMA) before sellers drove the pair sharply lower to settle near 0.5790. The sell-off is the largest single-session decline in weeks, extending the broader slide from the early-February high close to 0.6090. The pair has now broken below both of its key daily moving averages for the first time since mid-January, with Wednesday's large bearish candle leaving little doubt about the direction of near-term momentum.
New Zealand's fourth-quarter Gross Domestic Product (GDP) data landed well below expectations, with the economy growing just 0.2% quarter-on-quarter against a 0.4% consensus and the Reserve Bank of New Zealand's (RBNZ) 0.5% projection. The YoY figure came in at 1.3% versus 1.7% expected, while the Q3 print was revised down to 0.9% from 1.1%. Construction was the main drag, offsetting moderate gains in agriculture and tourism-linked services. The soft result underscores a recovery that is losing steam, and gives the RBNZ more room to hold the Official Cash Rate (OCR) at 2.25% when it next meets on April 8, even as oil-driven inflation risks build.
On the US Dollar side, the Federal Reserve (Fed) held rates and stuck with its projection of one cut in 2026. Fed Chair Jerome Powell noted inflation progress has been slower than hoped, and the updated projections lifted the 2026 core inflation forecast to 2.7% from 2.5%. Wednesday's Producer Price Index (PPI) added to the hawkish backdrop, with headline PPI printing 0.7% MoM against a 0.3% consensus. Thursday brings US initial jobless claims and the Philadelphia Fed Manufacturing Survey, while New Zealand's February trade balance data rounds out the week's calendar for the Kiwi.
NZD/USD daily chart
Technical Analysis
In the daily chart, NZD/USD trades at 0.5788. The near-term bias is mildly bearish as price slips beneath the 50-day EMA and approaches the 200-day EMA, signaling fading upside momentum after the recent consolidation. The 50-day average has started to roll over while the 200-day flattens, highlighting a loss of trend strength rather than an established downtrend. Stochastic has dropped toward oversold territory, showing persistent downside pressure but also warning that selling strength may be slowing as price nears longer-term support.
Initial resistance emerges near the 0.5860 area, where recent swing highs converge with the 50-day EMA, and a daily close above this zone would be needed to ease immediate downside risk. A stronger barrier is seen near 0.5920, where the latest distribution phase began. On the downside, the 0.5765–0.5770 band aligns with the 200-day EMA and marks key first support; a clear break below this region would expose the next support around 0.5700. If buyers defend the 200-day average, price action is likely to revert into a 0.5770–0.5860 range while markets await a fresh directional catalyst.
(The technical analysis of this story was written with the help of an AI tool.)
New Zealand Dollar FAQs
The New Zealand Dollar (NZD), also known as the Kiwi, is a well-known traded currency among investors. Its value is broadly determined by the health of the New Zealand economy and the country’s central bank policy. Still, there are some unique particularities that also can make NZD move. The performance of the Chinese economy tends to move the Kiwi because China is New Zealand’s biggest trading partner. Bad news for the Chinese economy likely means less New Zealand exports to the country, hitting the economy and thus its currency. Another factor moving NZD is dairy prices as the dairy industry is New Zealand’s main export. High dairy prices boost export income, contributing positively to the economy and thus to the NZD.
The Reserve Bank of New Zealand (RBNZ) aims to achieve and maintain an inflation rate between 1% and 3% over the medium term, with a focus to keep it near the 2% mid-point. To this end, the bank sets an appropriate level of interest rates. When inflation is too high, the RBNZ will increase interest rates to cool the economy, but the move will also make bond yields higher, increasing investors’ appeal to invest in the country and thus boosting NZD. On the contrary, lower interest rates tend to weaken NZD. The so-called rate differential, or how rates in New Zealand are or are expected to be compared to the ones set by the US Federal Reserve, can also play a key role in moving the NZD/USD pair.
Macroeconomic data releases in New Zealand are key to assess the state of the economy and can impact the New Zealand Dollar’s (NZD) valuation. A strong economy, based on high economic growth, low unemployment and high confidence is good for NZD. High economic growth attracts foreign investment and may encourage the Reserve Bank of New Zealand to increase interest rates, if this economic strength comes together with elevated inflation. Conversely, if economic data is weak, NZD is likely to depreciate.
The New Zealand Dollar (NZD) tends to strengthen during risk-on periods, or when investors perceive that broader market risks are low and are optimistic about growth. This tends to lead to a more favorable outlook for commodities and so-called ‘commodity currencies’ such as the Kiwi. Conversely, NZD tends to weaken at times of market turbulence or economic uncertainty as investors tend to sell higher-risk assets and flee to the more-stable safe havens.

Higit sa isang milyong user ang umaasa sa FXStreet para sa real-time market data, charting tools, expert insights, at Forex news. Ang komprehensibong economic calendar at educational webinars nito ay tumutulong sa mga trader na manatiling may alam at gumawa ng kalkuladong mga desisyon. Sinusuportahan ang FXStreet ng humigit-kumulang 60 propesyonal sa pagitan ng Barcelona HQ at iba’t ibang rehiyon sa buong mundo.
Magbasa pa


