
Litecoin Price Forecast: LTC retests breakout level amid mixed signals from on-chain, derivatives
Ni Manish Chhetri
Petsa ng Pag-publish: 17 Mar 2026 | Petsa ng Pag-edit: 17 Mar 2026


Sikat na Artikulo

Litecoin (LTC) is falling slightly on Tuesday, revisiting a key support level at $57, after a bullish breakout from its consolidation pattern. Even as the technical breakout points to further gains ahead, mixed on-chain and derivatives data indicate traders remain cautious. .
- Litecoin price eases slightly on Tuesday after breaking above the consolidation range it had been trading since early February.
- Mixed on-chain and derivatives data indicate indecision among traders.
- The technical outlook suggests an upside move if LTC finds support around the upper end of its consolidation range.
Litecoin (LTC) is falling slightly on Tuesday, revisiting a key support level at $57, after a bullish breakout from its consolidation pattern. Even as the technical breakout points to further gains ahead, mixed on-chain and derivatives data indicate traders remain cautious. .
Mixed on-chain and derivatives data signals indecision
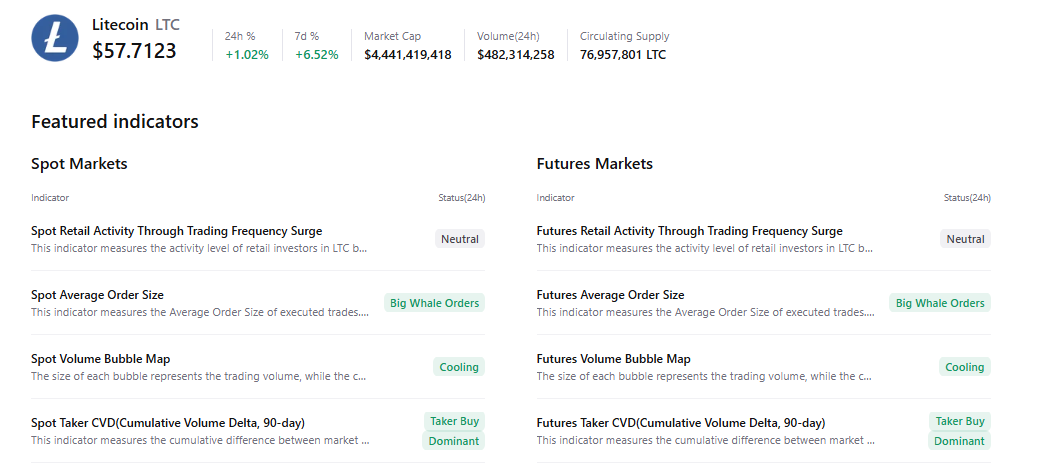
CryptoQuant’s summary data support a positive outlook for Litecoin. The chart below shows that LTC’s spot and futures markets show large whale orders, cooling conditions, and buy dominance, all of which signal a potential upside move.
However, Santiment data shows that dormant wallets are becoming active, a trend that could intensify selling pressure. Santiment’s Age Consumed index, shown below, indicates bearish signals. The spikes in this index suggest dormant tokens (tokens stored in wallets for a long time) are in motion, and it can be used to spot short-term local tops or bottoms.
In the case of Litecoin, history shows that spikes in the Age Consumed Index were generally followed by a price decline as holders moved their tokens from wallets to exchanges, thereby increasing selling pressure. The most recent uptick on Saturday suggested that Litecoin was ready for a downtrend.
 [09-1773731859336-1773731859337.34.05, 17 Mar, 2026].png)
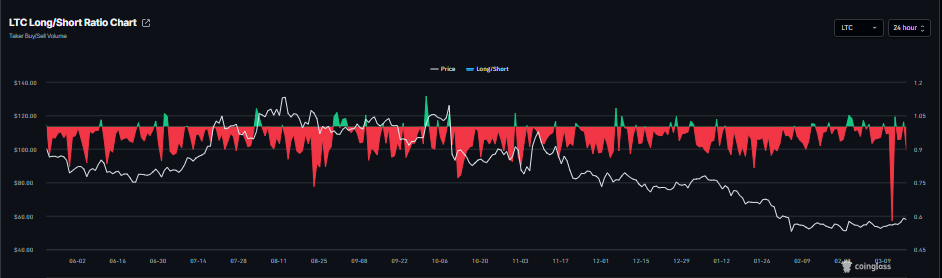
Litecoin’s derivatives data also show mixed signals. CoinGlass long-to-short ratio for LTC reads 0.89 on Tuesday. This ratio, being below one, shows that the majority of traders are betting on the asset’s price to fall.
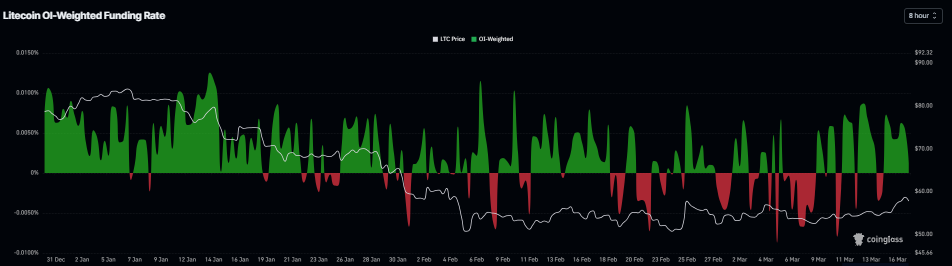
Meanwhile, the funding rates support a bullish thesis. CoinGlass’s OI-Weighted Funding Rate data shows that the number of traders betting that the price of Litecoin will slide further is lower than those anticipating a price increase. The metric flipped to a positive rate on Sunday and currently stands at 0.0013% on Tuesday, indicating that longs are paying shorts.
This combination suggests indecision among Litecoin investors and limits the chances of a sustained rally ahead.
Litecoin Price Forecast: LTC revisits key support zone
Litecoin price is trading at $57 as of writing on Tuesday. The near-term bias tilts mildly bullish as price rebounds from the mid-$50s and presses back toward the upper boundary of a short-term channel starting near $57.10. Daily closes have reclaimed the 50-day Exponential Moving Average cluster around $58.30, softening the prior downtrend even though the 100-day EMA near $65.90 is still a significant cap.
The Relative Strength Index (RSI) on the daily chart at 57 remains above its midline, suggesting improving upside momentum, while the Moving Average Convergence Divergence (MACD) line holds above its signal line and remains in positive territory, reinforcing a recovery tone.
Immediate resistance is located around the 38.2% Fibonacci retracement at $60.28, measured from the January 6 high of $84.89 and February 6 low of $45.07, with the 50.00% retracement at $64.98 as the next barrier if bulls extend control.
On the downside, initial support is around the channel top at $57.10, followed by the 23.6% retracement at $54.47, and then the recent swing low around $53.00, where prior demand emerged.
A daily close above $60.28 would open the way toward $64.98, while a drop back below $54.47 would weaken the nascent bullish bias and shift focus toward the lower $50s.
-1773731957660-1773731957661.png)
(The technical analysis of this story was written with the help of an AI tool.)

Higit sa isang milyong user ang umaasa sa FXStreet para sa real-time market data, charting tools, expert insights, at Forex news. Ang komprehensibong economic calendar at educational webinars nito ay tumutulong sa mga trader na manatiling may alam at gumawa ng kalkuladong mga desisyon. Sinusuportahan ang FXStreet ng humigit-kumulang 60 propesyonal sa pagitan ng Barcelona HQ at iba’t ibang rehiyon sa buong mundo.
Magbasa pa


