

NEAR Protocol Price Forecast: NEAR loses steam near key resistance, raising downside risks
- NEAR Protocol edges lower on Monday, testing its 50-day EMA after an overhead trendline capped last week’s growth.
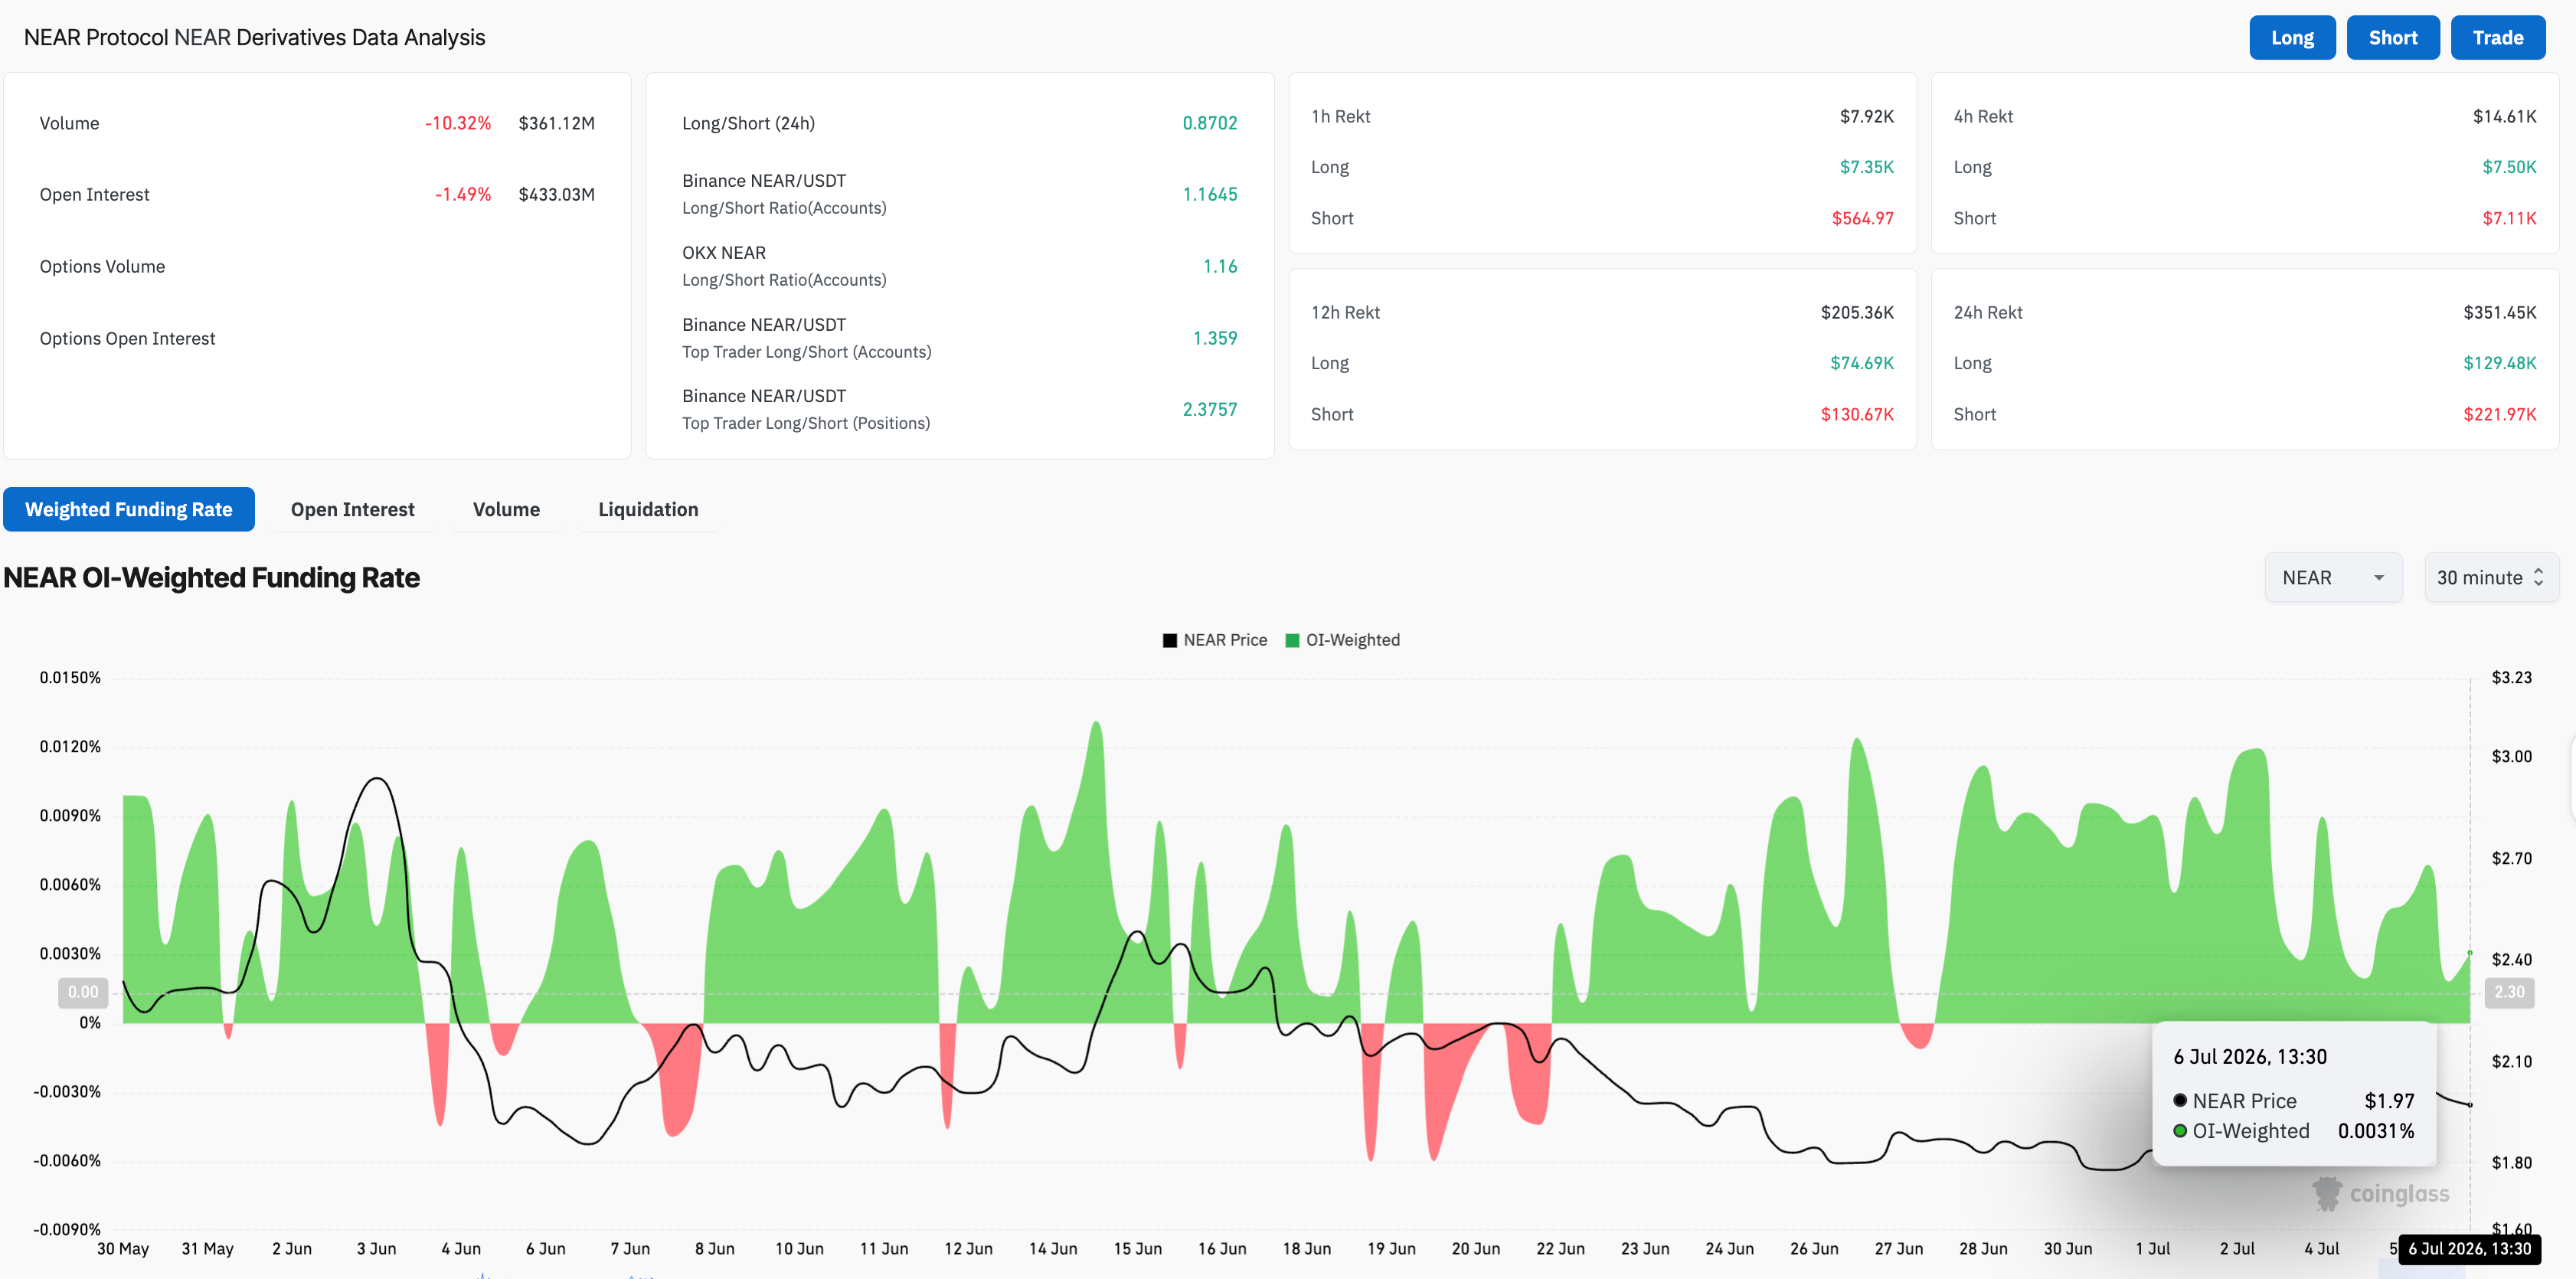
- NEAR is losing near-term retail strength amid declining Open Interest and funding rates.
- The technical outlook for NEAR is mildly bearish, with price struggling to surpass a key resistance trendline near $2.00.
NEAR Protocol (NEAR) faces weakness on Monday, reversing from a key overhead trendline near $2.00. Retail demand is easing, with NEAR futures Open Interest and funding rates waning, which sparked the previous week’s rebound. The technical outlook for NEAR Protocol raises concerns about a steeper decline, with focus on the 50-day Exponential Moving Average (EMA) support at around $1.97.

Speculations surrounding NEAR ease
NEAR Protocol derivatives data shows a gradual decline in the renewed retail support it gained last week. CoinGlass data shows the NEAR futures Open Interest (OI) has edged lower to $433 million over the last 24 hours, reflecting a mild closing up of positions as price consolidation near key resistance reduces risk appetite of leveraged traders.
At the same time, the funding rate has dropped to 0.0031% on Monday, from 0.0120% on Friday, reaffirming an easing of risk appetite among traders, who are holding long positions at a premium.
NEAR struggles for a bullish breakout
NEAR token edges lower on Monday, from an overhead trendline connecting the highs of June 4 and 16, near $2.00. The DeFi token holds above the 200-day EMA at $1.78 and tests its 50-day EMA around $1.97, which supports the intraday pullback.
A slip below the 50-day EMA at $1.97 would open the downside toward the 200-day EMA at $1.78, near a descending support trendline at $1.70, where buyers could step in to regain control.
Momentum on the daily chart is neutral to bullish near-term, with the Relative Strength Index (RSI) at 49 hinting at neutral momentum. Meanwhile, the Moving Average Convergence Divergence (MACD) rises above its signal line as positive histograms expand, indicating mild recovery in trend momentum.
On the topside, a break above the downward-sloping trendline near $2.00 could unlock further gains toward the previous swing high near $2.56, followed by the June 4 high of $2.85.
(This article was created with the help of an Artificial Intelligence tool and reviewed by an editor. Know more.)














