

NZD/USD Price Forecast: Recovery extends, but overhead SMAs cap the upside
- NZD/USD heads for a second straight weekly gain after the RBNZ's hawkish rate hike.
- Technical indicators point to improving momentum as NZD/USD climbs above the 21-day SMA.
- The pair faces stiff resistance from a cluster of key moving averages overhead.
NZD/USD remains on the front foot on Friday and is heading for a second consecutive weekly gain after the Reserve Bank of New Zealand (RBNZ) raised the Official Cash Rate (OCR) by 25 basis points (bps) on Wednesday and signaled that further policy tightening may be needed, boosting the New Zealand Dollar (NZD).

At the time of writing, the pair is trading around 0.5771 after hitting an intraday high of 0.5794, its highest level since June 18.
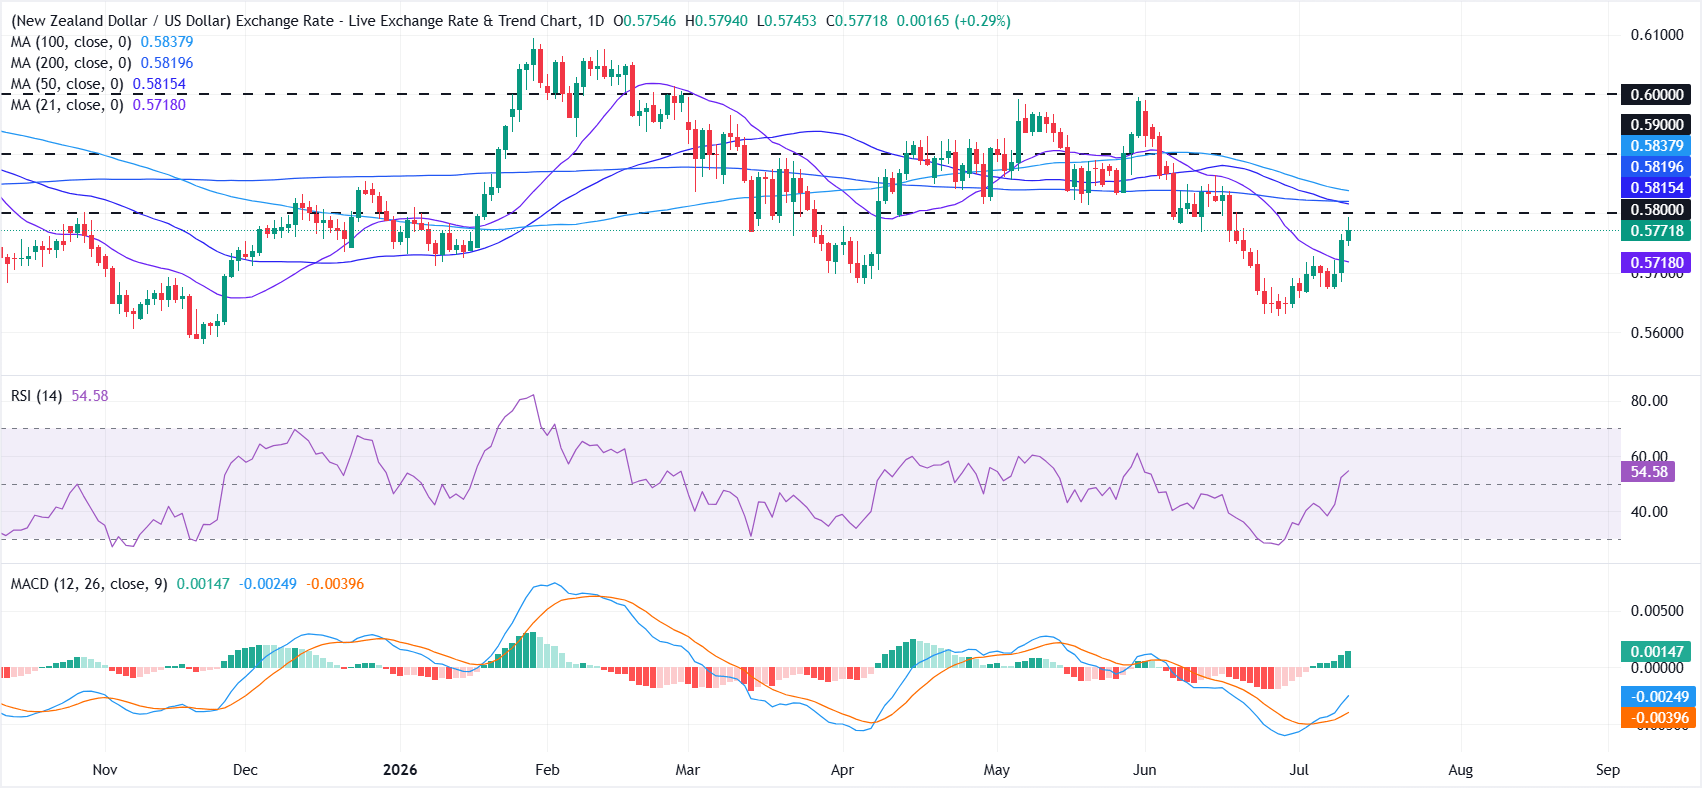
From a technical perspective, NZD/USD has been recovering after bottoming at 0.5626 in late June, its lowest level since November 2025. The latest leg higher pushed NZD/USD above the 21-day Simple Moving Average (SMA) at 0.5717, reinforcing the bullish near-term outlook.
Momentum has also improved, with the Relative Strength Index (RSI) climbing above the neutral 50 threshold after recovering from near-oversold territory. Meanwhile, the Moving Average Convergence Divergence (MACD) histogram remains in positive territory, suggesting bearish momentum is fading rather than confirming a sustained bullish reversal, as NZD/USD continues to trade below a cluster of key moving averages.
On the topside, initial resistance emerges at the psychological 0.5800 mark, closely aligning with the 50-day Simple Moving Average (SMA) at 0.5815, followed by the 200-day SMA at 0.5820 and the 100-day SMA at 0.5838.
A decisive break above these levels could pave the way for a move toward the horizontal resistance levels at 0.5900 and 0.6000.
On the downside, immediate support lies at the 21-day SMA at 0.5718. A move back below this level would weaken the near-term bullish bias and bring the late-June low of 0.5626 back into focus.
New Zealand Dollar Price Today
The table below shows the percentage change of New Zealand Dollar (NZD) against listed major currencies today. New Zealand Dollar was the strongest against the US Dollar.
| USD | EUR | GBP | JPY | CAD | AUD | NZD | CHF | |
|---|---|---|---|---|---|---|---|---|
| USD | -0.06% | -0.09% | -0.66% | -0.24% | -0.26% | -0.30% | -0.06% | |
| EUR | 0.06% | -0.03% | -0.55% | -0.18% | -0.21% | -0.25% | 0.00% | |
| GBP | 0.09% | 0.03% | -0.54% | -0.15% | -0.18% | -0.21% | 0.02% | |
| JPY | 0.66% | 0.55% | 0.54% | 0.41% | 0.39% | 0.32% | 0.57% | |
| CAD | 0.24% | 0.18% | 0.15% | -0.41% | -0.03% | -0.07% | 0.17% | |
| AUD | 0.26% | 0.21% | 0.18% | -0.39% | 0.03% | -0.05% | 0.17% | |
| NZD | 0.30% | 0.25% | 0.21% | -0.32% | 0.07% | 0.05% | 0.23% | |
| CHF | 0.06% | -0.01% | -0.02% | -0.57% | -0.17% | -0.17% | -0.23% |
The heat map shows percentage changes of major currencies against each other. The base currency is picked from the left column, while the quote currency is picked from the top row. For example, if you pick the New Zealand Dollar from the left column and move along the horizontal line to the US Dollar, the percentage change displayed in the box will represent NZD (base)/USD (quote).














