

Pyth Network Price Forecast: PYTH gains momentum amid extended Coinbase support
- Pyth Network is up nearly 5% on Thursday, extending gains toward the $0.05000 psychological threshold.
- Pyth Network extends price feeds support for SK Hynix and Lumentum perpetual futures on Coinbase.
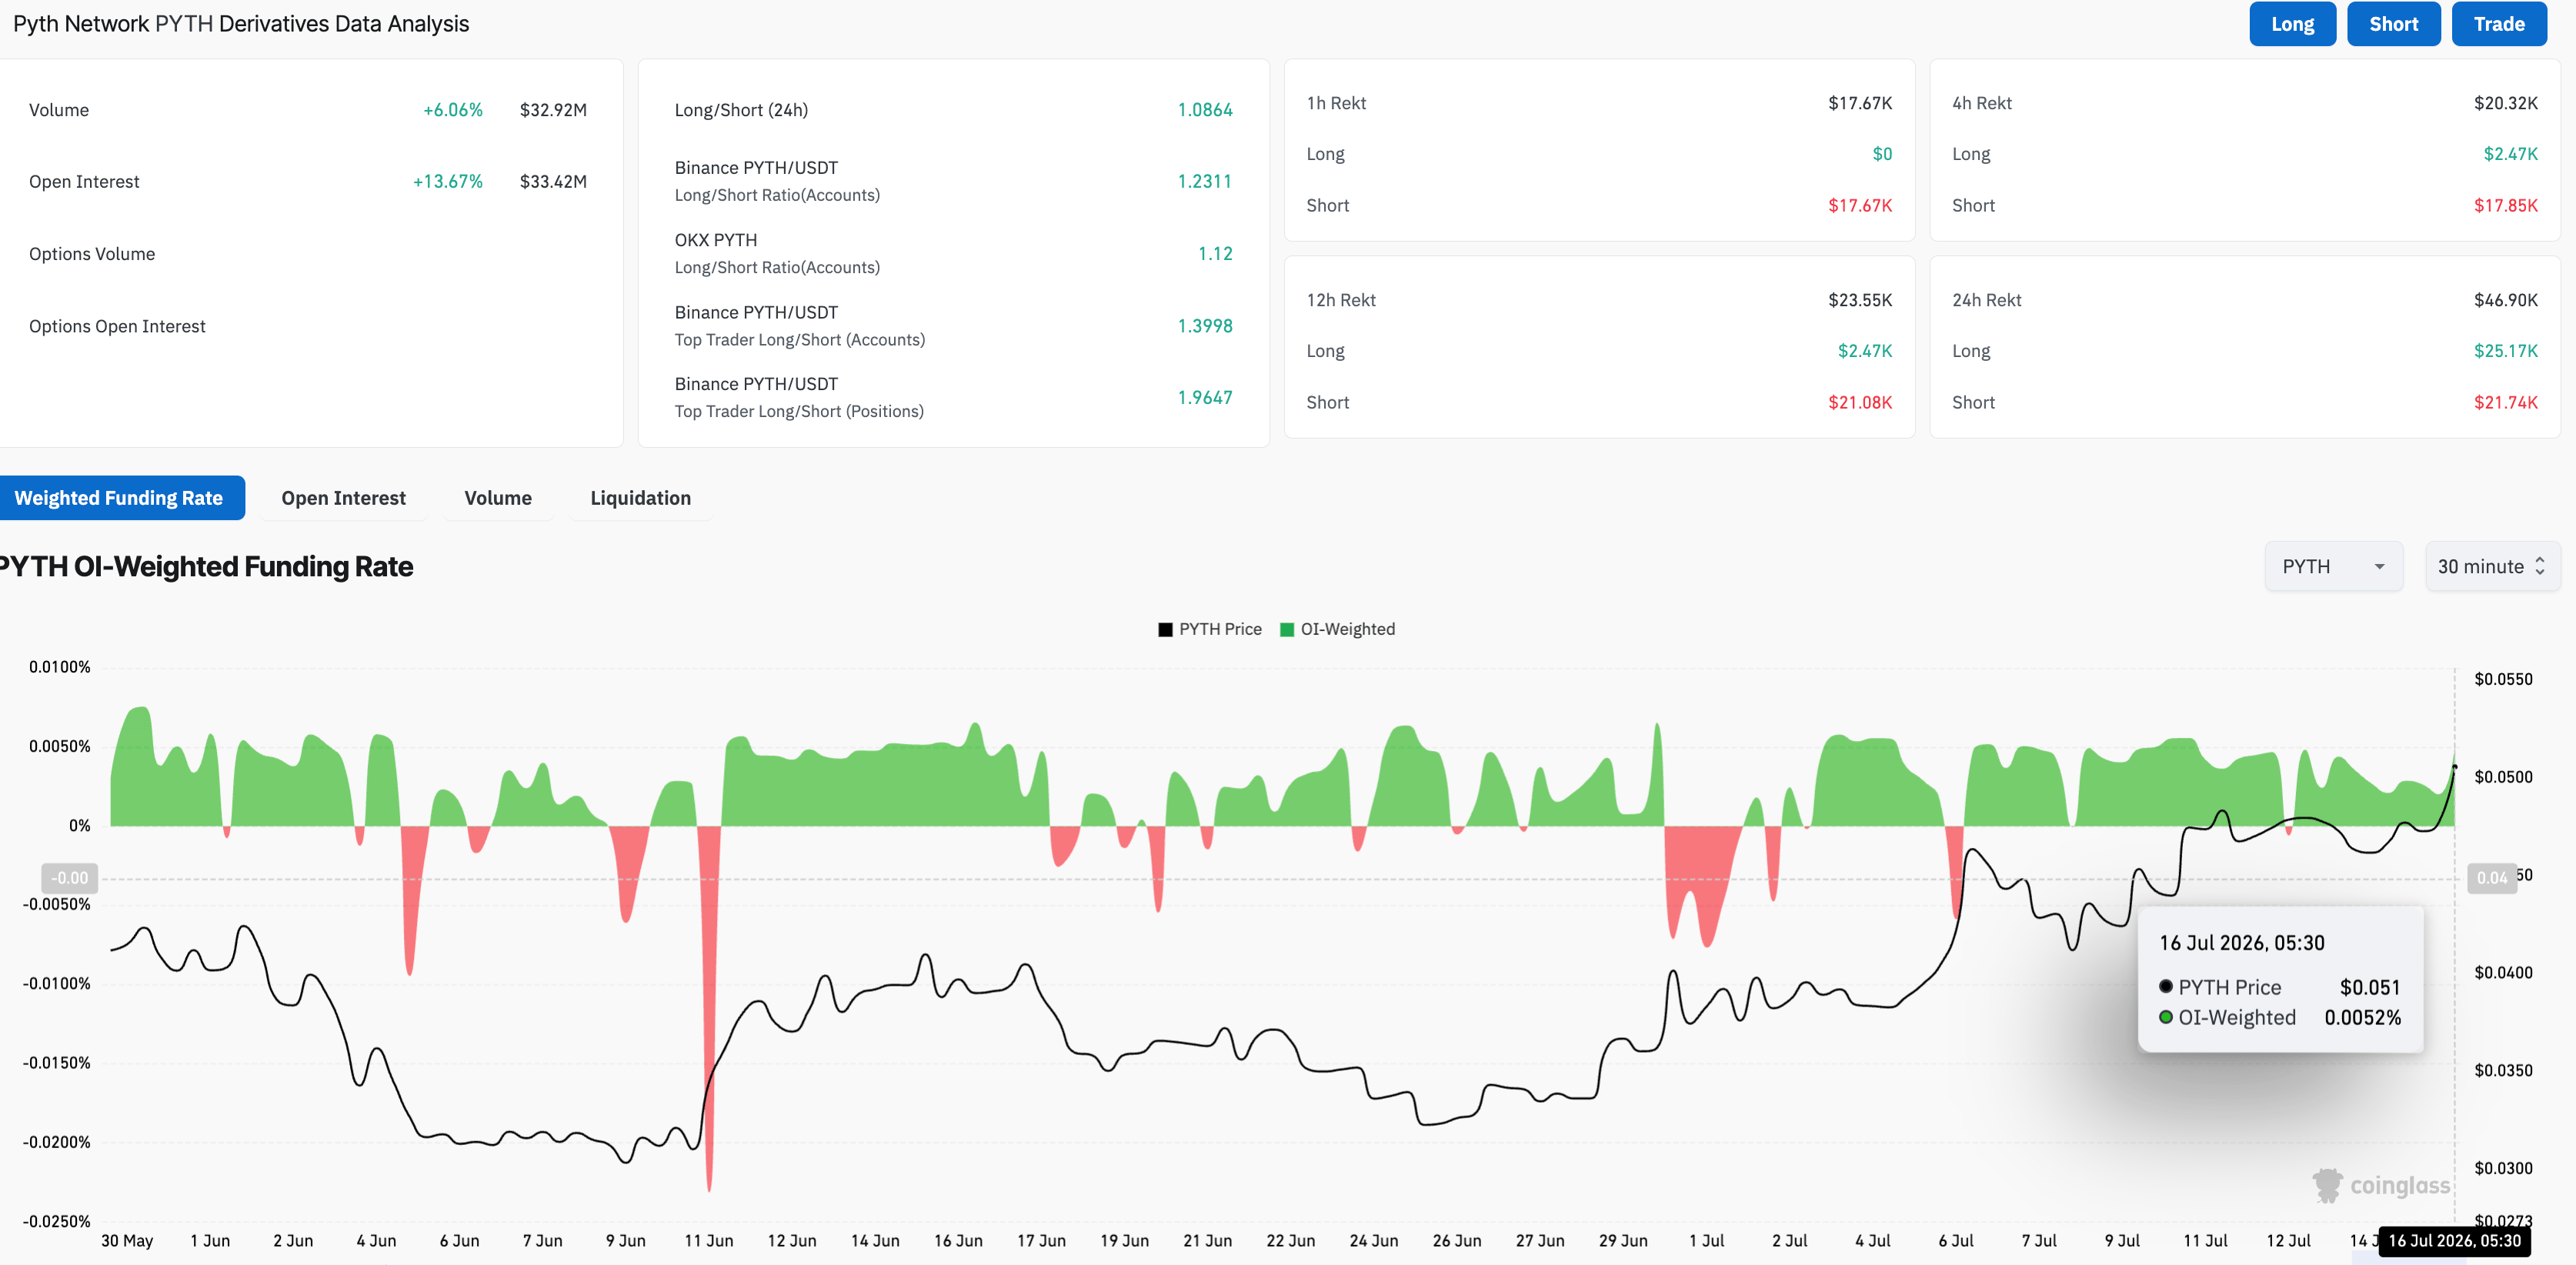
- PYTH gains retail support as increased activity drives an upsurge in Open Interest and the funding rate.
Pyth Network (PYTH) recovers nearly 5% on Thursday, approaching the $0.05000 psychological mark. The Wednesday release of SK Hynix and Lumentum perpetual futures on Coinbase, powered by Pyth Network, lifts retail demand. Double-digit gains in LYTH futures Open Interest, amid rising activity and funding rates, reflect a bullish speculative bias.

Pyth Network gains retail support amid extended price feeds on Coinbase Perpetuals
Pyth Network regains retail strength with extended price-feed support for recently trending SK Hynix and Lumentum stocks on Coinbase for perpetual contracts. CoinGlass data shows the PYTH futures Open Interest (OI) – notional value of active perpetuals contracts – has increased over 13% in the last 24 hours, reaching $33.42 million. At the same time, the volume surged 6% to $32.92 million, implying increased trading activity led to positional buildup.
The funding rate of 0.0052%, up from 0.0020% the previous day, implies a bullish bias among traders willing to hold long positions at a premium.
Will PYTH price extend gains above $0.050?
Pyth Network trades around $0.05000 at press time on Thursday, maintaining a bullish near-term bias. Price sits above the 50- and 100-day Exponential Moving Averages (EMAs) at $0.04151 and $0.04348.
However, the pair is pressing into a tight resistance band, with the 78.6% Fibonacci retracement, measured from $0.06310 to $0.02950, at $0.05362 and the 200-day EMA at $0.05345 reinforcing the topside cap. A decisive close above this zone could target the previous swing high of $0.05362, where a breakout could confirm the bullish trend reversal.
Momentum remains constructive, with the Moving Average Convergence Divergence (MACD) line holding above its signal line with a mildly positive histogram, while the Relative Strength Index (RSI) at 70 signals overbought conditions that could slow additional gains.
On the downside, initial support emerges at the cluster around the 100-day EMA at $0.04348 and the 50% retracement level at $0.0463. Deeper pullbacks would likely find buyers near the 50-day EMA at $0.04151 and the 23.6% level at $0.03529.
(The technical analysis of this story was written with the help of an AI tool. Know more.)














