
Ripple Price Forecast: XRP attempts rebound amid constrained risk appetite, rising exchange reserves
Ni John Isige
Petsa ng Pag-publish: 20 Mar 2026 | Petsa ng Pag-edit: 20 Mar 2026


Sikat na Artikulo

Ripple (XRP) is exhibiting stability above its daily open at $1.45 at the time of writing on Friday.
- XRP holds above Friday’s open at $1.45 as the broader crypto market stabilizes amid heightened volatility.
- XRP faces capital flight amid cooling derivatives demand and muted ETF activity.
- The spike in exchange reserves to 2.8 billion XRP may limit recovery potential if investors sell.
Ripple (XRP) is exhibiting stability above its daily open at $1.45 at the time of writing on Friday. The remittance token appears to be moving alongside the broader cryptocurrency market, which has been experiencing bearish pressure since Tuesday due to Middle East war-related sentiment, while investors assess the Federal Reserve’s (Fed) hawkish tone on the possibility of rate cuts in 2026.
Investors in institutional and retail clusters are reacting by pulling capital, as seen with a weakening derivatives market. Meanwhile, XRP holders appear to be preparing to sell amid an influx of transfers to exchanges.
A steady recovery toward $1.50 would reinforce the recent nascent bullish tone. However, a continued correction below the pivotal $1.40 level could reinforce the overall bearish trend.
XRP under pressure amid capital exit
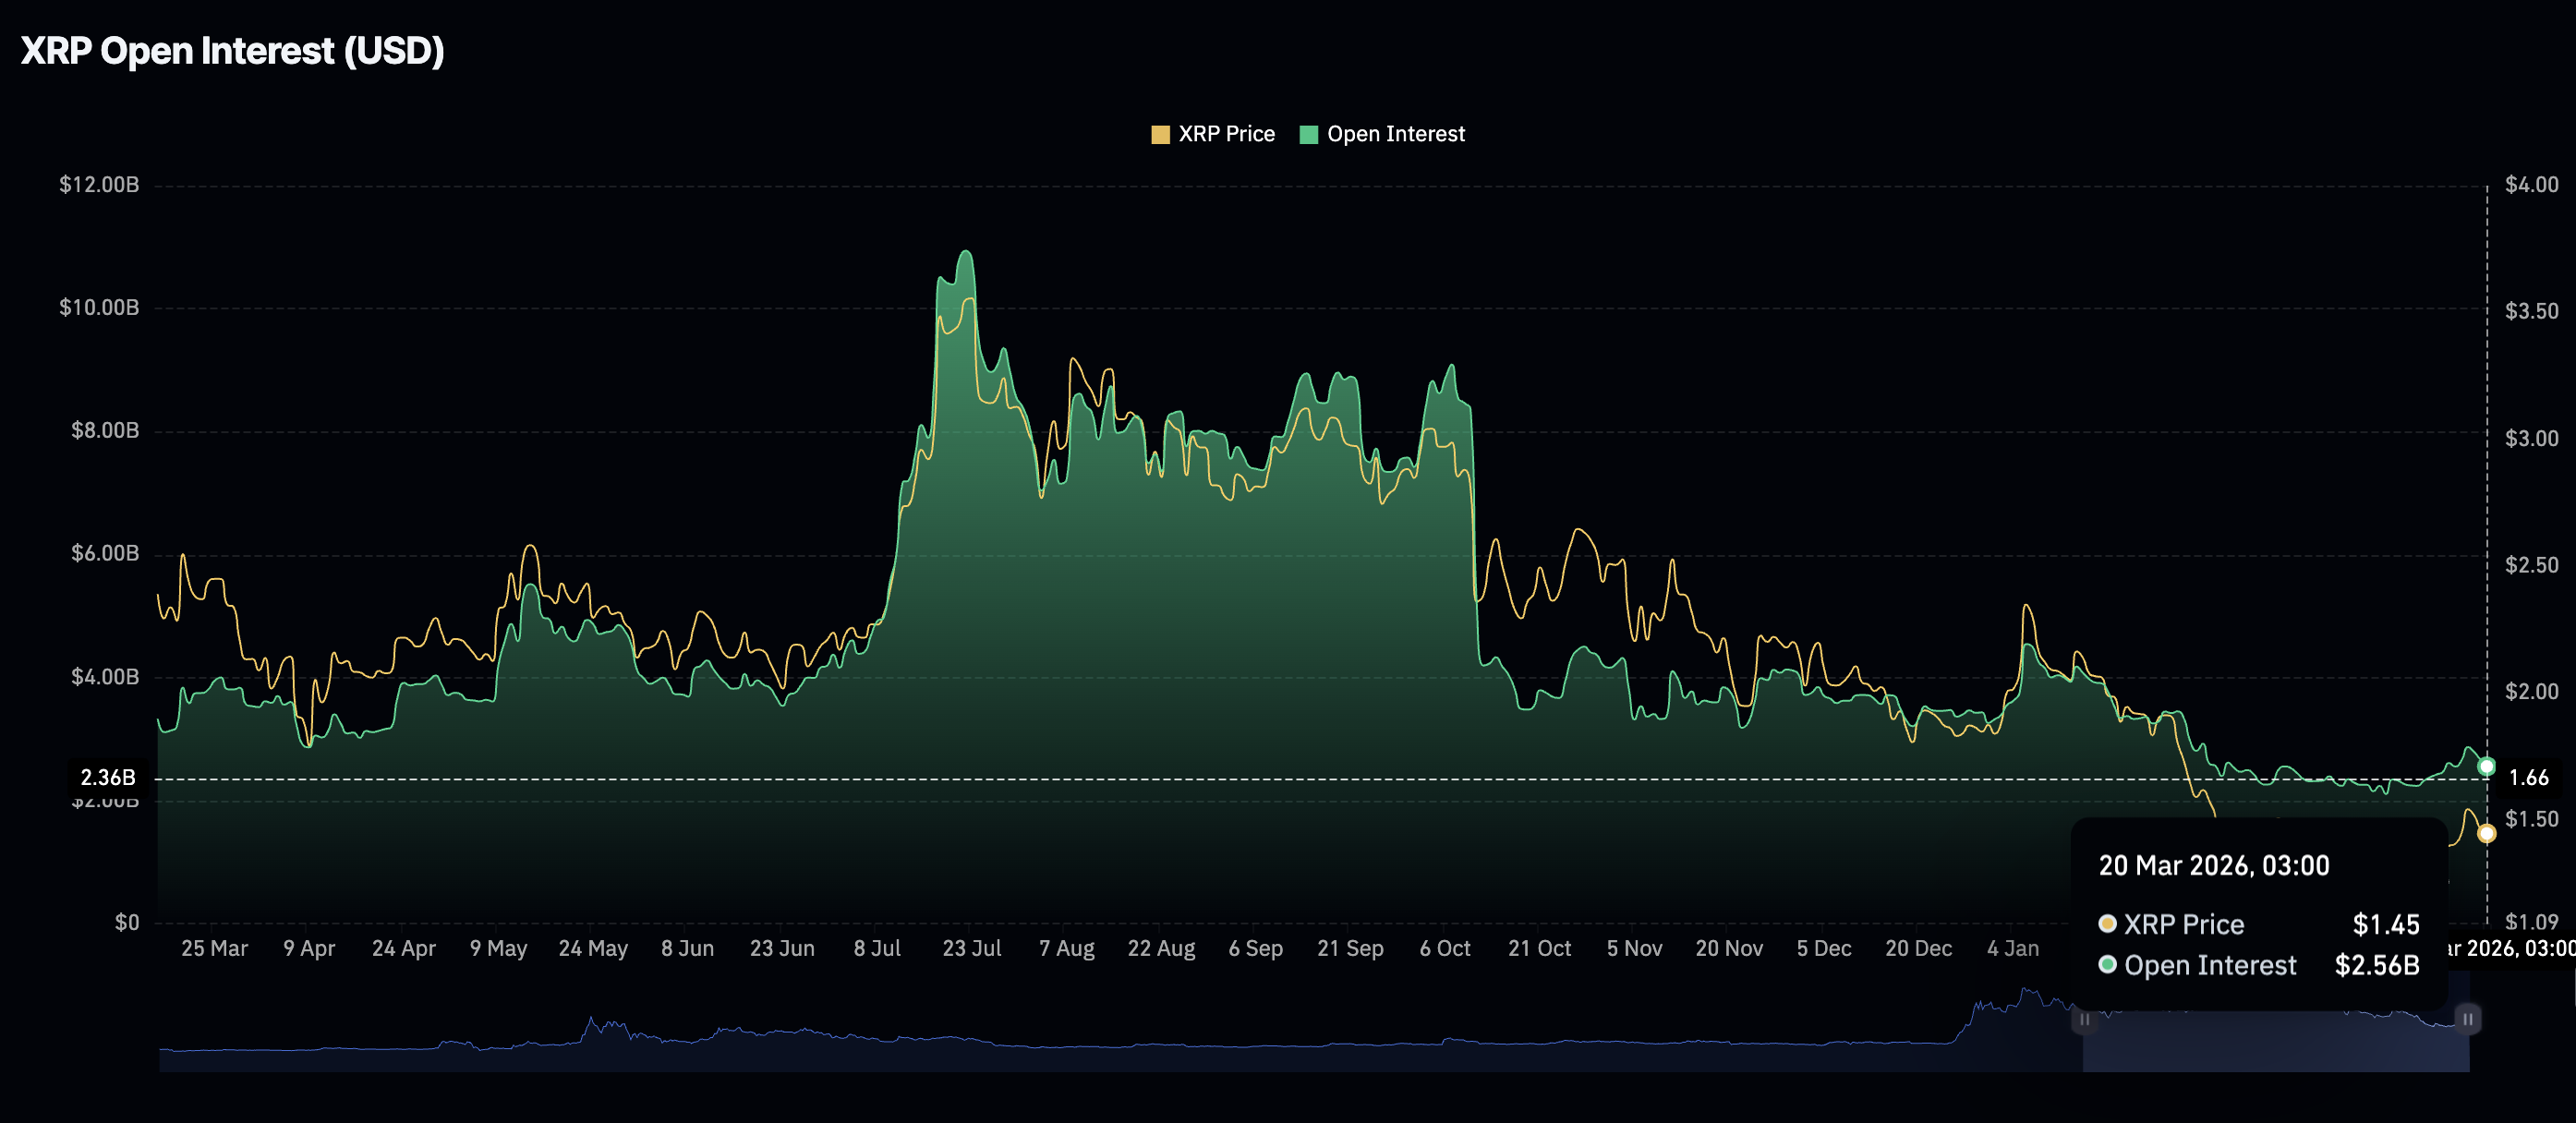
Retail demand for XRP derivatives has slowed over the past few days, as reflected by futures Open Interest (OI) narrowing to $2.56 billion on Friday, from $2.67 billion the previous day.
CoinGlass data shows that OI peaked at $2.87 billion this week, up from $2.11 on March. This increase coincided with XRP rising to $1.61 on Tuesday, only to be capped by headwinds.
A steady increase in derivatives is required to sustain the uptrend, while persistent declines often indicate a lack of confidence in the token’s ability to sustain the recovery.
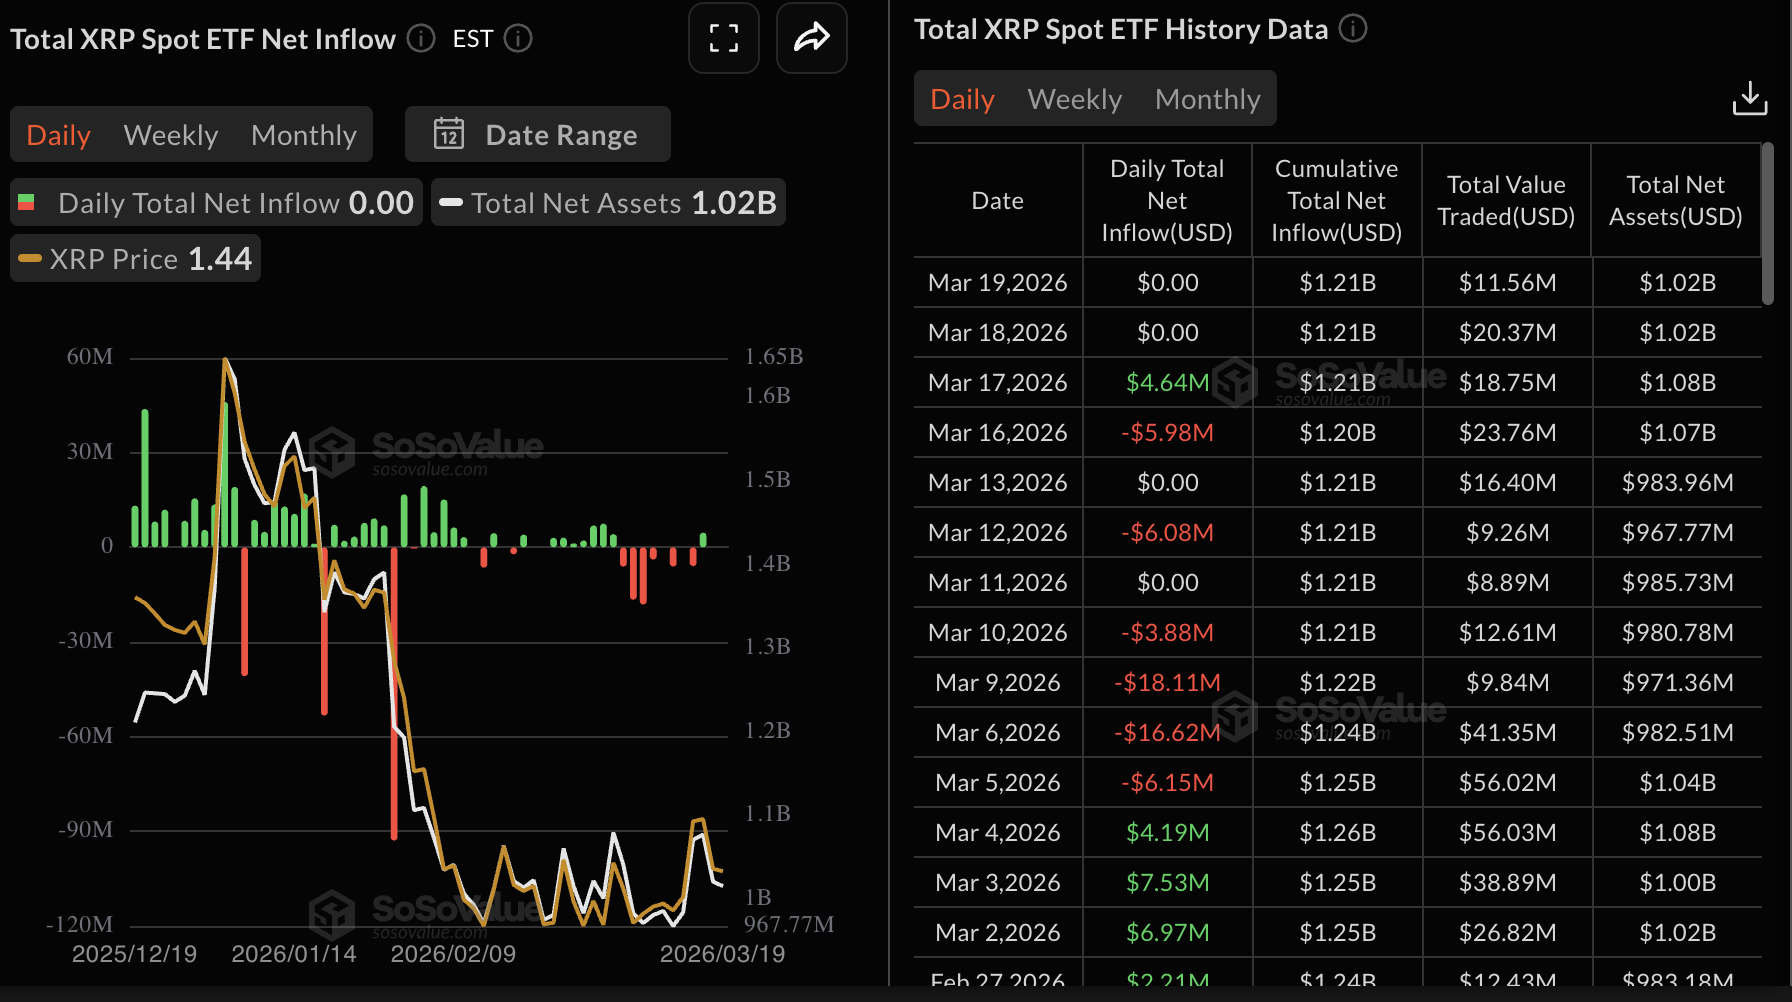
Meanwhile, activity in XRP spot ETFs remained muted on Thursday and Wednesday, with zero flows recorded, according to SoSoValue data. Cumulative inflows hold at $1.21 billion with net assets under management averaging $1.02 billion. Muted activity undermines institutional interest in XRP, potentially weakening sentiment and delaying price recovery.
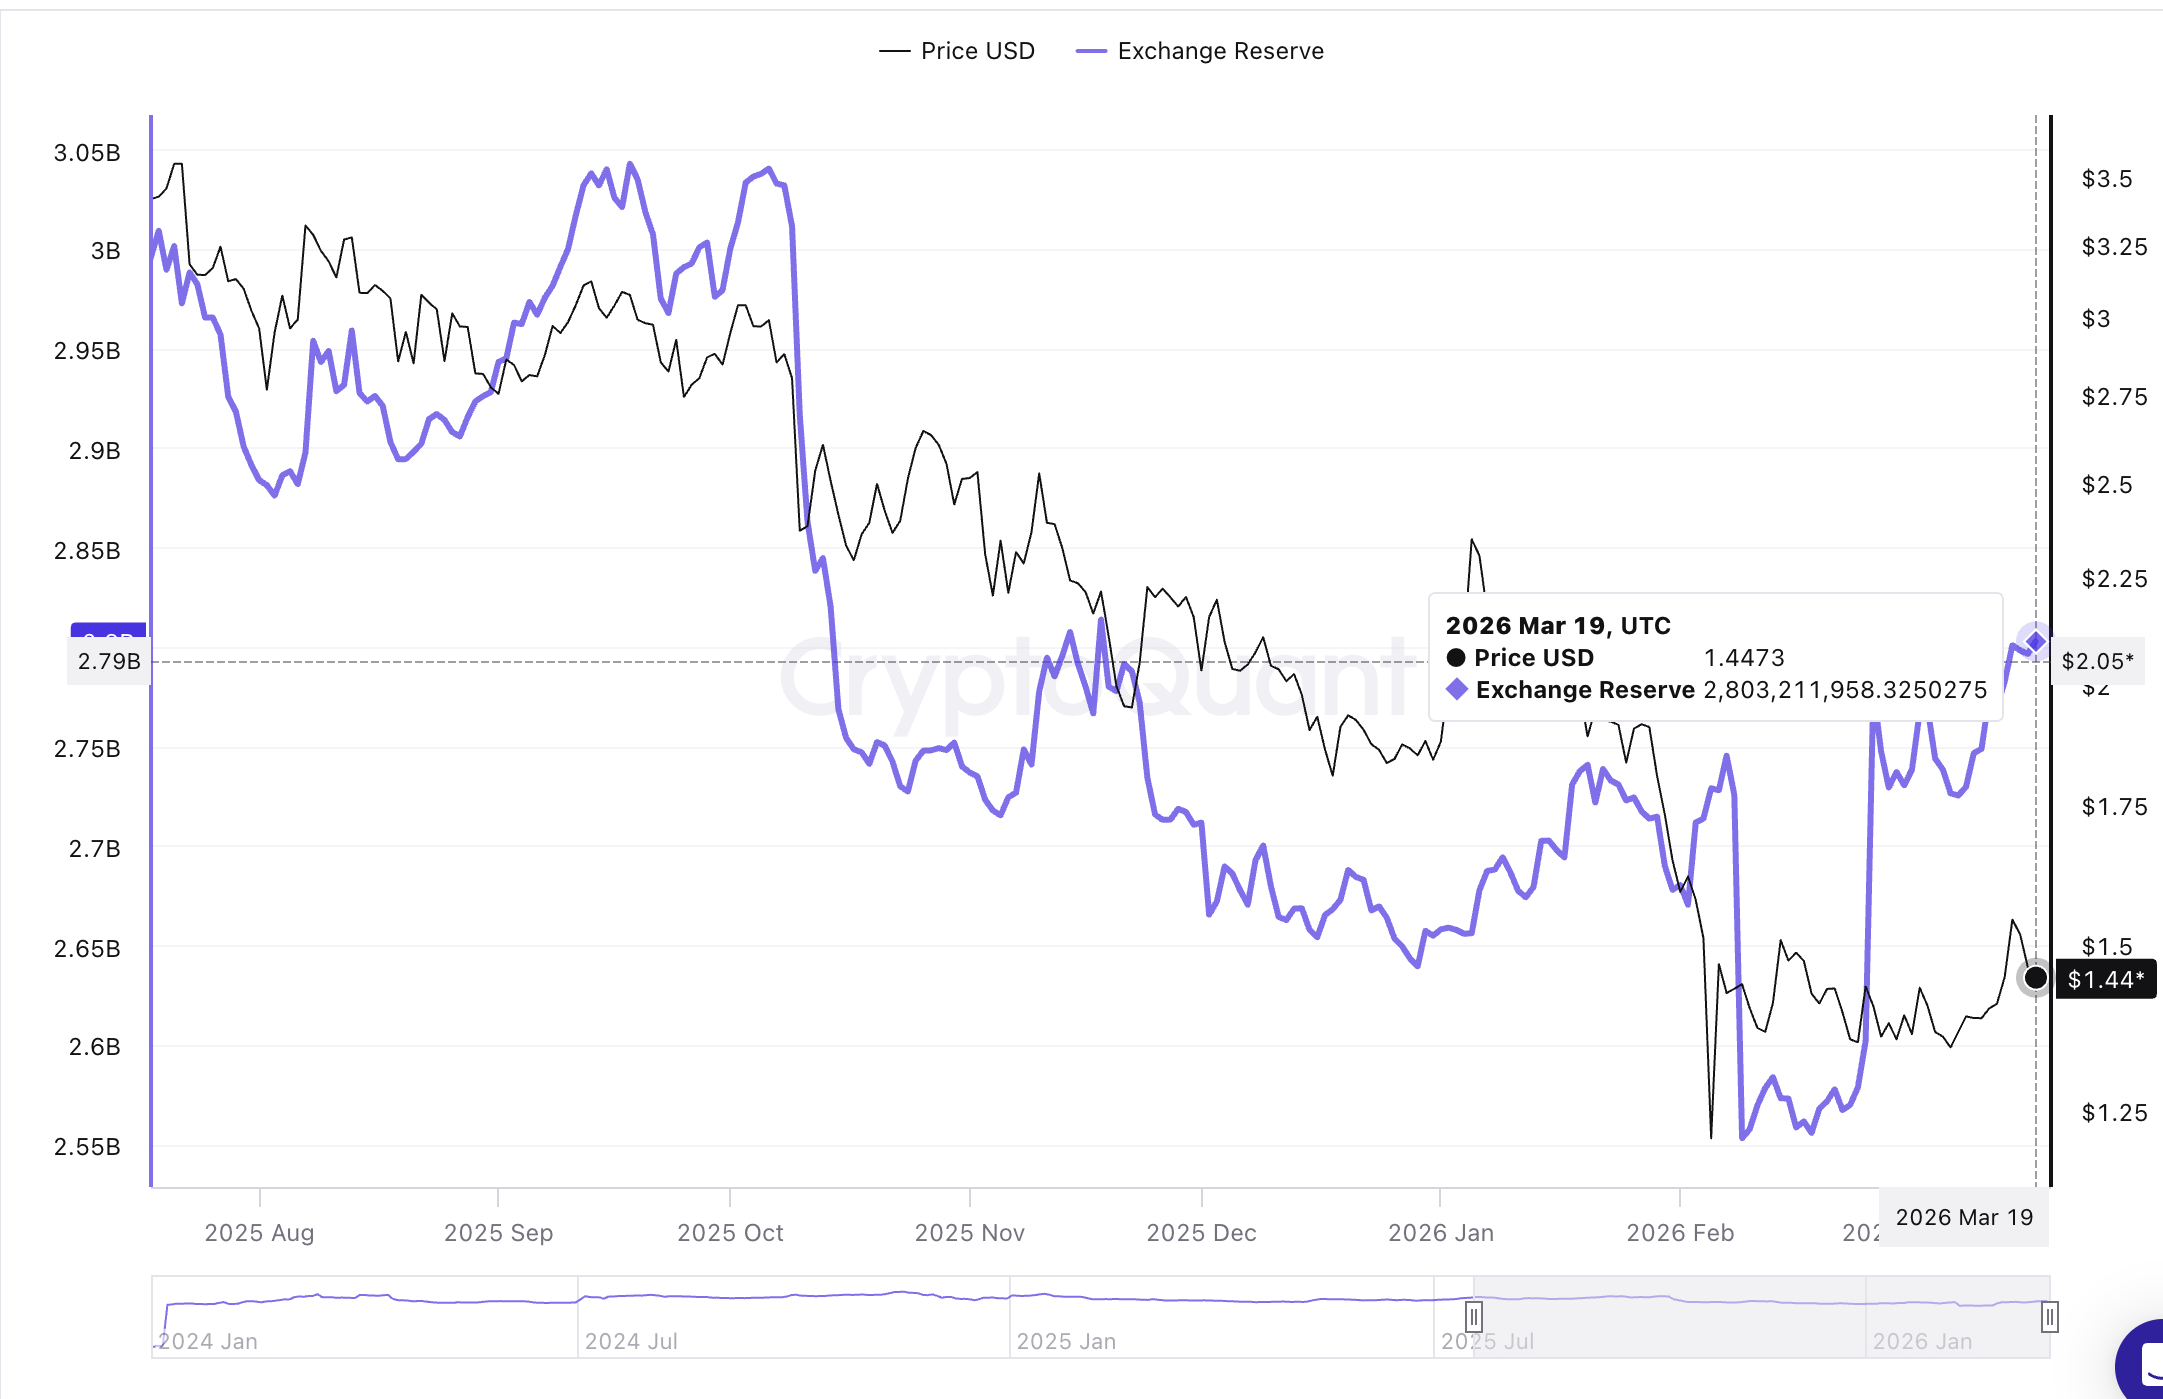
At the same time, holders of XRP are increasingly transferring their assets to exchanges, which poses a significant risk to the near- and medium-term bullish outlook. Exchange reserves have increased, exceeding 2.8 billion XRP as of Thursday, from 2.74 billion XRP on March 1.
Looking back, the balance on exchanges averaged 2.55 billion XRP in February, which also marked a yearly low. Rising exchange reserves often put recoveries at risk by increasing the available supply for sale. The pattern also reflects a lack of confidence in XRP’s potential for a sustained recovery in the short- to medium-term.
Technical outlook: XRP steadies above support, but rebound remains weak
XRP is trading above $1.45, up slightly from the daily open. The near-term bias is neutral, with a mild upside tilt, after the token rebounded from Thursday's low at $1.42, but it remains capped well below the long-standing descending resistance trend line, which remains unbroken since July.
At the same time, XRP holds below the clustered 50-day, 100-day, and 200-day Exponential Moving Averages (EMAs) between roughly $1.50 and $1.95, underscoring that the broader trend remains bearish despite the measured bounce.
Still, the Moving Average Convergence Divergence (MACD) indicator is in positive territory and above its signal on the daily chart. Modestly contracting histogram bars, while the Relative Strength Index (RSI) around 52 stabilizes on the same chart, suggest that downside momentum is fading and short-term dip-buying interest is emerging.
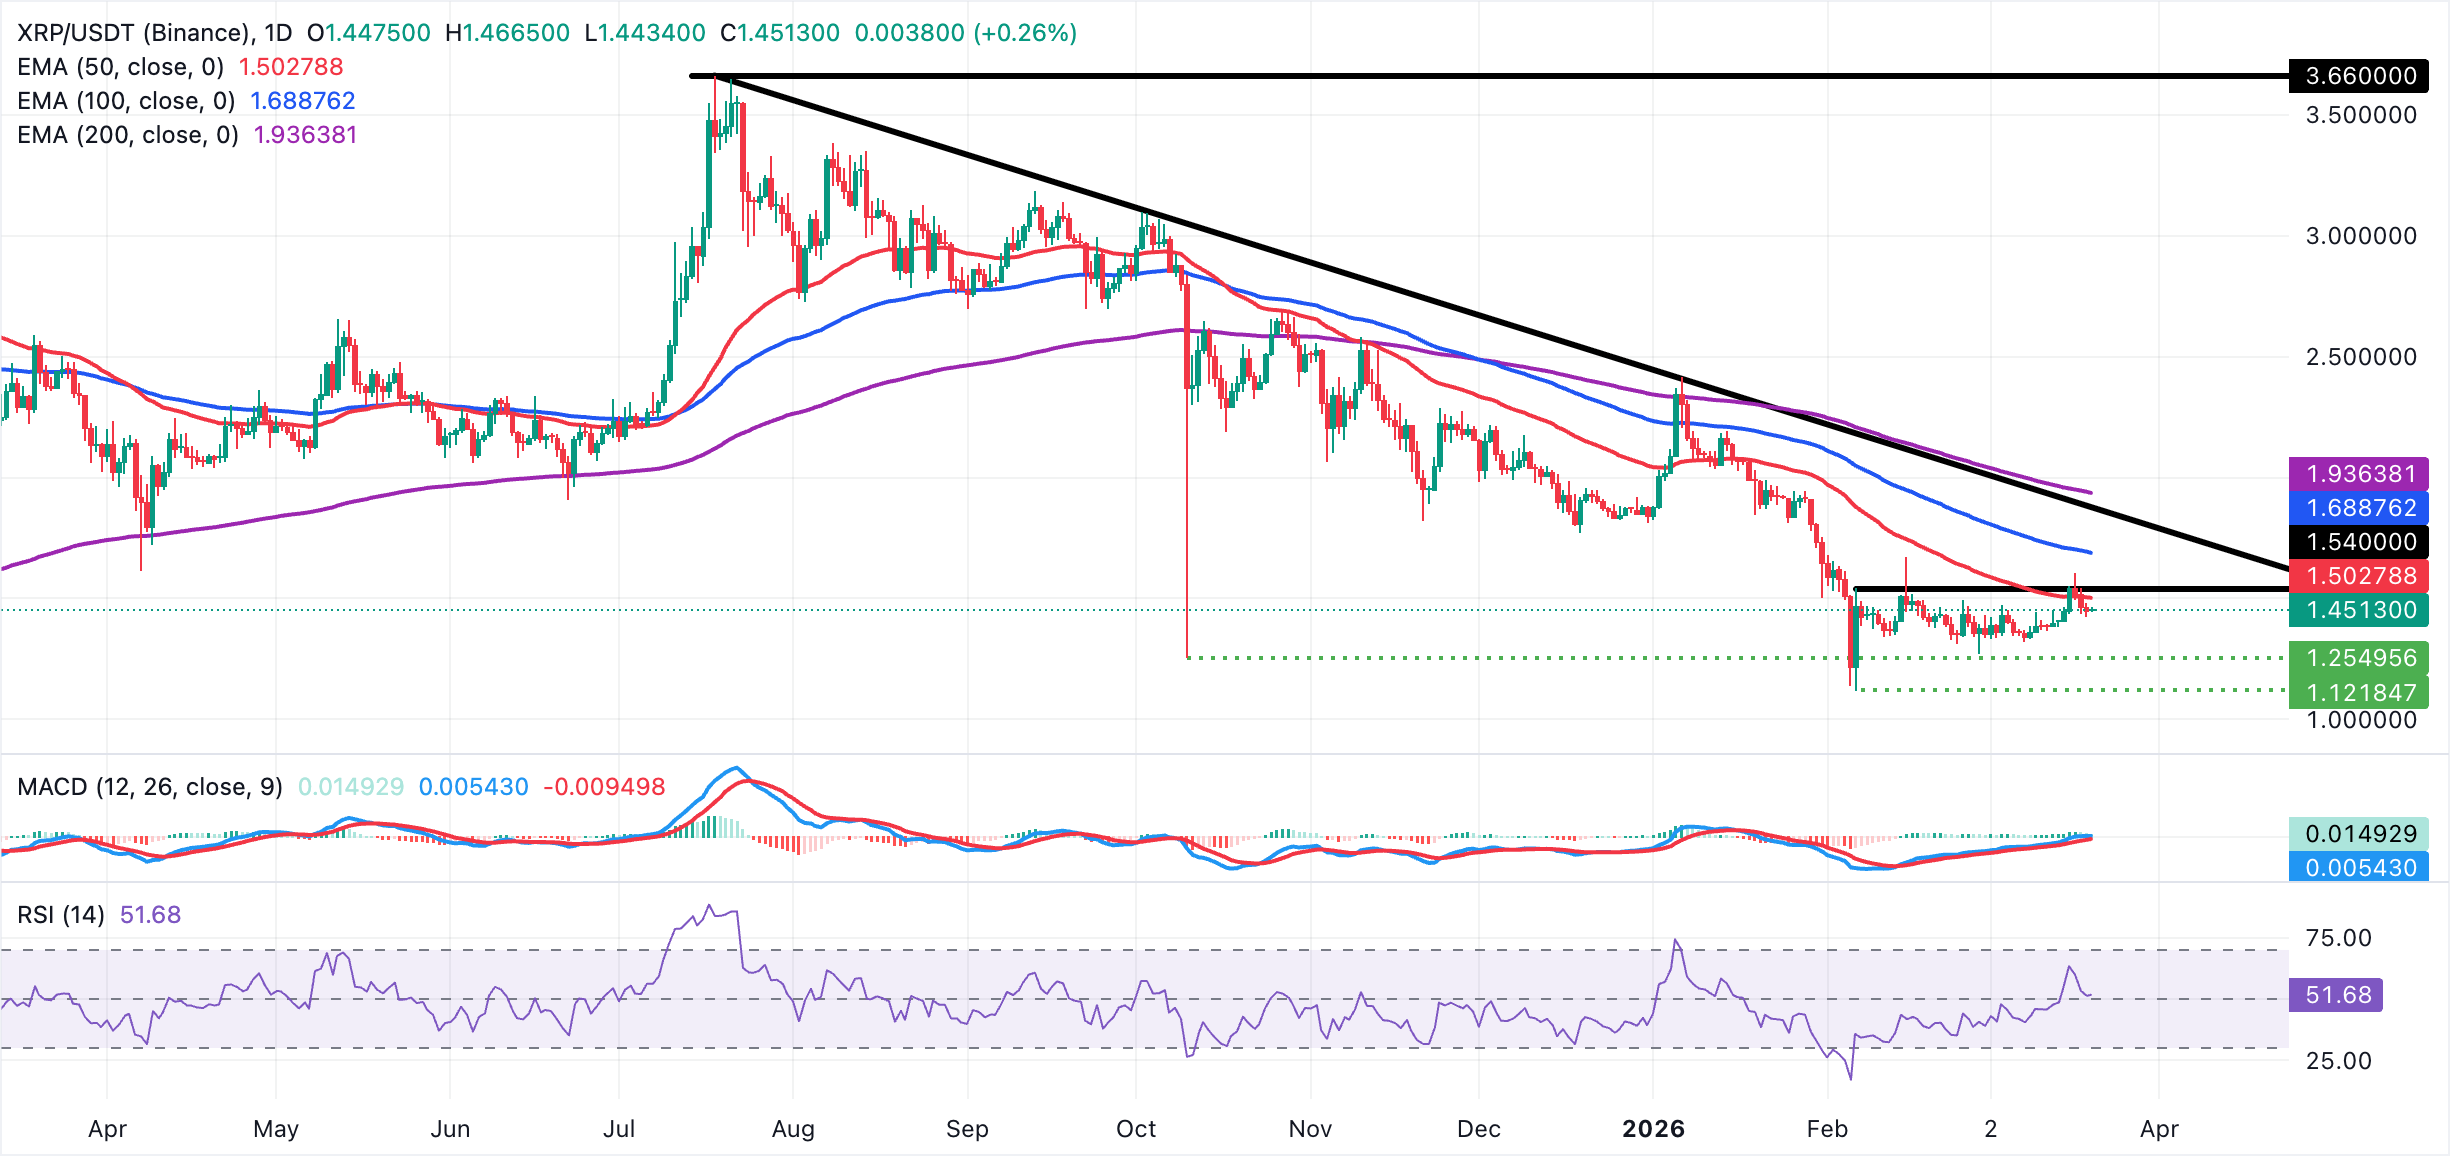
Initial support lies at the recent reaction lows near $1.42, followed by the $1.40 area, where prior demand emerged. Failure to defend this level as support would reopen a deeper slide within the dominant downtrend. On the topside, initial resistance aligns with the 50-day EMA at $1.50, and a sustained break above this level would expose the weekly high at $1.61 and then the 100-day EMA at $1.69.
Cryptocurrency metrics FAQs
The developer or creator of each cryptocurrency decides on the total number of tokens that can be minted or issued. Only a certain number of these assets can be minted by mining, staking or other mechanisms. This is defined by the algorithm of the underlying blockchain technology. On the other hand, circulating supply can also be decreased via actions such as burning tokens, or mistakenly sending assets to addresses of other incompatible blockchains.
Market capitalization is the result of multiplying the circulating supply of a certain asset by the asset’s current market value.
Trading volume refers to the total number of tokens for a specific asset that has been transacted or exchanged between buyers and sellers within set trading hours, for example, 24 hours. It is used to gauge market sentiment, this metric combines all volumes on centralized exchanges and decentralized exchanges. Increasing trading volume often denotes the demand for a certain asset as more people are buying and selling the cryptocurrency.
Funding rates are a concept designed to encourage traders to take positions and ensure perpetual contract prices match spot markets. It defines a mechanism by exchanges to ensure that future prices and index prices periodic payments regularly converge. When the funding rate is positive, the price of the perpetual contract is higher than the mark price. This means traders who are bullish and have opened long positions pay traders who are in short positions. On the other hand, a negative funding rate means perpetual prices are below the mark price, and hence traders with short positions pay traders who have opened long positions.
(The technical analysis of this story was written with the help of an AI tool.)

Higit sa isang milyong user ang umaasa sa FXStreet para sa real-time market data, charting tools, expert insights, at Forex news. Ang komprehensibong economic calendar at educational webinars nito ay tumutulong sa mga trader na manatiling may alam at gumawa ng kalkuladong mga desisyon. Sinusuportahan ang FXStreet ng humigit-kumulang 60 propesyonal sa pagitan ng Barcelona HQ at iba’t ibang rehiyon sa buong mundo.
Magbasa pa


