

Ripple Price Prediction: Is XRP worth a Dollar?
- XRP’s range-bound trading broadens after sliding below the pivotal $1.10 level.
- The return of spot ETF inflows and rising futures Open Interest fails to lift XRP’s short-term outlook.
- XRP is stuck within a broader bearish structure defined by a downward trending RSI.
Ripple (XRP) edges toward $1.00 at the time of writing on Friday, weighed down by broader risk-off sentiment in the cryptocurrency market. The decline comes after a short-lived macro-driven rally as inflation in the United States (US) showed signs of easing.

However, pressure has remained apparent as market participants continue to assess the impact of the persistent war between the United States (US) and Iran.
“If both parties fail to return to the negotiation table, the risk of further structural damage to energy infrastructure across the region remains high, threatening a prolonged Crude and distillate supply crunch and higher inflation,” Simon-Peter Massabni, Head of Business Development at XS.com, said.
XRP attracts modest capital inflows
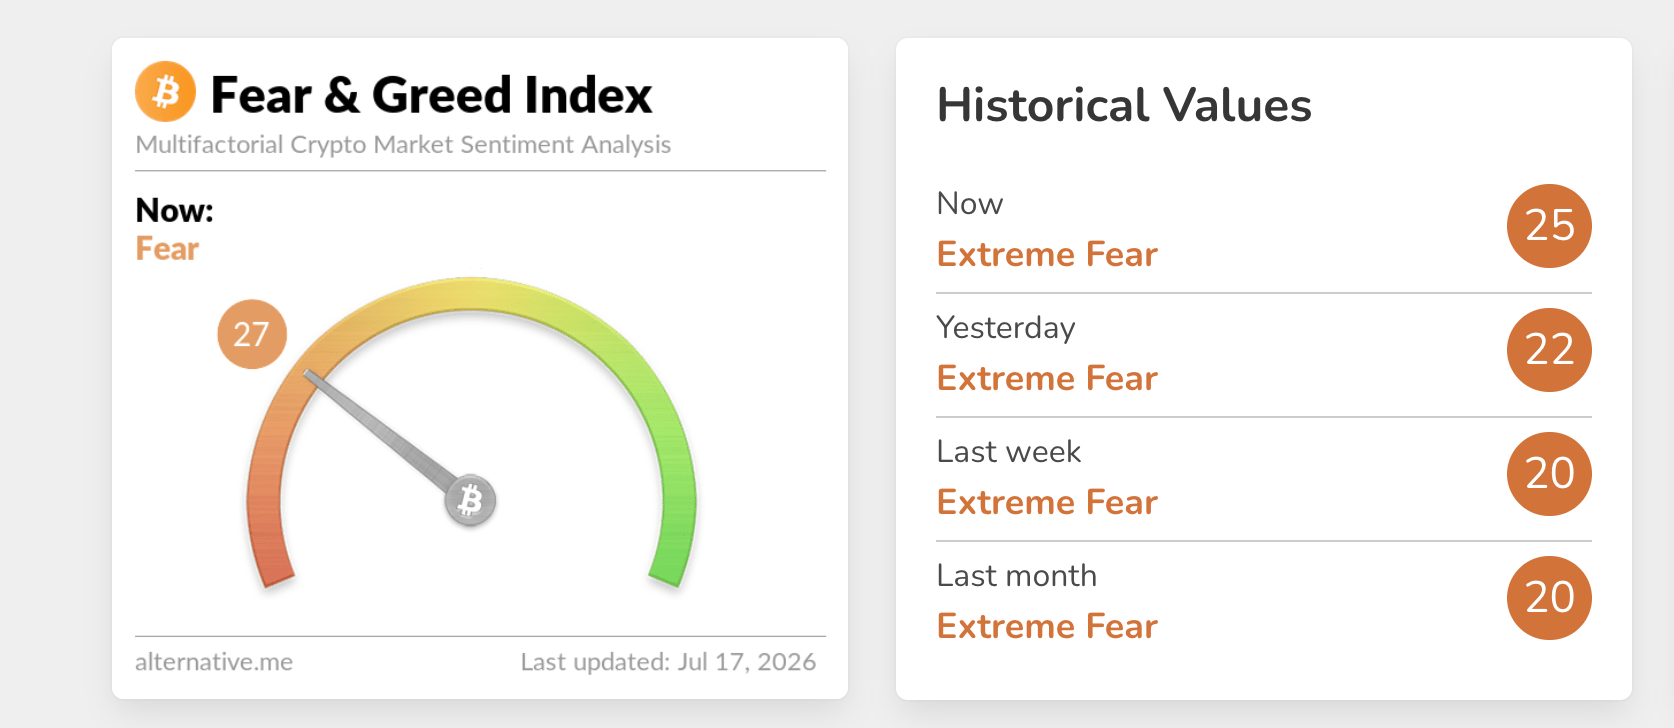
The crypto Fear & Greed Index is embedded in the Fear territory at 27 on Friday, marking a marginal improvement from 25 in the Extreme Fear territory the day before. This outlook indicates that appetite for risk assets is improving, albeit gradually, as evidenced by inflows into XRP digital investment products.
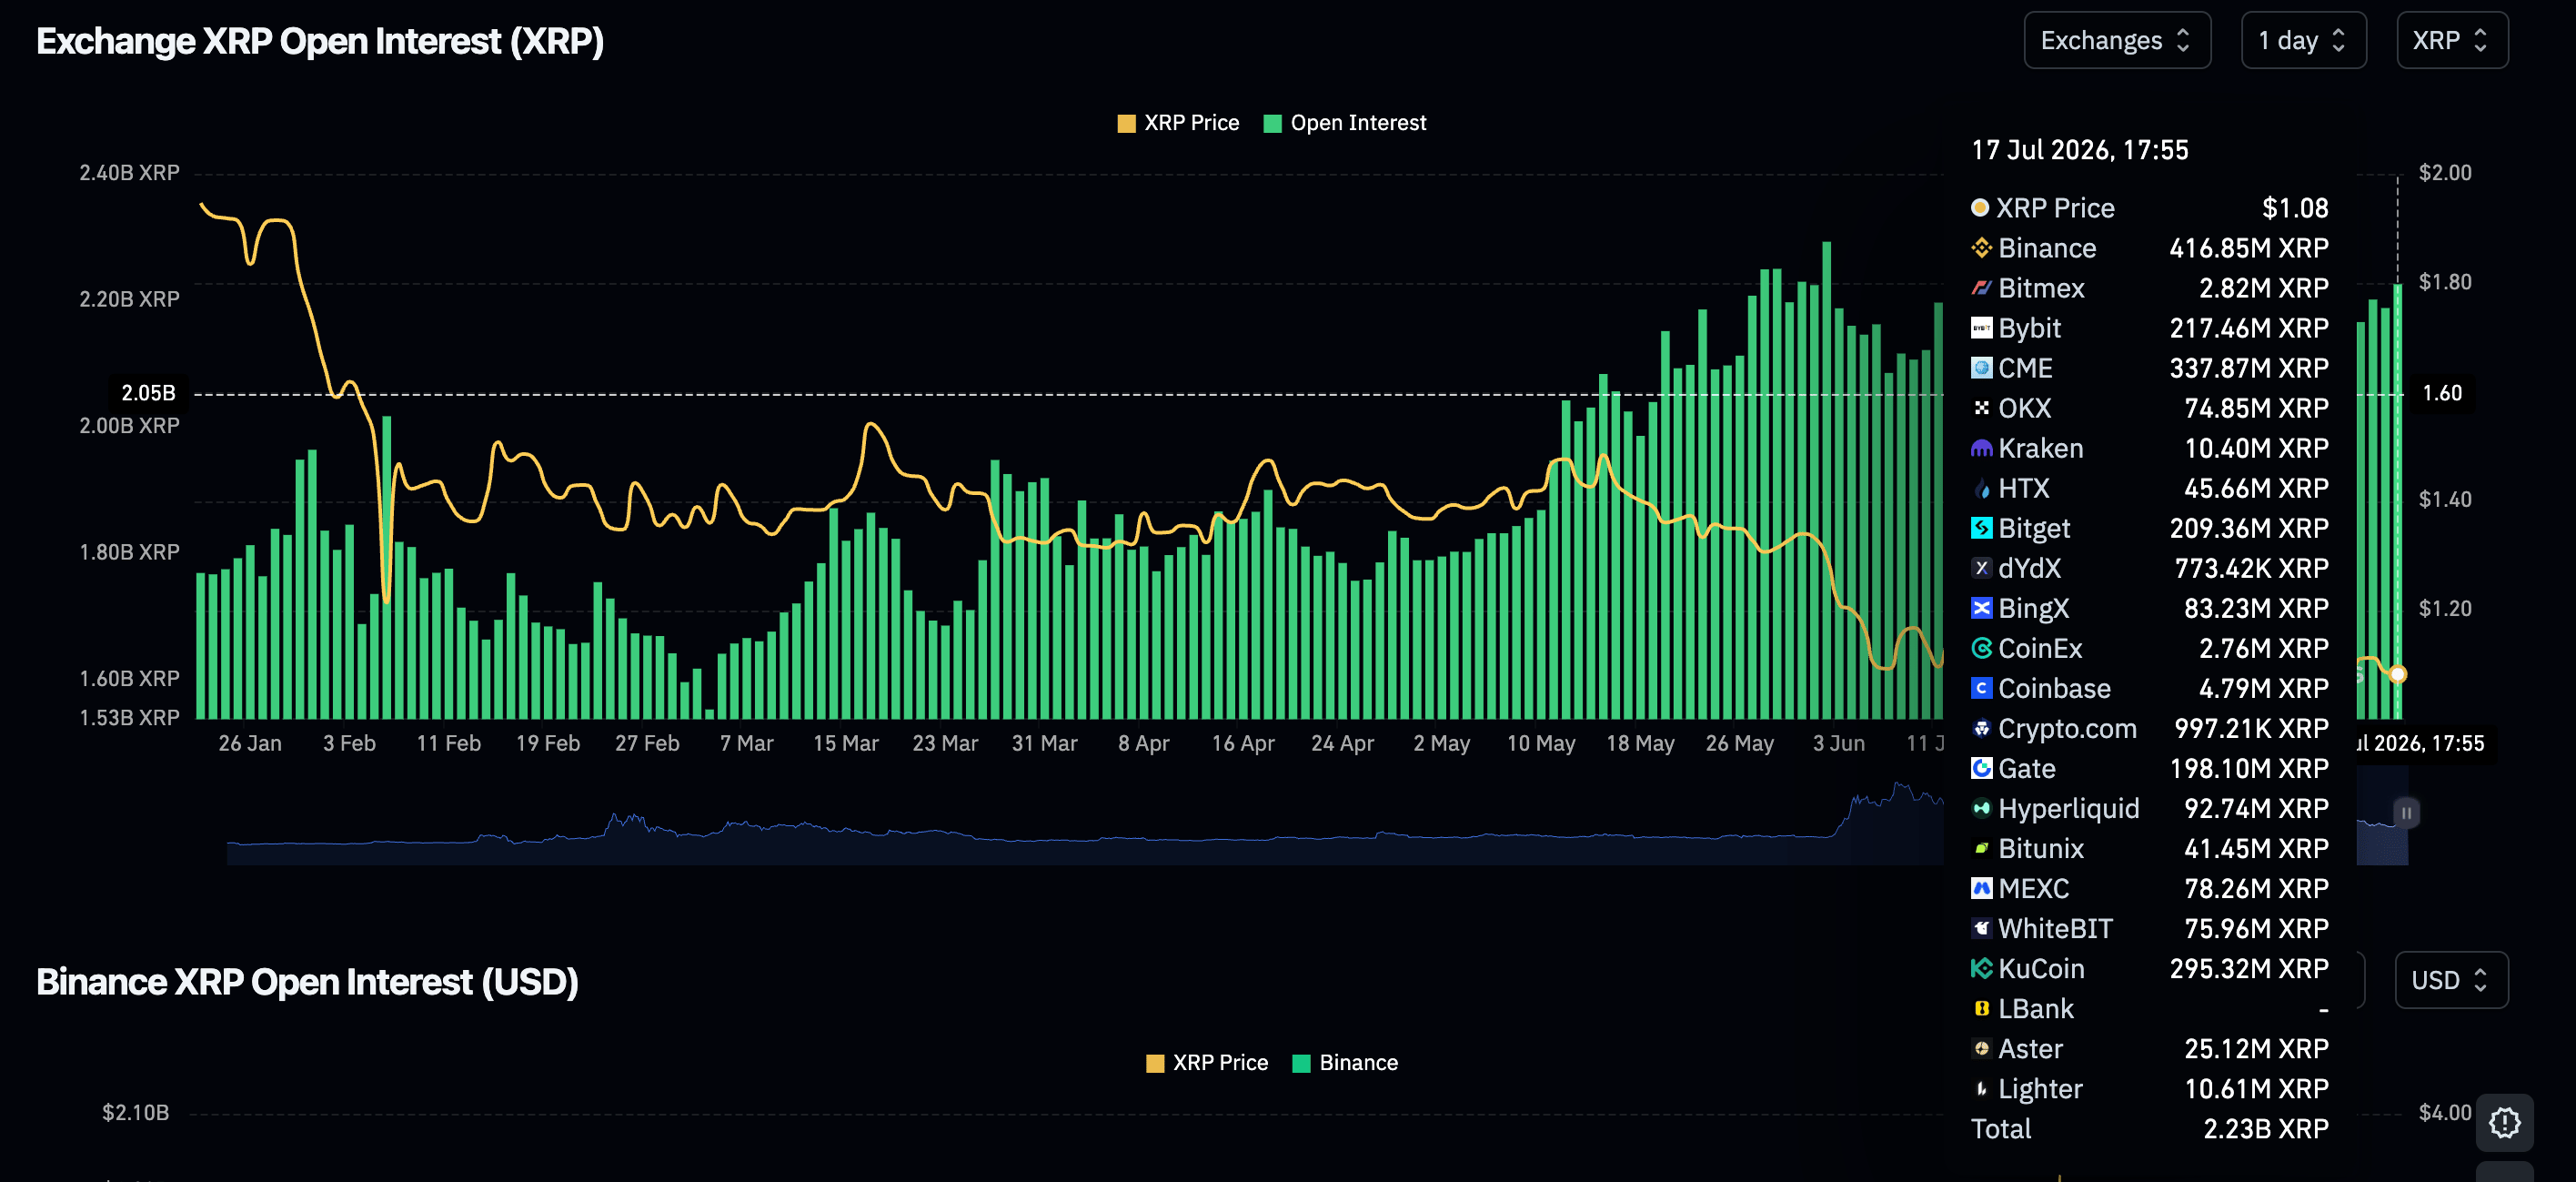
Demand for XRP derivatives has gradually increased this week, with the perpetual futures Open Interest (OI) averaging 2.23 billion XRP on Friday, up from 2.19 billion XRP the previous day. A broader scope shows OI averaged 2.1 billion XRP on Monday, underscoring steady growth in risk-on sentiment.
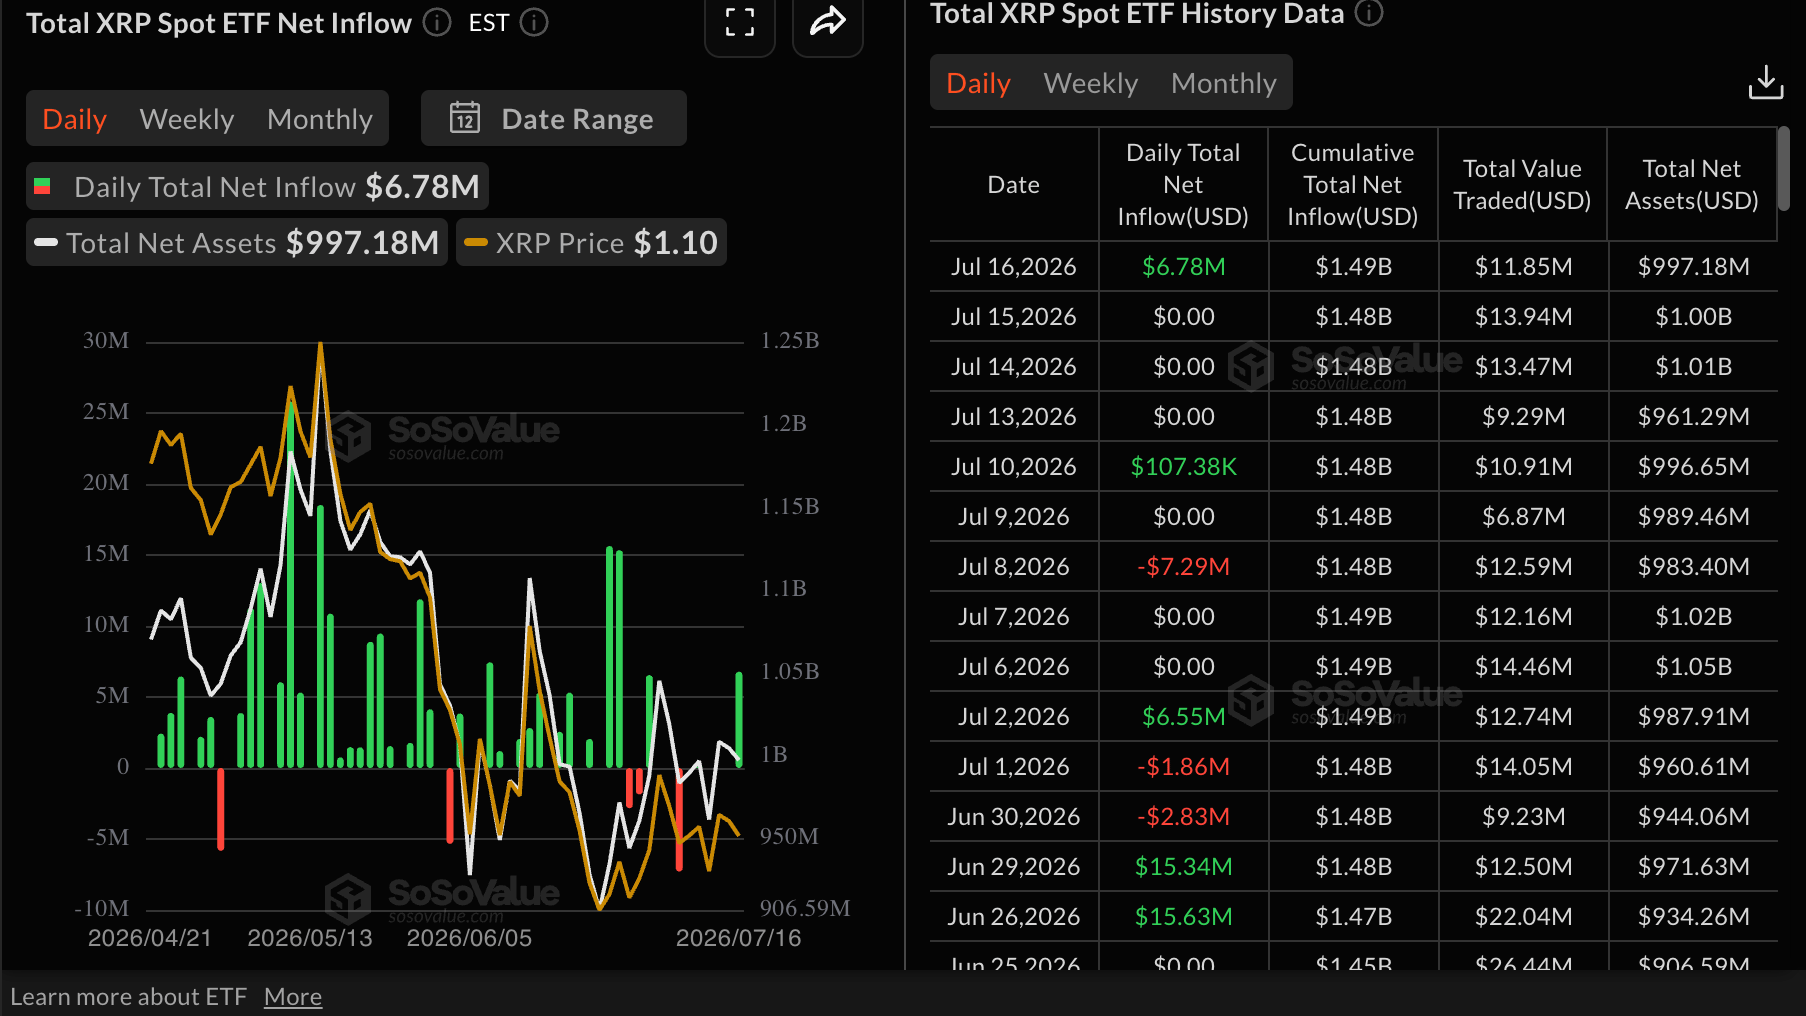
Meanwhile, demand for XRP spot ETFs returned on Thursday, attracting nearly $7 million in inflows, according to SoSoValue data. This positive turnaround comes after three days where activity remains muted.
Still, cumulative inflows edged higher to $1.49 billion, with net assets averaging $997 million. Sustained appetite for US-listed ETFs is needed to absorb the selling pressure in the spot market and support a steady rebound.
Price analysis: XRP remains pressured toward $1.00
XRP trades at $1.08, keeping a bearish near-term tone. The spot price holds below the 50-day, 100-day and 200-day Exponential Moving Averages (EMAs) at $1.15, $1.25 and $1.45, respectively. The pair also trades under the Bollinger Bands middle layer at $1.09, highlighting persistent overhead supply.
Moreover, the Moving Average Convergence Divergence (MACD) histogram remains marginally positive, hinting at only modest recovery attempts against a capped structure. The Relative Strength Index (RSI) near 44 stays below the midline, reinforcing a subdued bias and suggesting rallies could struggle to sustain beyond nearby resistance.
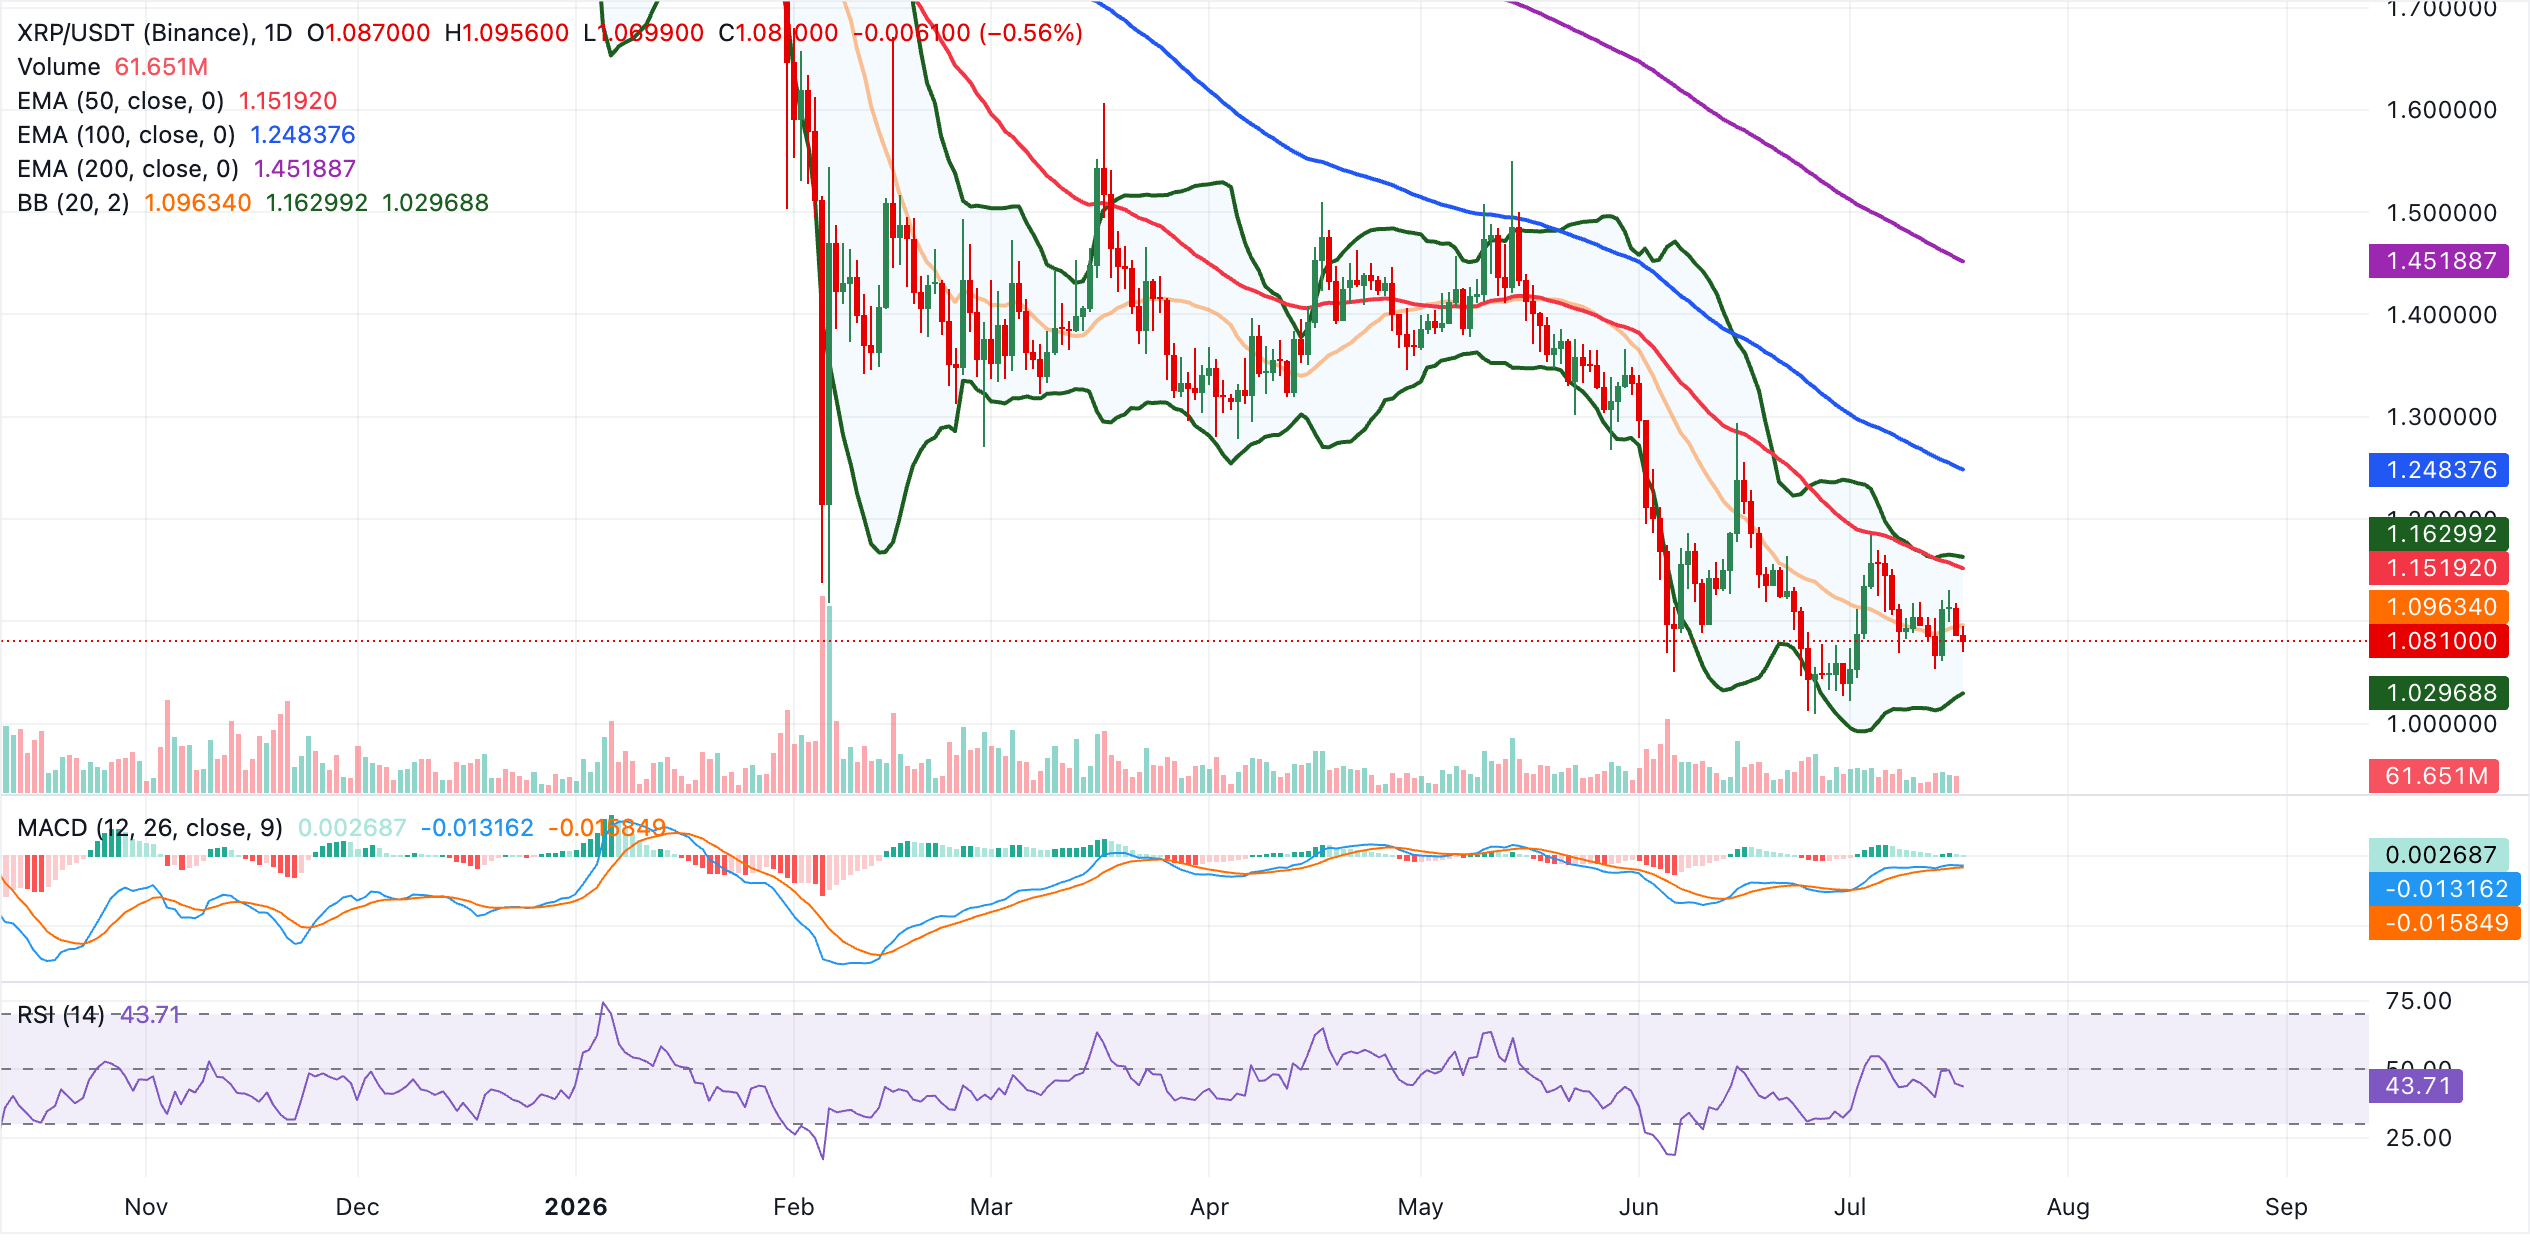
Initial resistance emerges at the Bollinger middle layer near $1.10, followed by the 50-day EMA at $1.15, with a stronger barrier at the Bollinger upper layer around $1.16. Above there, the 100-day EMA at $1.25 and the 200-day EMA at $1.45 outline a broader bearish framework and would need to be reclaimed to ease downside pressure.
Looking down, immediate support is provided by the Bollinger lower boundary at $1.03. A decisive break below this floor would open room for a deeper slide, whereas holding above it keeps scope for short-covering bounces back toward the $1.10 area.
(The technical analysis of this story was written with the help of an AI tool. Know more.)
Crypto ETF FAQs
An Exchange-Traded Fund (ETF) is an investment vehicle or an index that tracks the price of an underlying asset. ETFs can not only track a single asset, but a group of assets and sectors. For example, a Bitcoin ETF tracks Bitcoin’s price. ETF is a tool used by investors to gain exposure to a certain asset.
Yes. The first Bitcoin futures ETF in the US was approved by the US Securities & Exchange Commission in October 2021. A total of seven Bitcoin futures ETFs have been approved, with more than 20 still waiting for the regulator’s permission. The SEC says that the cryptocurrency industry is new and subject to manipulation, which is why it has been delaying crypto-related futures ETFs for the last few years.
Yes. The SEC approved in January 2024 the listing and trading of several Bitcoin spot Exchange-Traded Funds, opening the door to institutional capital and mainstream investors to trade the main crypto currency. The decision was hailed by the industry as a game changer.
The main advantage of crypto ETFs is the possibility of gaining exposure to a cryptocurrency without ownership, reducing the risk and cost of holding the asset. Other pros are a lower learning curve and higher security for investors since ETFs take charge of securing the underlying asset holdings. As for the main drawbacks, the main one is that as an investor you can’t have direct ownership of the asset, or, as they say in crypto, “not your keys, not your coins.” Other disadvantages are higher costs associated with holding crypto since ETFs charge fees for active management. Finally, even though investing in ETFs reduces the risk of holding an asset, price swings in the underlying cryptocurrency are likely to be reflected in the investment vehicle too.














