
Solana Price Forecast: SOL flashes bullish potential on institutional, retail confidence
Ni Vishal Dixit
Petsa ng Pag-publish: 10 Dec 2025 | Petsa ng Pag-edit: 10 Dec 2025


Sikat na Artikulo

Solana (SOL) extends its upward trend for the third consecutive day, trading within a consolidation range of $121-$145. Persistent inflows into Solana Exchange Traded Funds (ETFs) over the last four days suggest steady institutional confidence.
- Solana recovers with a fresh upcycle within a consolidation after a 3% rise on Tuesday.
- Solana ETFs record consistent inflows for the fourth consecutive trading day, reflecting steady confidence among institutional investors.
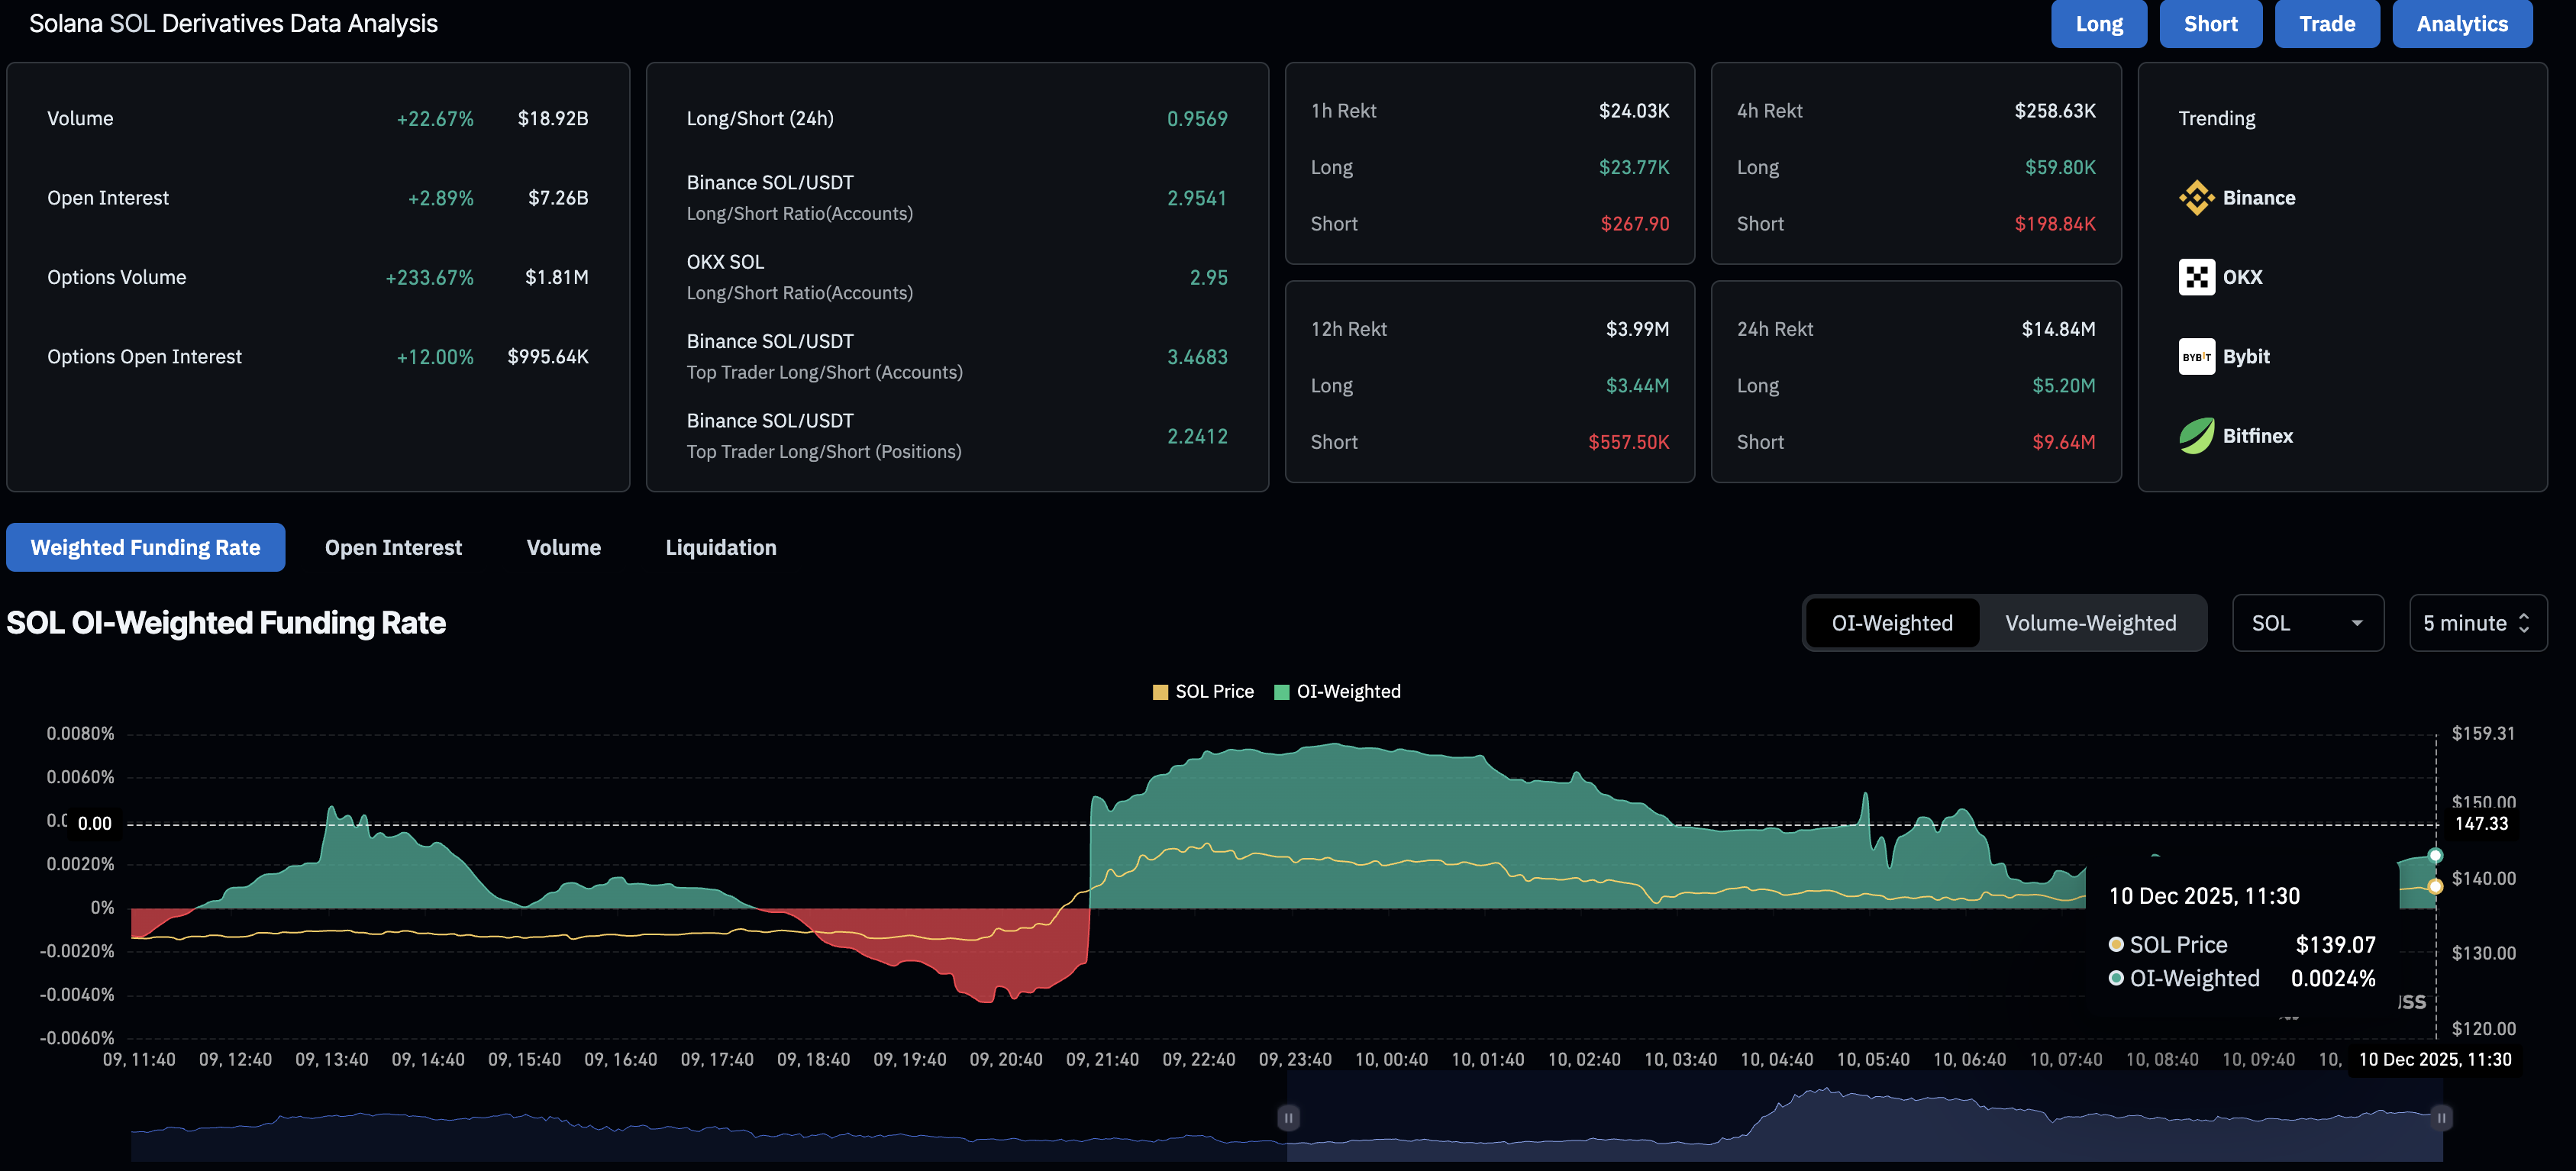
- Derivatives data indicate a surge in bullish bets as the SOL futures Open Interest grows.
Solana (SOL) extends its upward trend for the third consecutive day, trading within a consolidation range of $121-$145. Persistent inflows into Solana Exchange Traded Funds (ETFs) over the last four days suggest steady institutional confidence. On the derivatives side, the risk-on sentiment prevails as the SOL futures market expands alongside increasing bullish bets.
Solana regains strength in derivatives, ETFs market
CoinGlass’ data shows that SOL futures Open Interest (OI) stands at $7.26 billion, up 2.89% over the last 24 hours. This indicates that the investors are increasing their risk exposure, anticipating further recovery in Solana.
Additionally, the OI-weighted funding rate stands at 0.0224%, indicating that buyers are paying a premium to hold long positions, reflecting their confidence. Meanwhile, short liquidations of $9.64 million over the last 24 hours outpace long liquidations of $5.20 million, indicating a buy-side dominance.
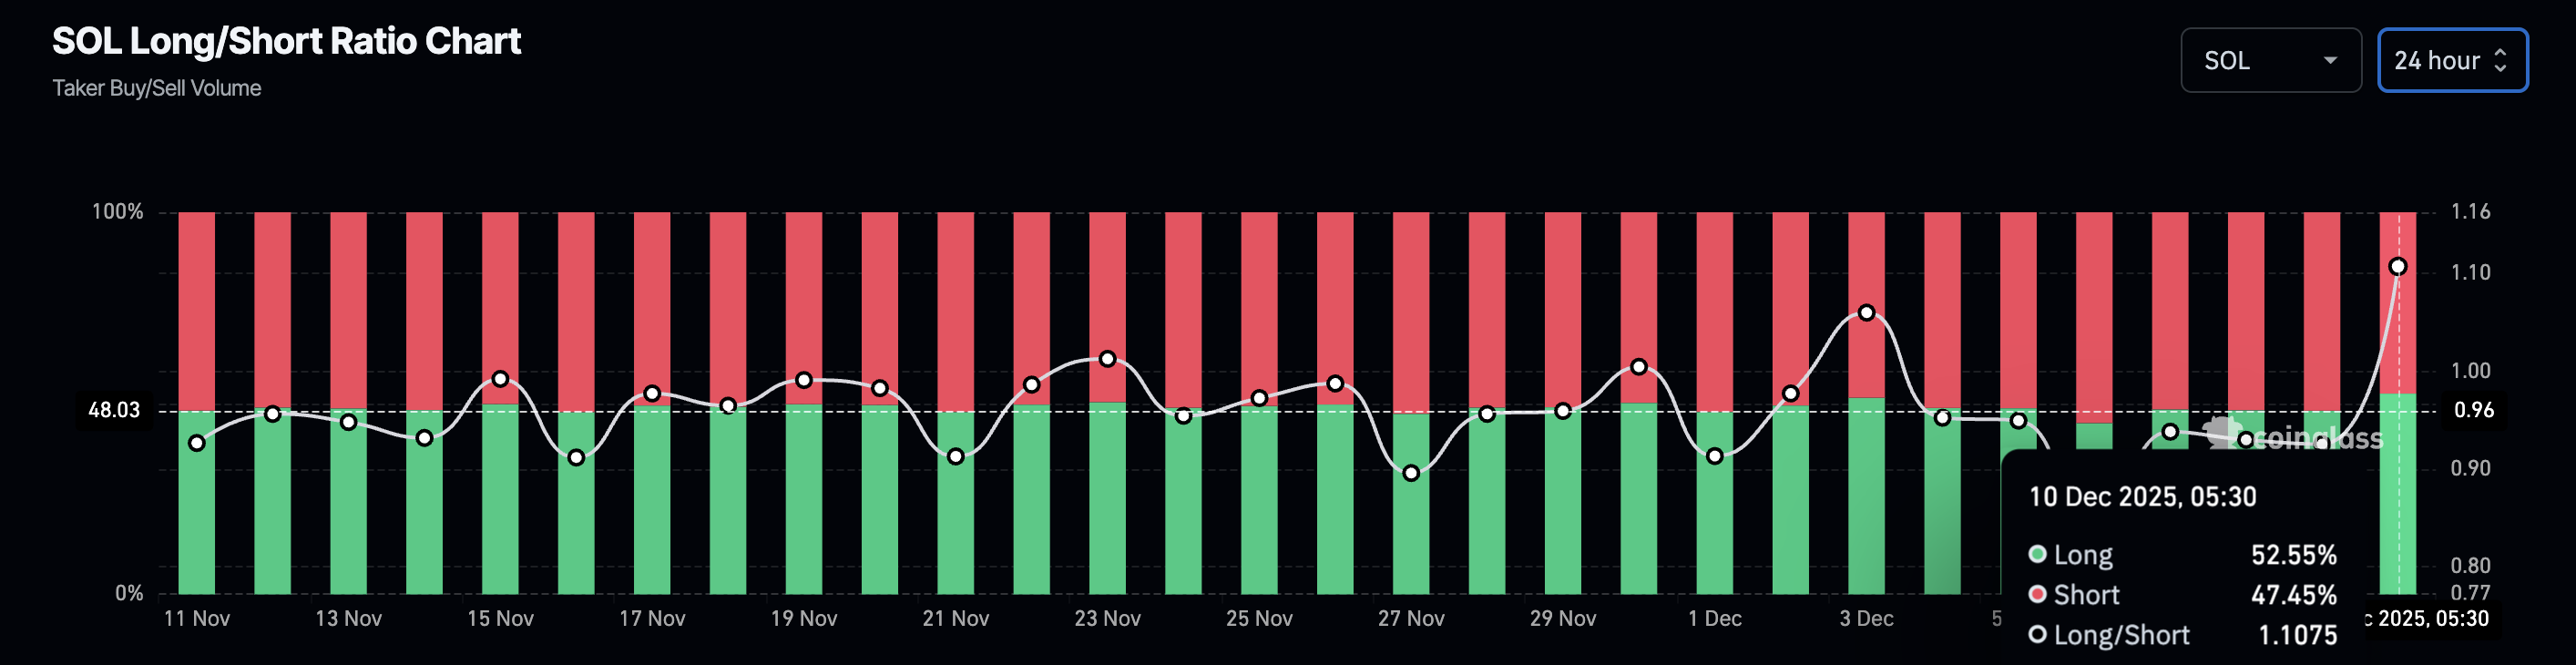
Along the same lines, the long-to-short ratio chart indicates a sharp increase in long positions to 52.55%, up from 44.83% on Saturday. This increase in bullish bets aligns with the surge in OI and the funding rate, suggesting a bullish shift in the Solana derivatives market.
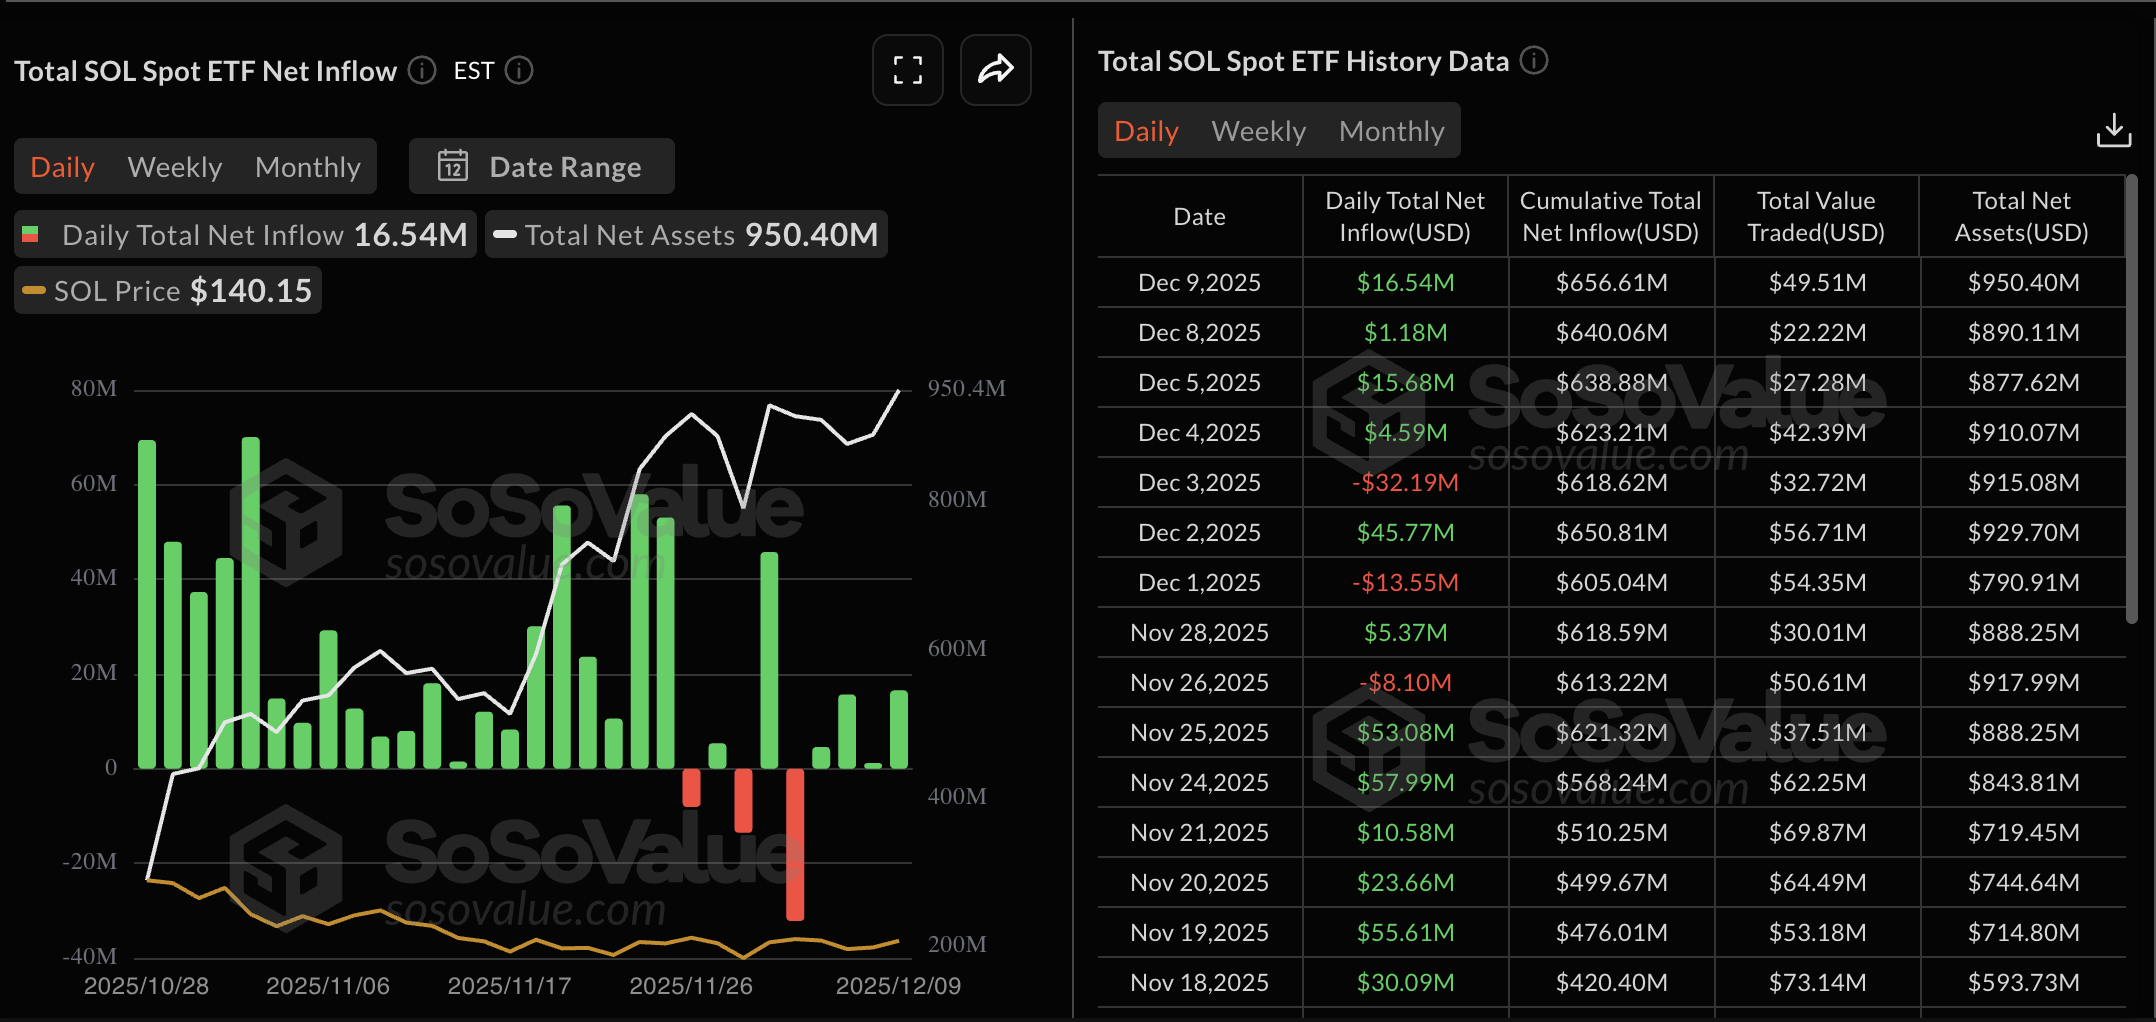
On the ETFs side, the net inflow of $16.54 million on Tuesday marked the fourth straight day of inflow and the highest since December 2, indicating renewed institutional interest.
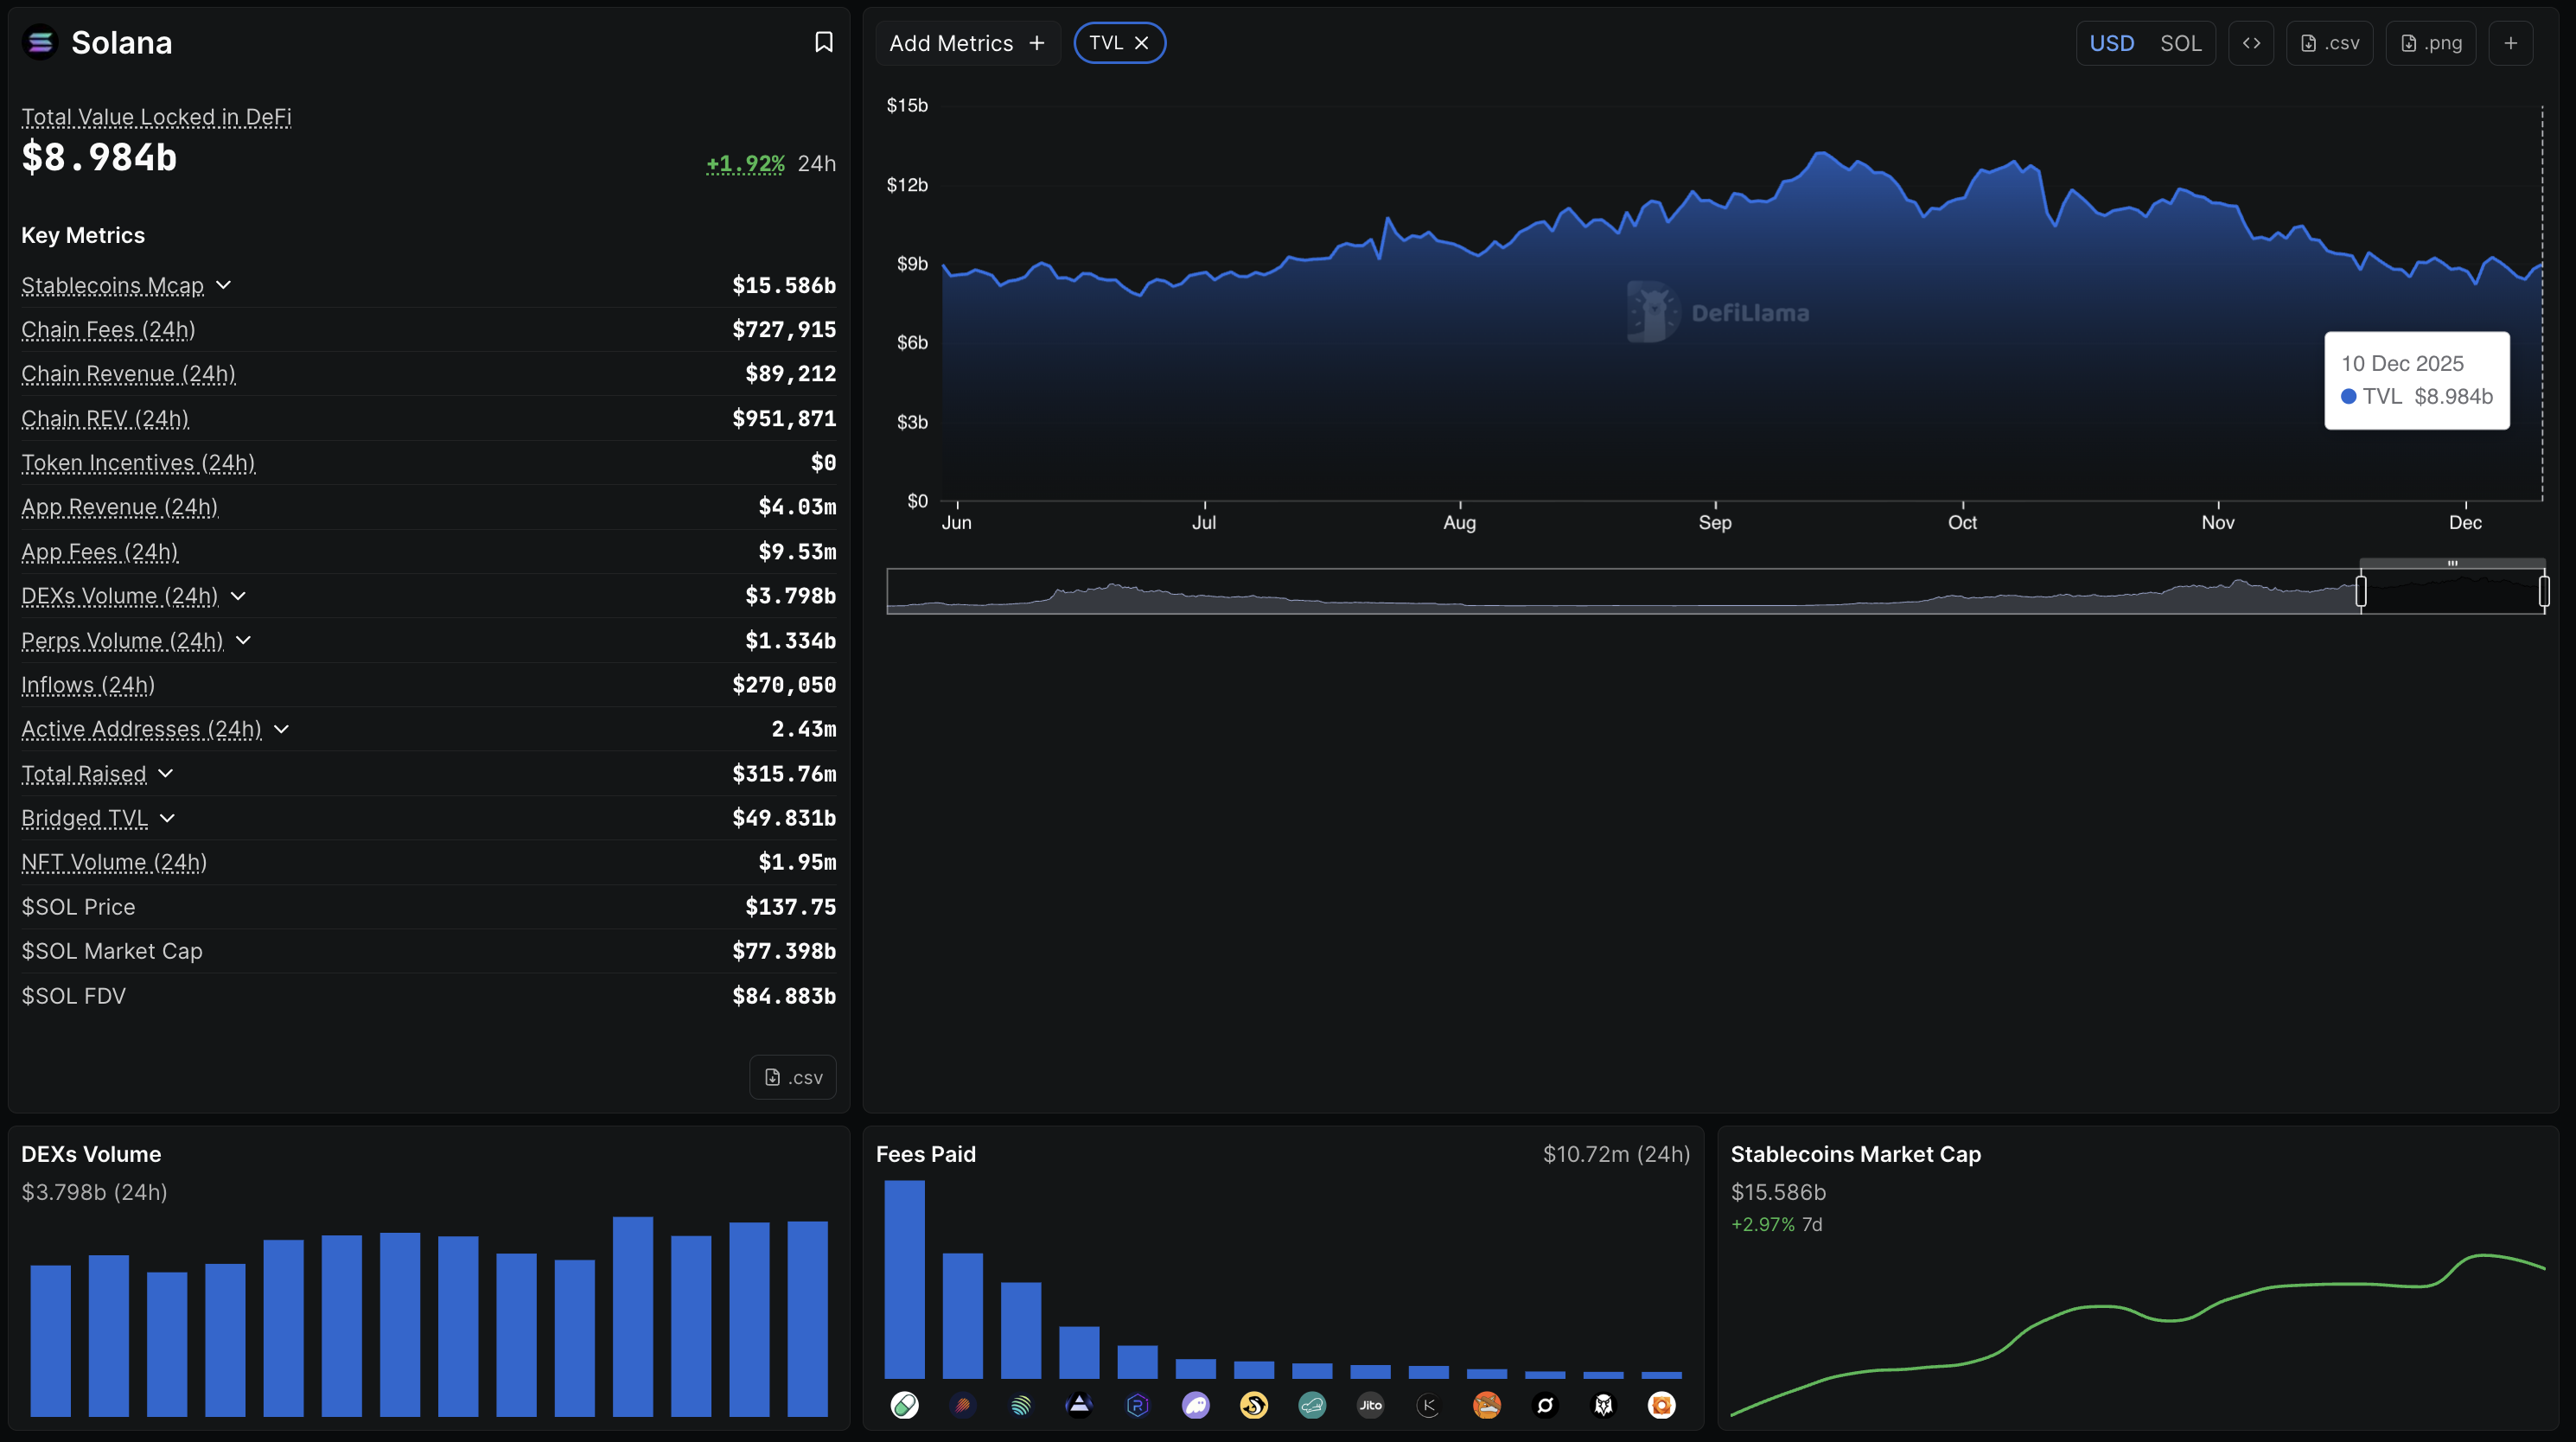
Similarly, the DeFiLlama data shows an increase in on-chain demand for Solana. The Total Value Locked (TVL) on the high-speed blockchain has increased by nearly 2% over the last 24 hours, reaching $8.984 billion, while stablecoins have surged by almost 3% over the last week, reaching $15.586 billion.
Technical outlook: Will Solana surpass $145?
Solana trades near $140 at press time on Wednesday, after a 3% surge the previous day. The recovery run approaches the November 14 high at $145, serving as the ceiling of a consolidation range with the lower support at June’s low of $126.
If Solana clears the $145 boundary, the 50-day and 200-day Exponential Moving Averages (EMAs) at $152 and $172, respectively, could serve as potential targets.
Technically, Solana is regaining strength as selling pressure wanes. The Relative Strength Index (RSI) on the daily chart is at 48, inching toward the midline, suggesting a decline in bearish pressure.
At the same time, the Moving Average Convergence Divergence (MACD) rises toward the zero line with renewed green histogram bars, suggesting a surge in bullish momentum.
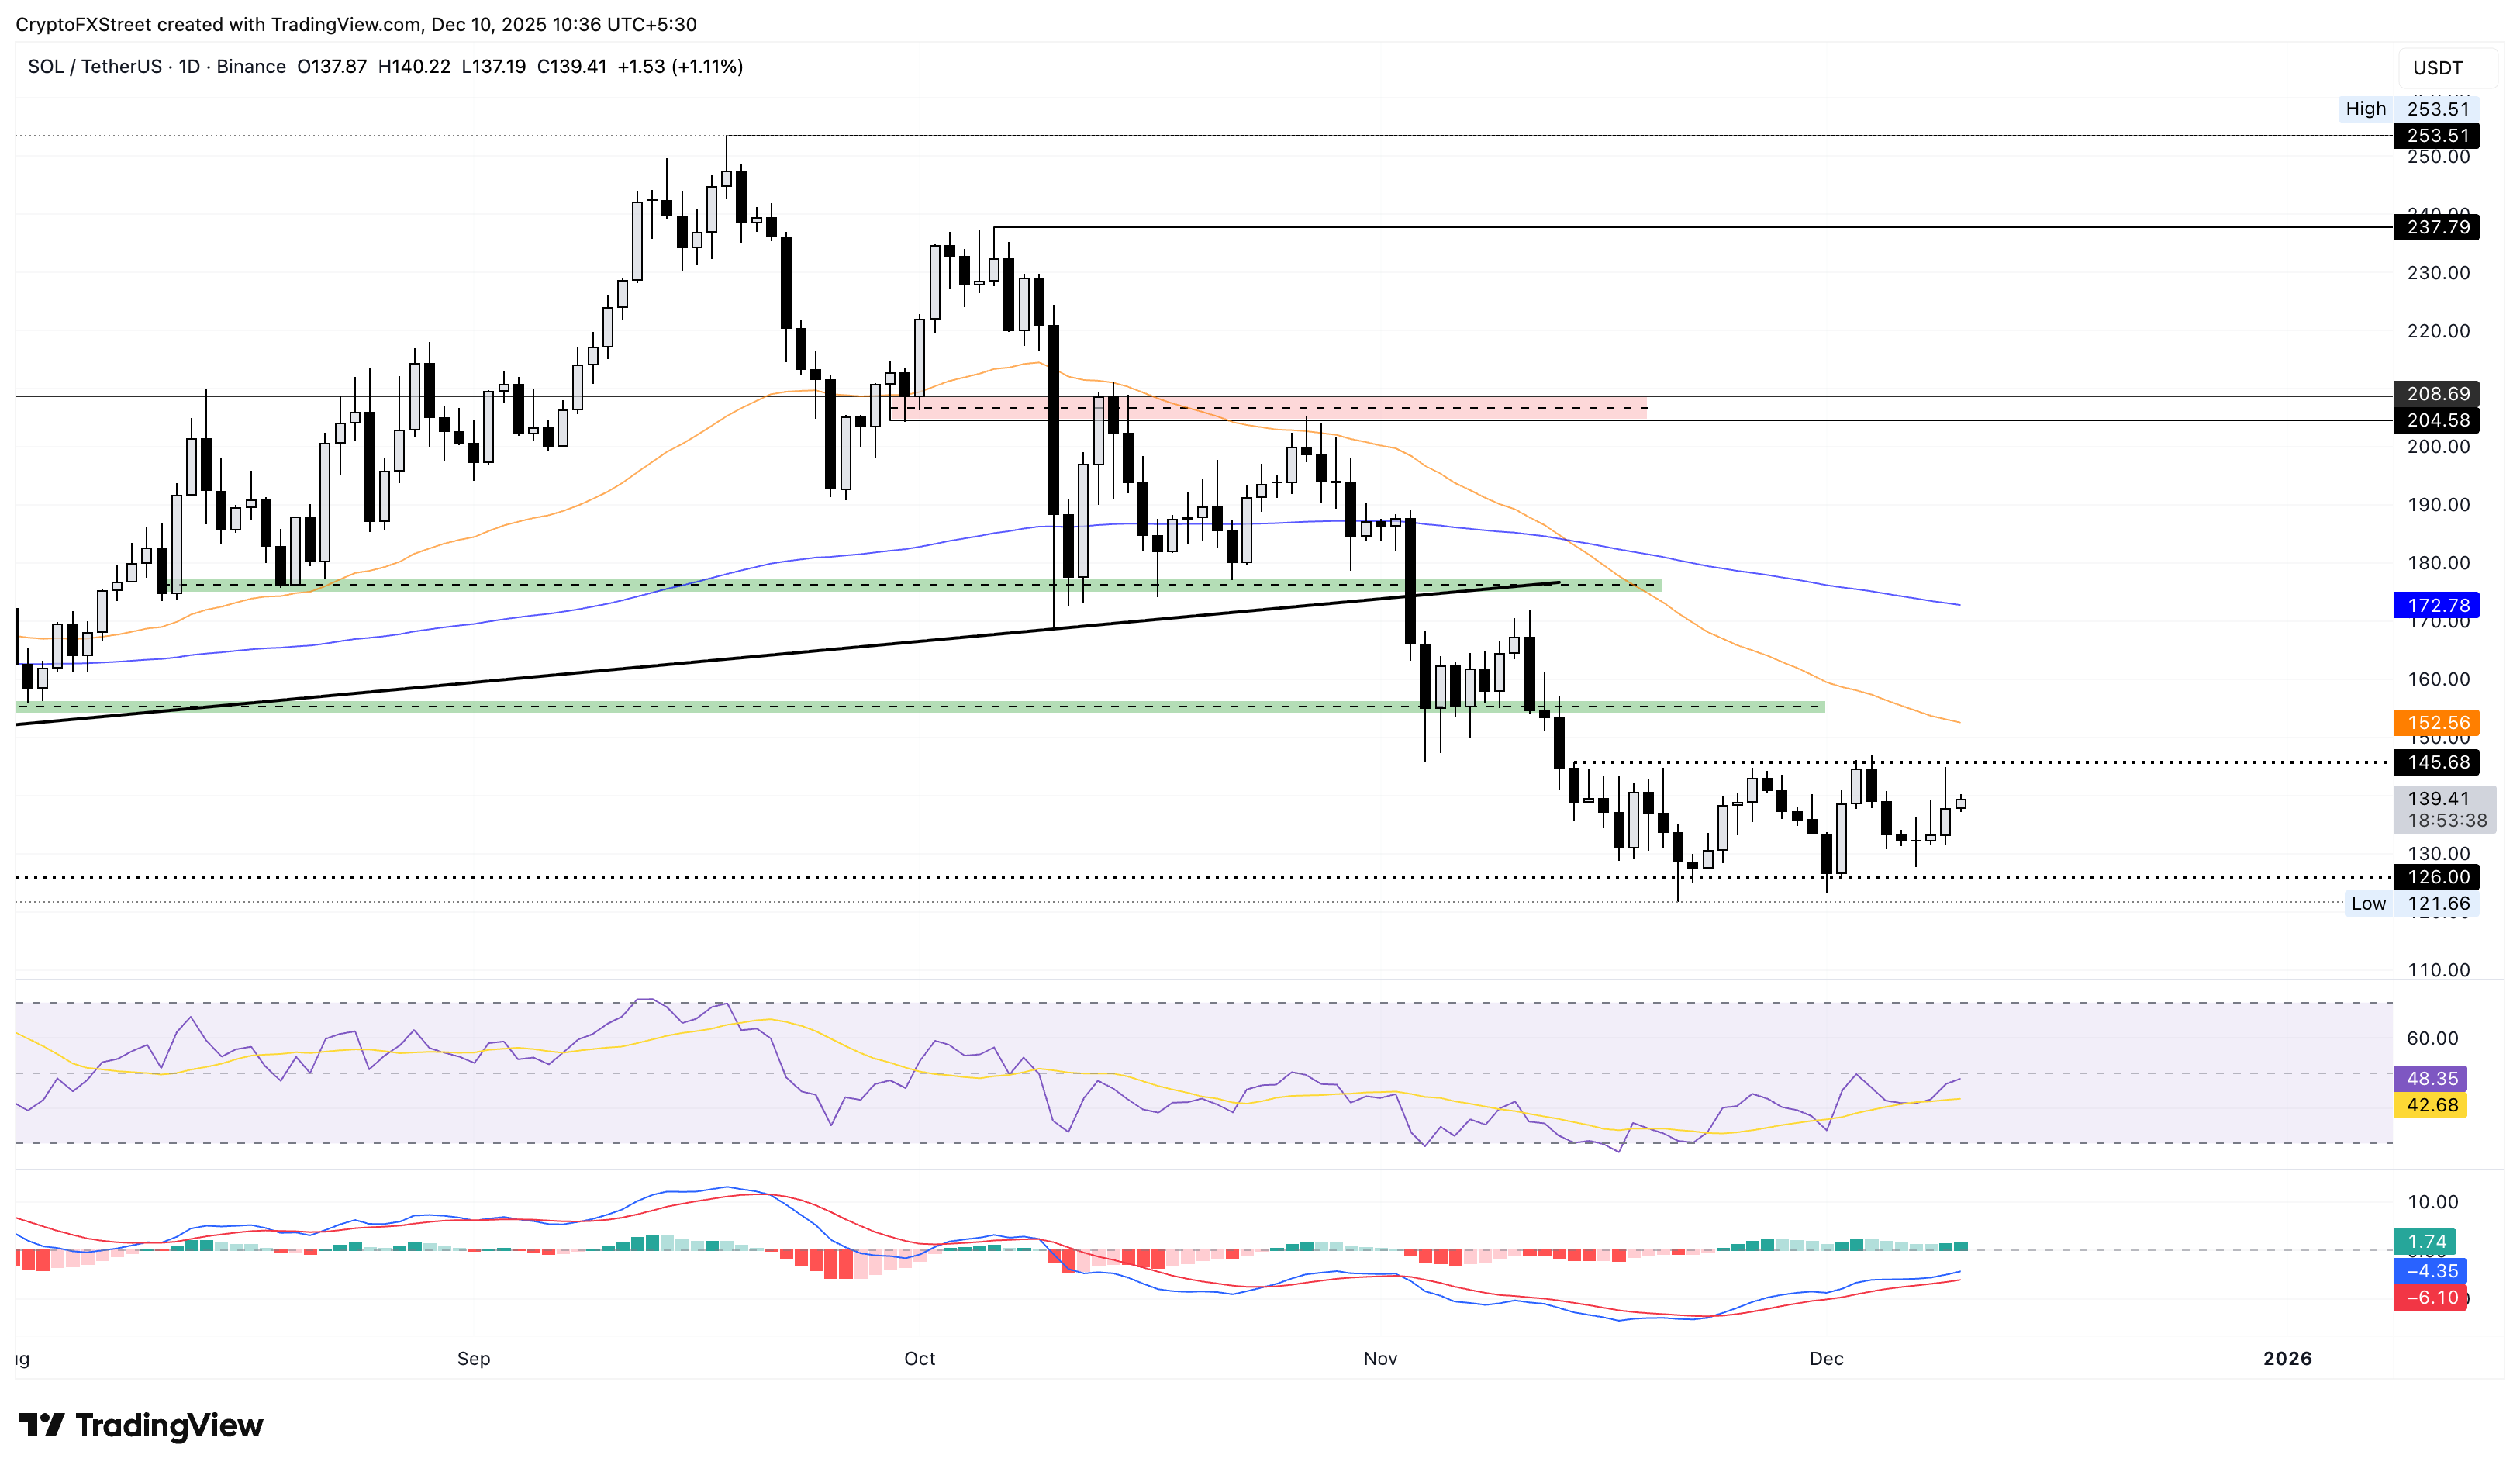
On the downside, the key support for Solana lies at the $126 mark, followed by April’s low at $95.

Higit sa isang milyong user ang umaasa sa FXStreet para sa real-time market data, charting tools, expert insights, at Forex news. Ang komprehensibong economic calendar at educational webinars nito ay tumutulong sa mga trader na manatiling may alam at gumawa ng kalkuladong mga desisyon. Sinusuportahan ang FXStreet ng humigit-kumulang 60 propesyonal sa pagitan ng Barcelona HQ at iba’t ibang rehiyon sa buong mundo.
Magbasa pa


