

Solana Price Forecast: SOL recovers on retail support despite muted ETF inflows
- Solana extends gains on Wednesday, following a roughly 4% rebound the previous day.
- Derivatives data signal steady retail demand amid muted institutional inflows.
- The technical outlook for SOL is mixed, with a near-term recovery poised to test a breakout of the resistance trendline.
Solana (SOL) price advances above its 50-day Exponential Moving Average (EMA) at $76.82, following a 4% rebound the previous day. SOL derivatives witness steady positional buildup with positive funding rates and rising volume reflecting a bullish bias, despite muted institutional activity so far this week.

Technically, SOL should surpass an overhead trendline near $81.50 to reinstate a bullish trend.
Solana regains retail strength
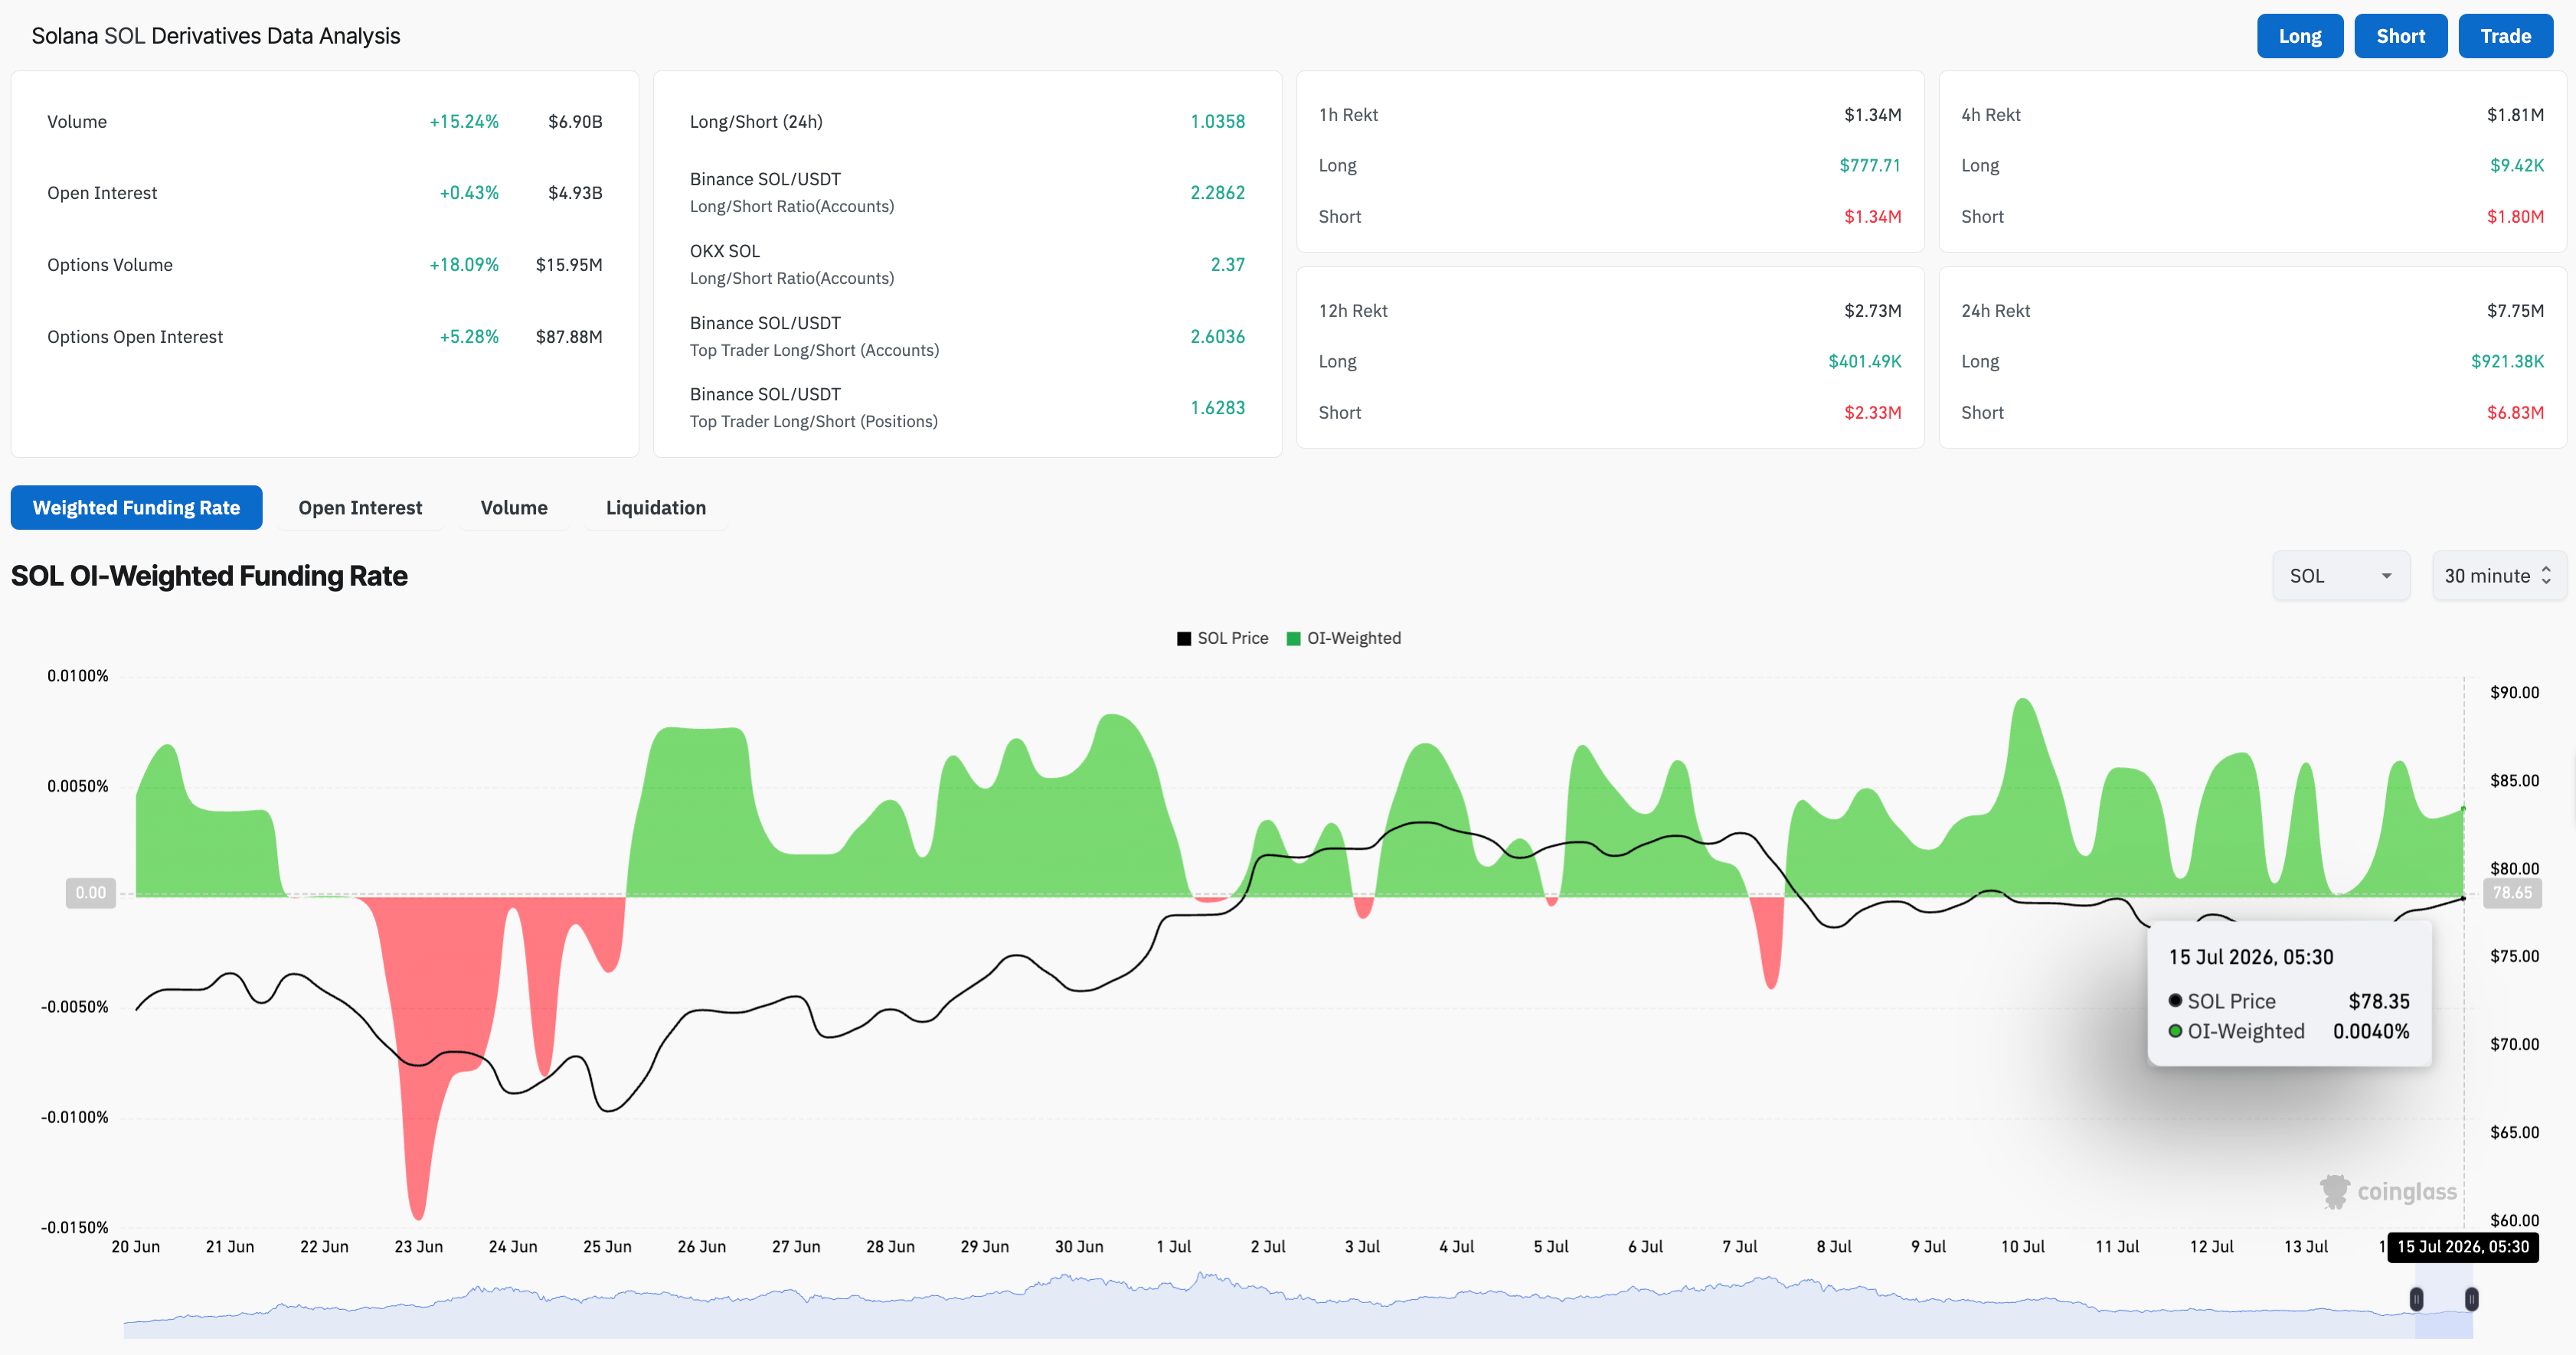
Easing risk-off sentiment in the crypto market, with reduced inflation risk in the US, triggered renewed retail support for major altcoins such as Solana. CoinGlass data shows SOL futures Open Interest (OI) holding stable at around $4.93 billion over the last 24 hours, while volume has increased 15% to $6.90 billion in the same period, reflecting increased trading activity that is aiding positional buildup. In addition, the funding rate of 0.0040% reflects bullish sentiment, which could further boost active positions as retail speculation builds.
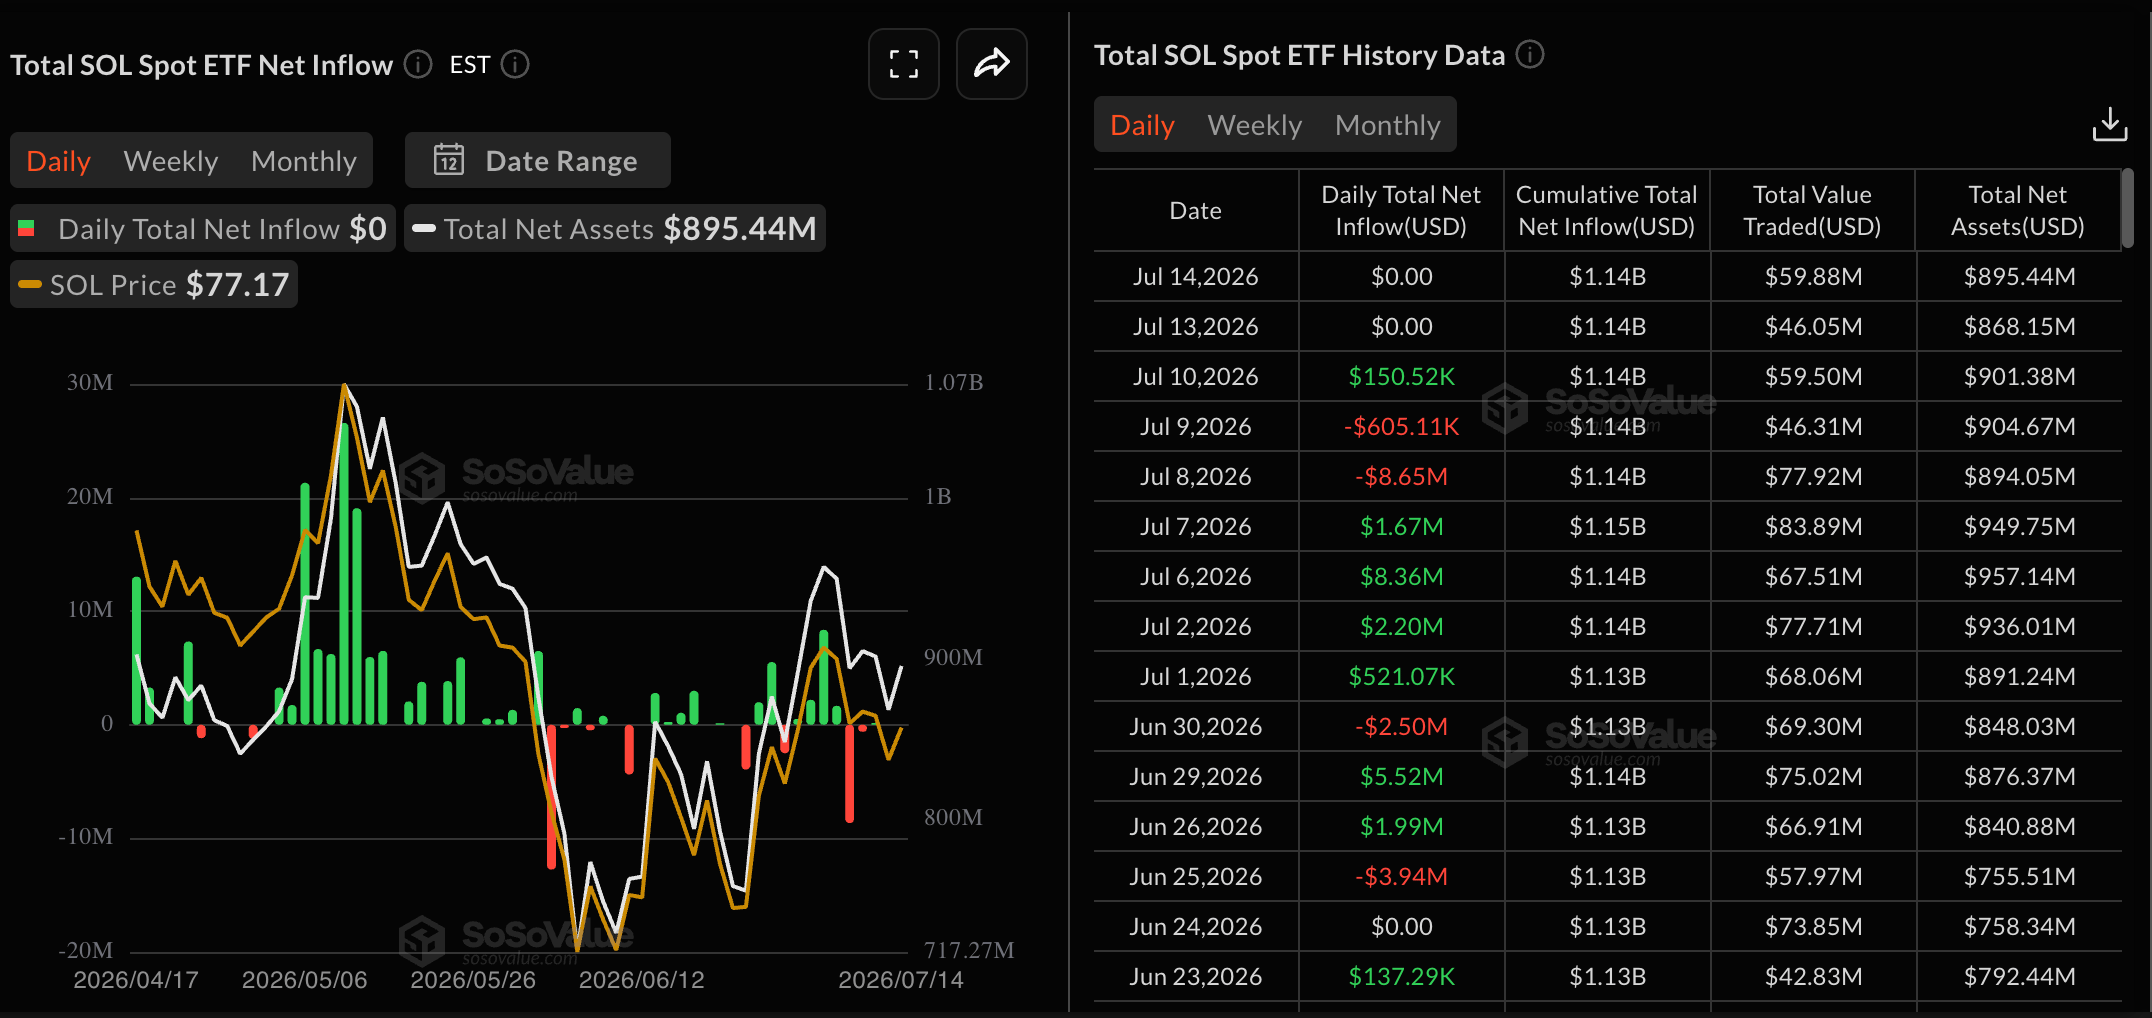
However, Solana Exchange-Traded Funds (ETFs) recorded two consecutive days of zero inflows so far this week, indicating that large-wallet traditional investors are standing on the sidelines.
Will Solana extend its recovery?
Solana shows steady recovery, inching closer to the $80 mark on Wednesday. SOL maintains a capped tone, holding above the 50-day EMA at $76.82 but remaining well below the descending trendline near $81.50 and the 200-day EMA at $94.52.
Still, the near-term recovery in SOL sustains above the 50% retracement at $76.92, measured over the $98.41 to $60.13 downswing. A decisive close above $81.50 could confirm the downward trendline breakout, potentially targeting the 78.6% Fibonacci retracement level at $88.56, guarding the upside to the 200-day EMA at $94.52.
The Relative Strength Index (RSI) at around 54 hints at mildly constructive momentum, while the Moving Average Convergence Divergence (MACD) is approaching the signal line, maintaining a neutral tone.
On the downside, initial support is provided by the 50-day EMA at $76.82, with further demand expected at the prior upward trendline at $68.88 and the cycle low near $60.13 as a deeper structural floor.
(The technical analysis of this story was written with the help of an AI tool. Know more.)














