
Solana Price Forecast: SOL slips below $82 as hawkish Fed tone sparks risk-off sentiment
Ni Manish Chhetri
Petsa ng Pag-publish: 19 Feb 2026 | Petsa ng Pag-edit: 19 Feb 2026


Sikat na Artikulo

Solana (SOL) is trading below $82 at the time of writing on Thursday after failing to break out of the upper consolidation range over the weekend.
- Solana trades below $82 on Thursday after a rejection at the upper consolidation range.
- The less dovish FOMC Minutes on Wednesday dampened risk appetite, pressuring risky assets.
- Mixed signals from on-chain and derivatives data limit recovery prospects and indicate cautious positioning among traders.
Solana (SOL) is trading below $82 at the time of writing on Thursday after failing to break out of the upper consolidation range over the weekend. The Minutes from the Federal Open Market Committee (FOMC) on Wednesday kept interest rates unchanged, but a less dovish tone that followed dampened risk appetite and pressured risky assets. Meanwhile, mixed signals from derivatives and on-chain metrics suggest that SOL’s short-term outlook remains uncertain, limiting the scope for a recovery.
FOMC’s less dovish tone dampened risk appetite
The Minutes from the FOMC’s Wednesday meeting showed that policymakers were deeply divided over the necessity and timing of further rate cuts amid concerns about inflation.
In fact, several Federal Reserve (Fed) officials indicated that more rate cuts could be warranted if inflation declines as expected, while others cautioned that easing too early could compromise the central bank’s 2% inflation target.
The cautiously balanced, rather than dovish stances, continue to support the US Dollar (USD), with the DXY index closing above $97.69 on Wednesday. The less dovish FOMC Minutes dampened risk appetite, pressuring risky assets, with Bitcoin (BTC) falling below $67,000 and Solana slipping below $82 that day.
Mixed signals cap recovery
Santiment’s Social Dominance metric for Solana supports a bearish outlook. The index measures the share of SOL-related discussions across the cryptocurrency media. It has been in a downward trend since the end of December, falling again in early February to 0.074% on Thursday. This fall indicates fading market interest and weakening sentiment among Solana investors.
 [08-1771473235539-1771473235540.02.43, 19 Feb, 2026].png)
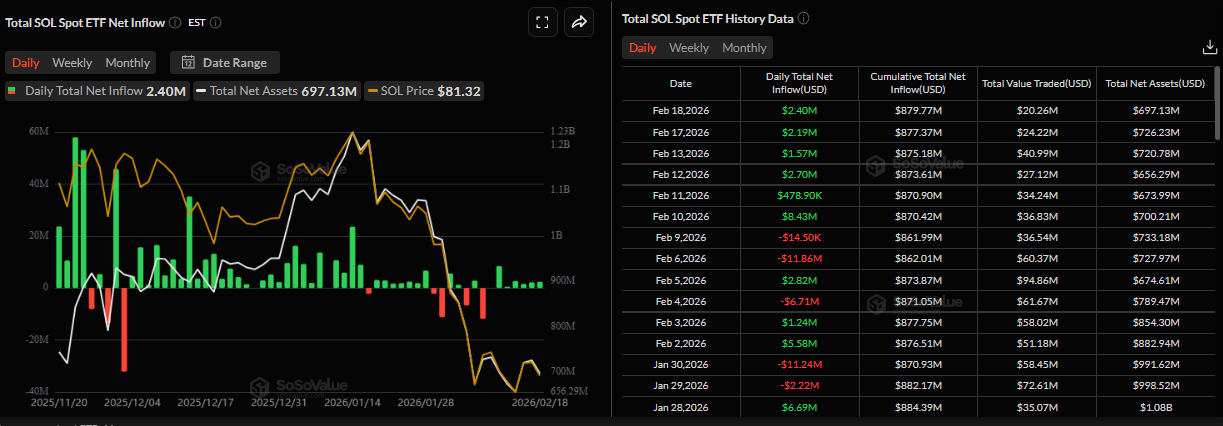
The SoSoValue chart below shows that spot Exchange-Traded Funds (ETFs) recorded an inflow of $2.40 million on Wednesday, marking the longest streak of positive flows since February 10. Despite this institutional demand, SOL price action failed to respond positively, underscoring persistent selling pressure and limited conviction among traders.
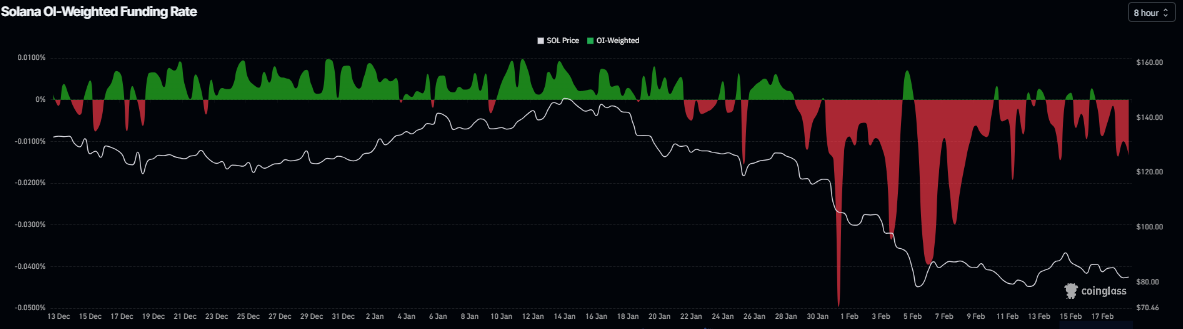
On the derivatives side, CoinGlass’ OI-Weighted Funding Rate data shows that the number of traders betting that the price of Solana will slide further is higher than those anticipating a price increase. The metric turned negative on Tuesday and is at -0.0133% as of Thursday. The negative ratio suggests that shorts are paying longs, suggesting bearish sentiment toward Solana.
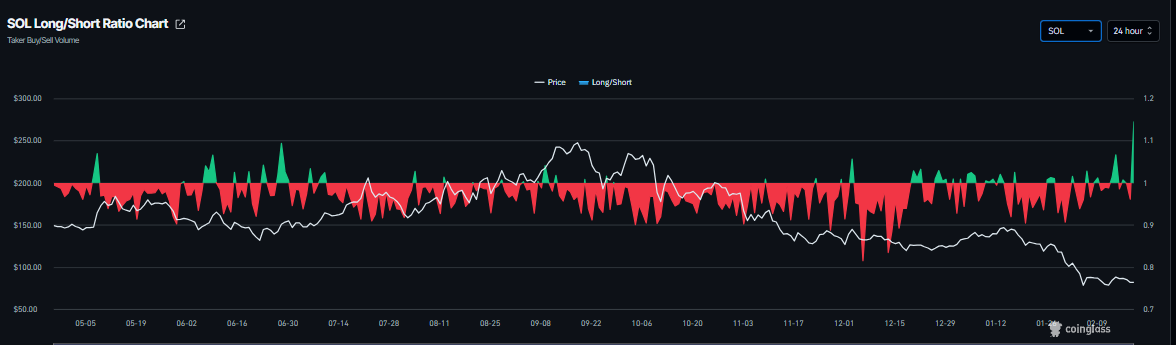
However, the SOL long-to-short ratio stands at 1.44, the highest level over a month. The ratio being above one indicates bullish sentiment as traders are betting on the asset price to rise.
This combination suggests indecision among investors and limits the chances of a sustained recovery.
Solana Price Forecast: SOL could extend its correction if it closes below the support level
Solana price was rejected from the upper consolidation boundary at $89.38 on Sunday and declined 7.32% through Wednesday. As of writing on Thursday, SOL is trading below $82, heading toward the lower consolidation boundary.
If SOL closes below the lower consolidation boundary at $76.45, it could extend further losses toward the February 6 low at $67.50.
The Relative Strength Index (RSI) reads 32, pointing downward toward the oversold conditions, indicating bearish momentum gaining traction. However, the Moving Average Convergence Divergence (MACD) showed a bullish crossover on Sunday, which remains in place, suggesting that upside bias has not been invalidated yet.
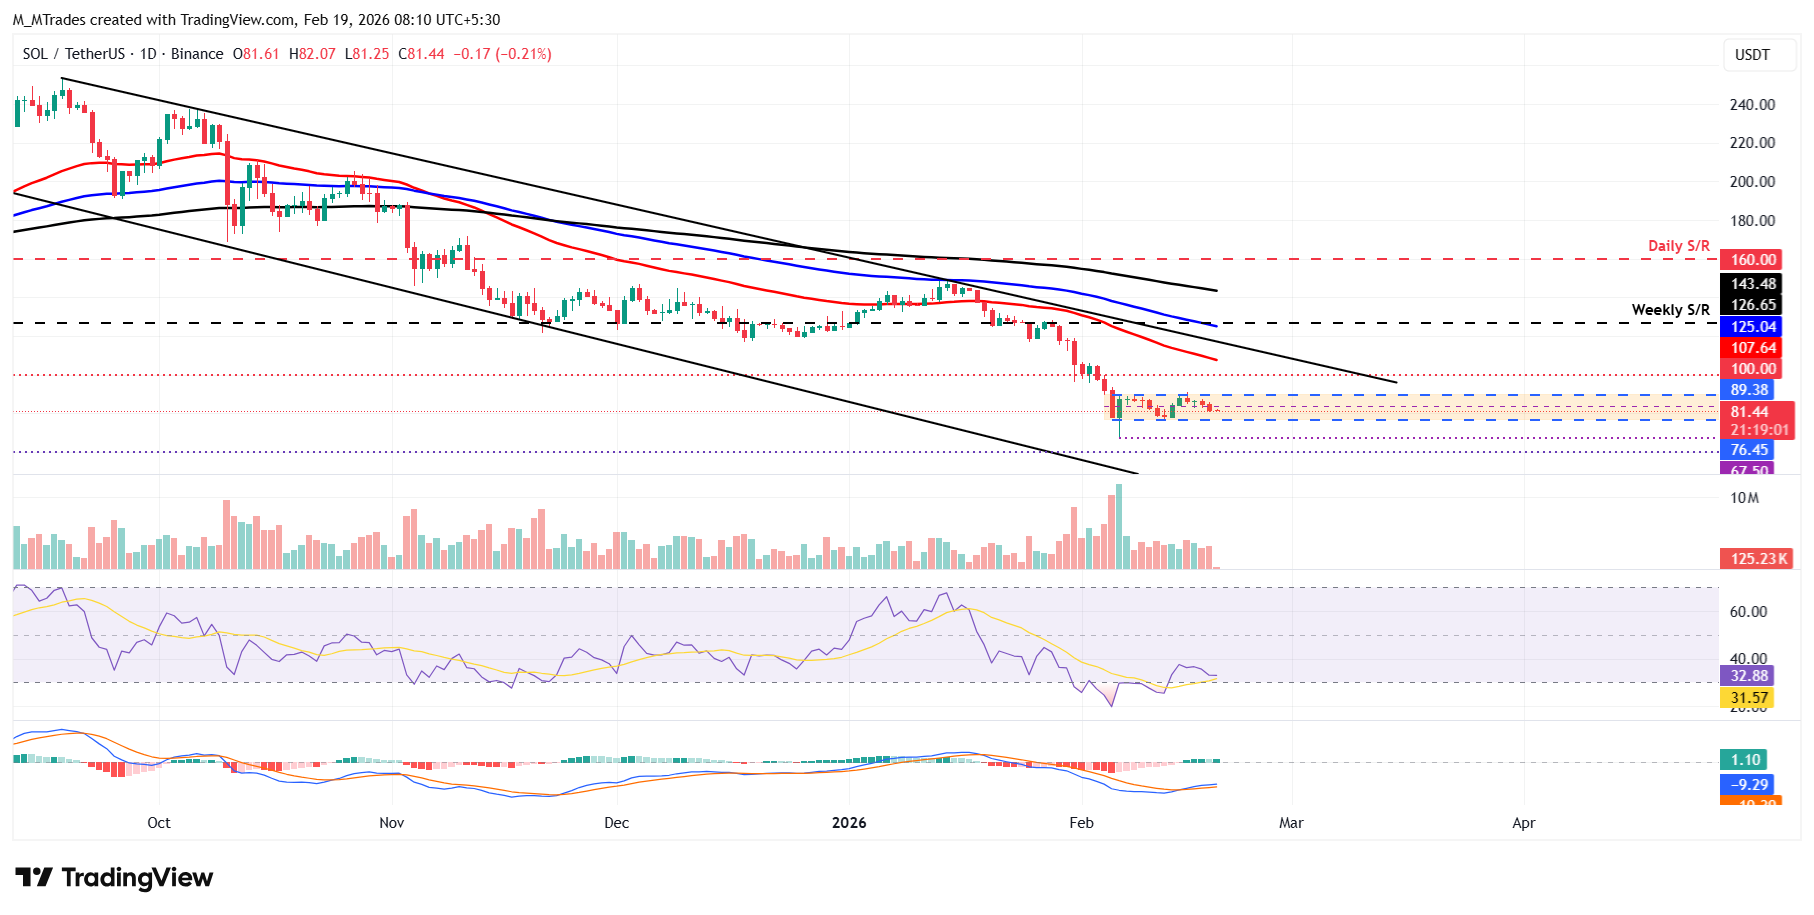
If SOL breaks above the upper consolidation zone and closes there, it could extend its advance toward the key psychological level at $100.

Higit sa isang milyong user ang umaasa sa FXStreet para sa real-time market data, charting tools, expert insights, at Forex news. Ang komprehensibong economic calendar at educational webinars nito ay tumutulong sa mga trader na manatiling may alam at gumawa ng kalkuladong mga desisyon. Sinusuportahan ang FXStreet ng humigit-kumulang 60 propesyonal sa pagitan ng Barcelona HQ at iba’t ibang rehiyon sa buong mundo.
Magbasa pa


