
Top 3 Price Prediction: Bitcoin, Ethereum, Ripple – BTC, ETH and XRP show no sign of recovery
Ni Manish Chhetri
Petsa ng Pag-publish: 11 Feb 2026 | Petsa ng Pag-edit: 11 Feb 2026


Sikat na Artikulo

Bitcoin (BTC), Ethereum (ETH), and Ripple (XRP) show signs of cautious stabilization on Wednesday after failing to close above their key resistance levels earlier this week. BTC trades below $69,000, while ETH and XRP also encountered rejection near major resistance levels.
- Bitcoin price trades below $69,000 on Wednesday after failing to close above key resistance.
- Ethereum faces rejection at the key $2,149 resistance level, keeping downside risks intact.
- XRP price hovers at $1.40 after facing resistance around the previously broken lower trendline of the falling wedge pattern.
Bitcoin (BTC), Ethereum (ETH), and Ripple (XRP) show signs of cautious stabilization on Wednesday after failing to close above their key resistance levels earlier this week. BTC trades below $69,000, while ETH and XRP also encountered rejection near major resistance levels. With no immediate bullish catalyst, the top three cryptocurrencies continue to show no clear signs of a sustained recovery.
Bitcoin fails to close above daily resistance around $73,000
Bitcoin retested the daily resistance at $73,072 on Sunday and has declined slightly by 2.24% through Tuesday. As of Wednesday, BTC is trading below $69,000.
If BTC continues its downward trend, it could extend the decline toward the 78.6% Fibonacci retracement (drawn from the August 2024 low of $49,000 to the October 2025 all-time high of $126,199) at $65,520.
The Relative Strength Index (RSI) on the daily chart is at 31, pointing downward toward the oversold territory, suggesting bearish momentum is gaining traction. In addition, the Moving Average Convergence Divergence (MACD) in the same period shows a bearish crossover, suggesting a continuation of the downward trend.
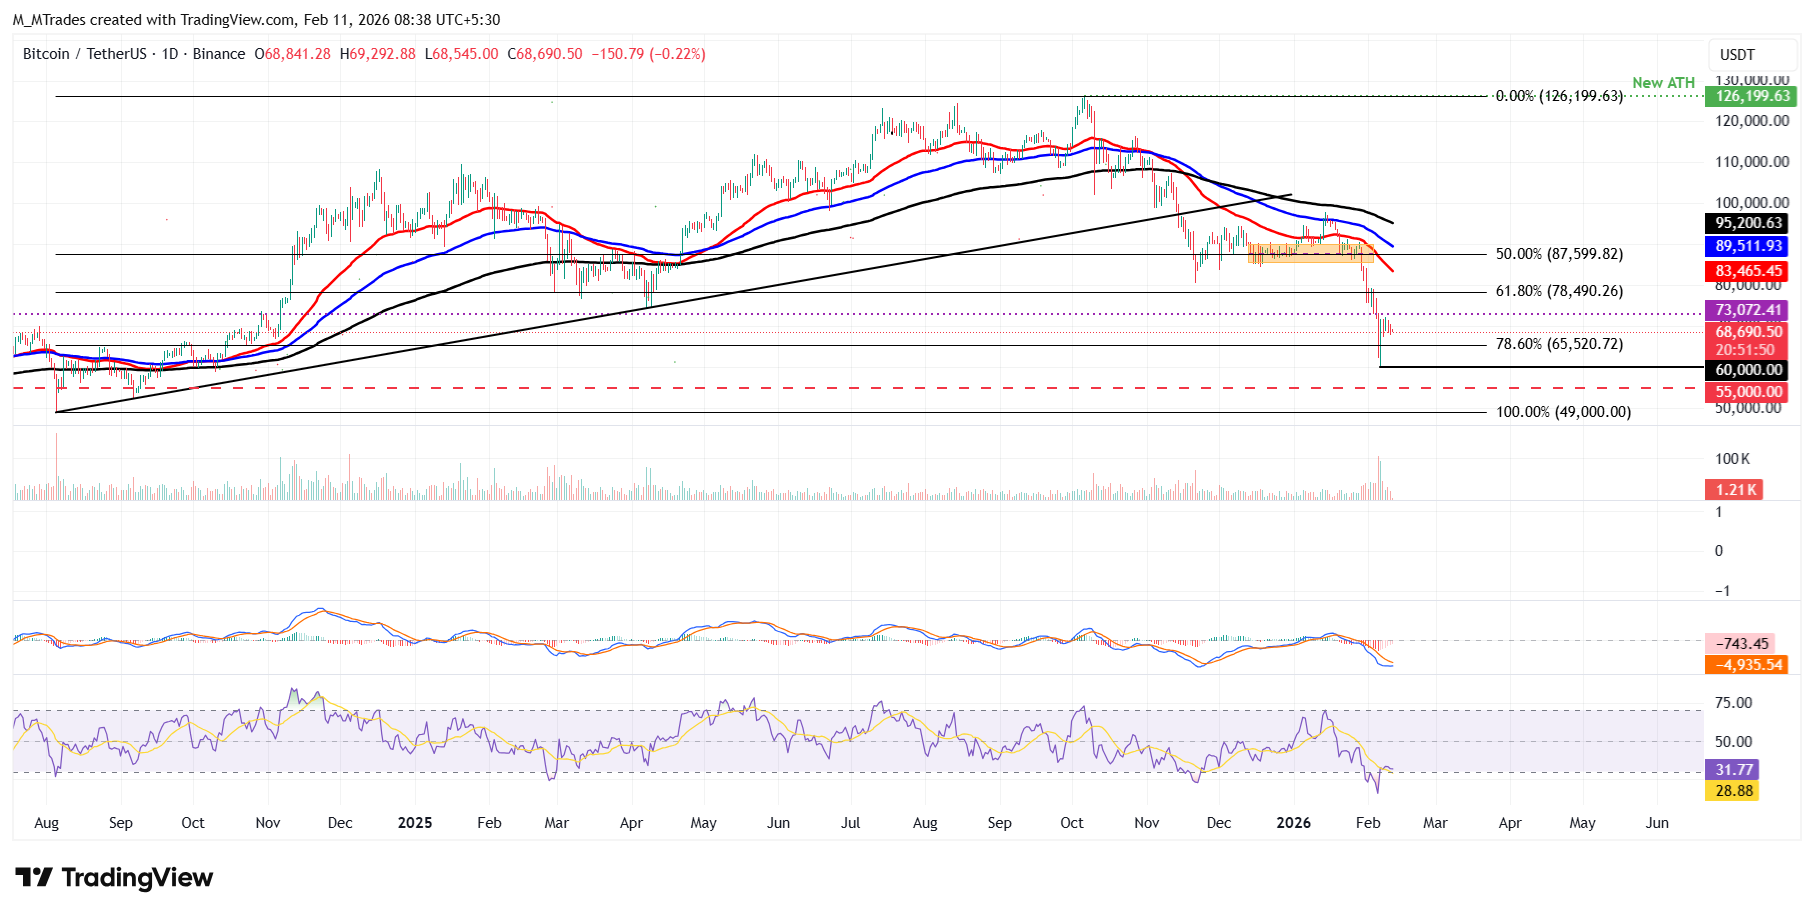
On the contrary, if BTC recovers, it could extend the advance toward the daily resistance at $73,072.
Ethereum fails to close above key resistance
Ethereum retested and was rejected by the 78.6% Fibonacci retracement level at $2,149 on Monday, and declined nearly 4% the next day. As of writing on Wednesday, ETH is trading at $2,012.
If ETH continues its downward trend, it could extend the decline toward Friday’s low at $1,747.
Like Bitcoin, Ethereum’s RSI and MACD also support a bearish outlook.
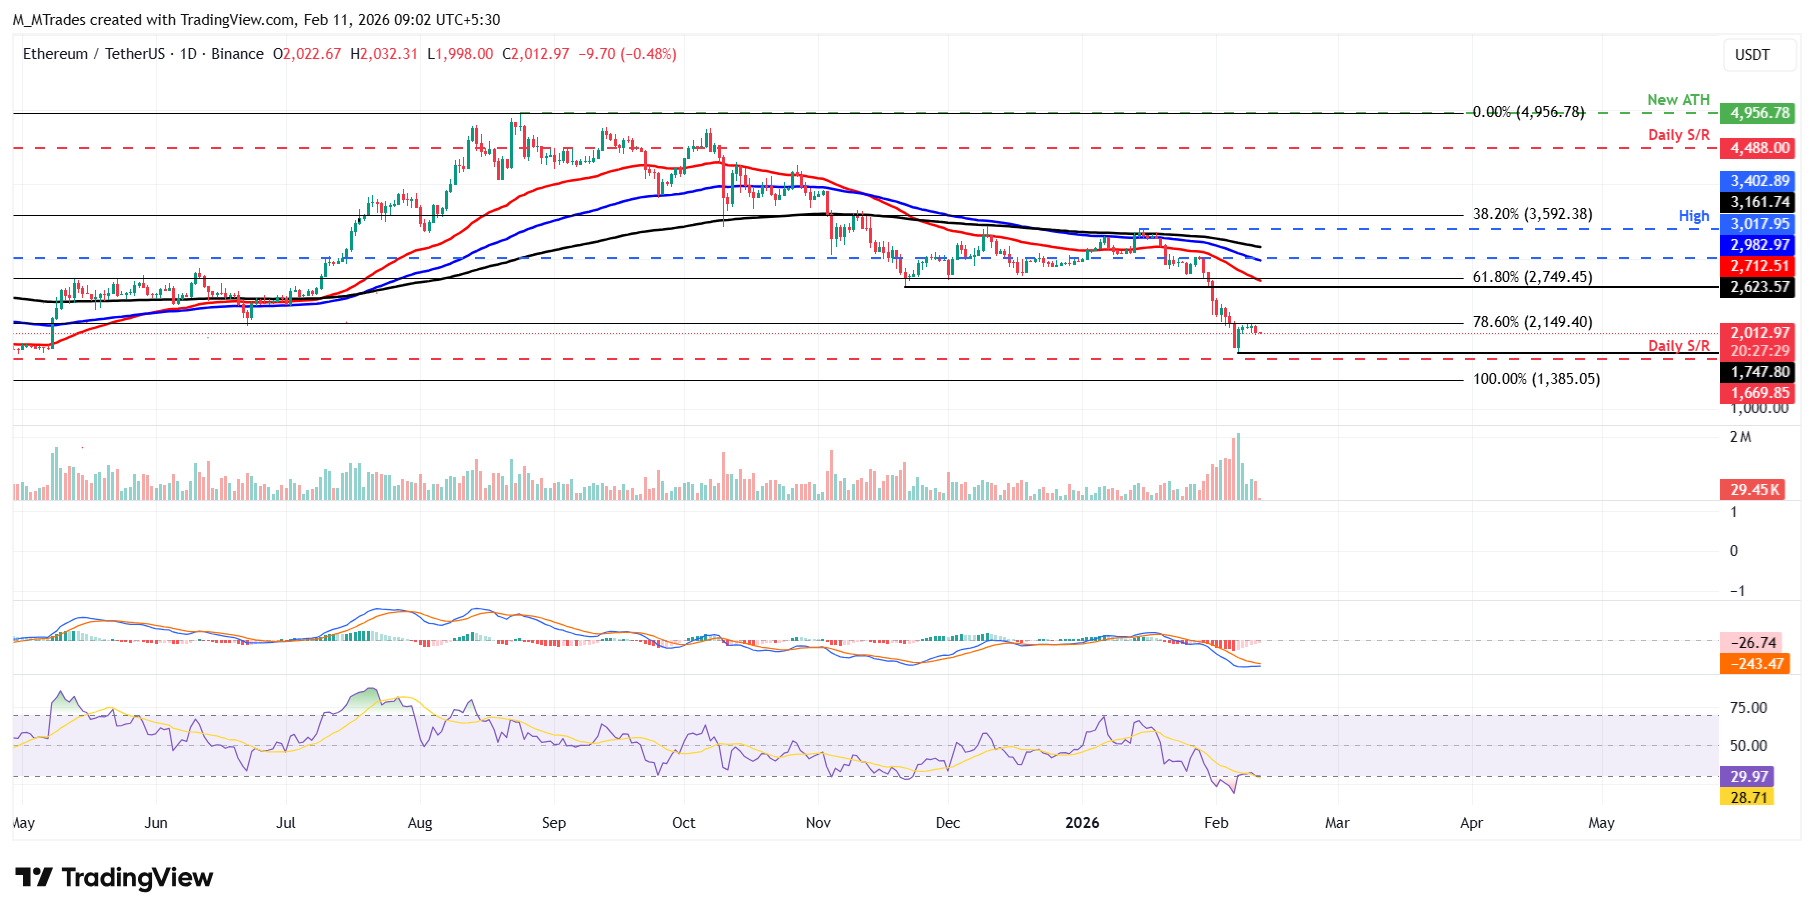
However, if ETH breaks and closes above $2,149 on a daily basis, it could extend the advance toward the next resistance at $2,500.
XRP struggles to break above the lower falling wedge boundary
XRP revisited the broken trendline boundary of a falling wedge on Friday and has been facing rejection around this level through Tuesday. As of Wednesday, XRP is trading below $1.40.
If XRP continues its downward trend, it could extend the decline toward the weekly support at $1.30.
Like Ethereum, XRP’s momentum indicators (RSI and MACD) are also projecting a bearish outlook.
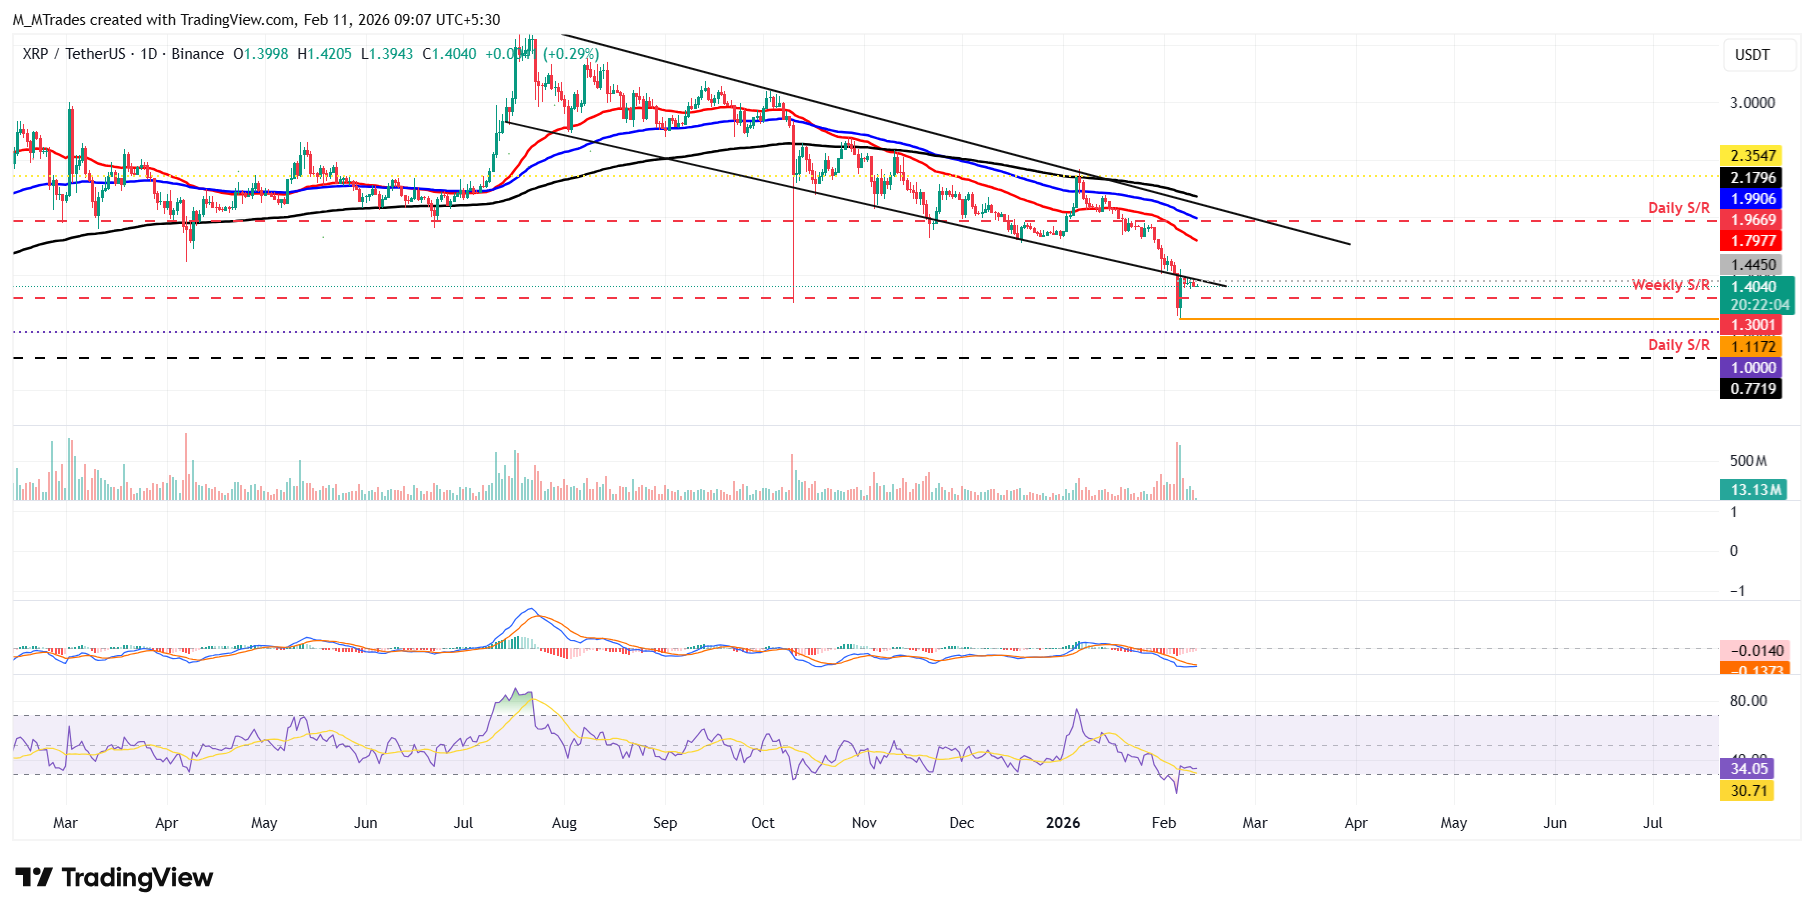
If XRP breaks and closes above the lower boundary of this pattern, it could extend the rally toward the 50-day Exponential Moving Average at $1.79.
Cryptocurrency prices FAQs
Token launches influence demand and adoption among market participants. Listings on crypto exchanges deepen the liquidity for an asset and add new participants to an asset’s network. This is typically bullish for a digital asset.
A hack is an event in which an attacker captures a large volume of the asset from a DeFi bridge or hot wallet of an exchange or any other crypto platform via exploits, bugs or other methods. The exploiter then transfers these tokens out of the exchange platforms to ultimately sell or swap the assets for other cryptocurrencies or stablecoins. Such events often involve an en masse panic triggering a sell-off in the affected assets.
Macroeconomic events like the US Federal Reserve’s decision on interest rates influence crypto assets mainly through the direct impact they have on the US Dollar. An increase in interest rate typically negatively influences Bitcoin and altcoin prices, and vice versa. If the US Dollar index declines, risk assets and associated leverage for trading gets cheaper, in turn driving crypto prices higher.
Halvings are typically considered bullish events as they slash the block reward in half for miners, constricting the supply of the asset. At consistent demand if the supply reduces, the asset’s price climbs.

Higit sa isang milyong user ang umaasa sa FXStreet para sa real-time market data, charting tools, expert insights, at Forex news. Ang komprehensibong economic calendar at educational webinars nito ay tumutulong sa mga trader na manatiling may alam at gumawa ng kalkuladong mga desisyon. Sinusuportahan ang FXStreet ng humigit-kumulang 60 propesyonal sa pagitan ng Barcelona HQ at iba’t ibang rehiyon sa buong mundo.
Magbasa pa


