
Top 3 Price Prediction: Bitcoin, Ethereum, Ripple – BTC remains vulnerable, ETH weakens further, XRP signals more downside
Ni Manish Chhetri
Na-update: 10 Jun 2026


Sikat na Artikulo

Bitcoin (BTC), Ethereum (ETH), and Ripple (XRP) remain under pressure mid-week, as the broader cryptocurrency market struggles to regain recovery momentum after last week’s massive correction.
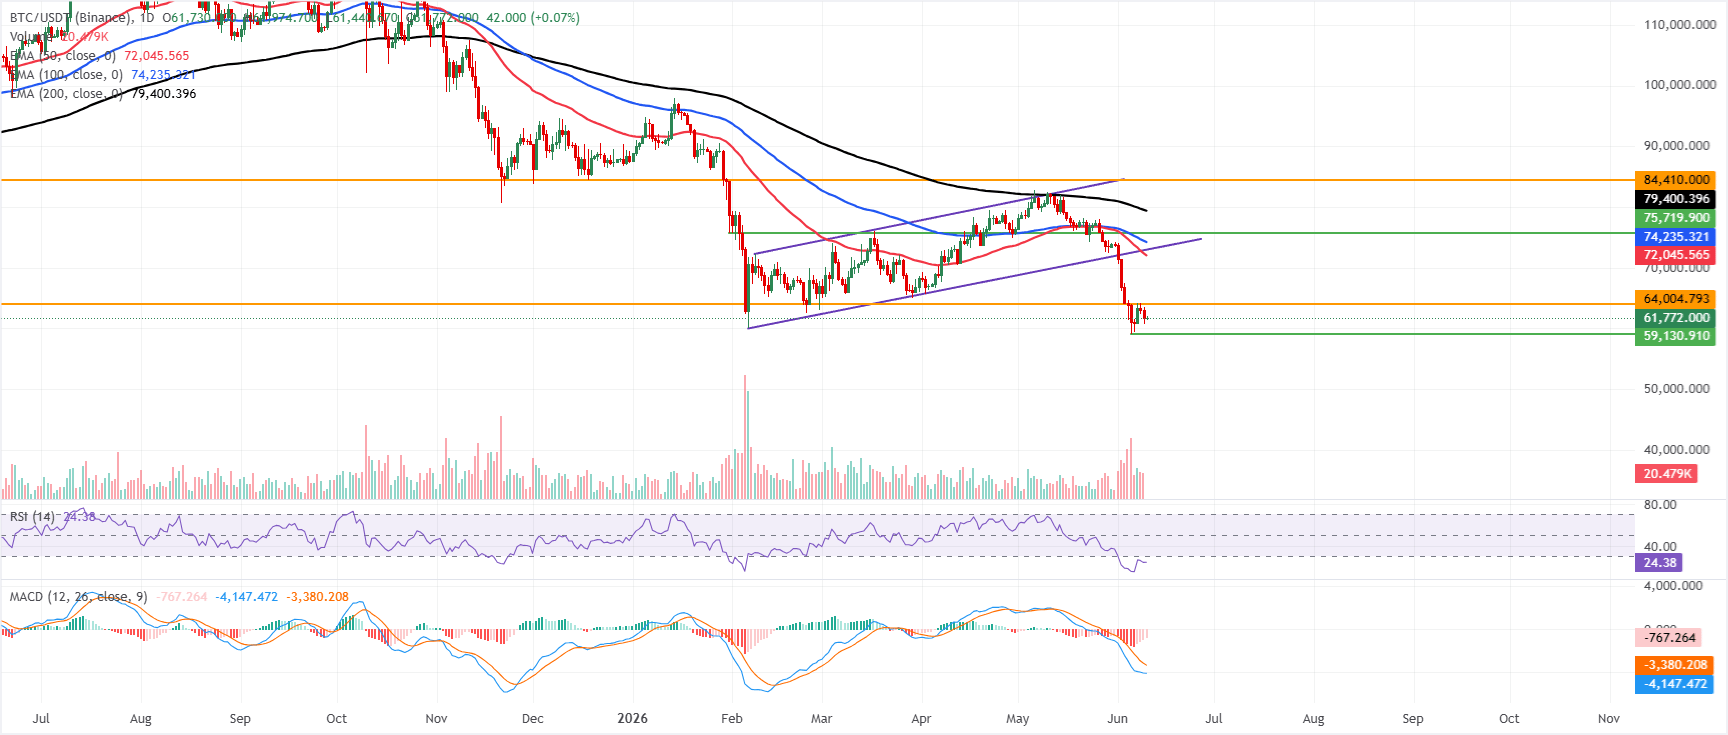
- Bitcoin remains under pressure, trading below $62,000 on Wednesday after correcting 2.5% in the previous two days.
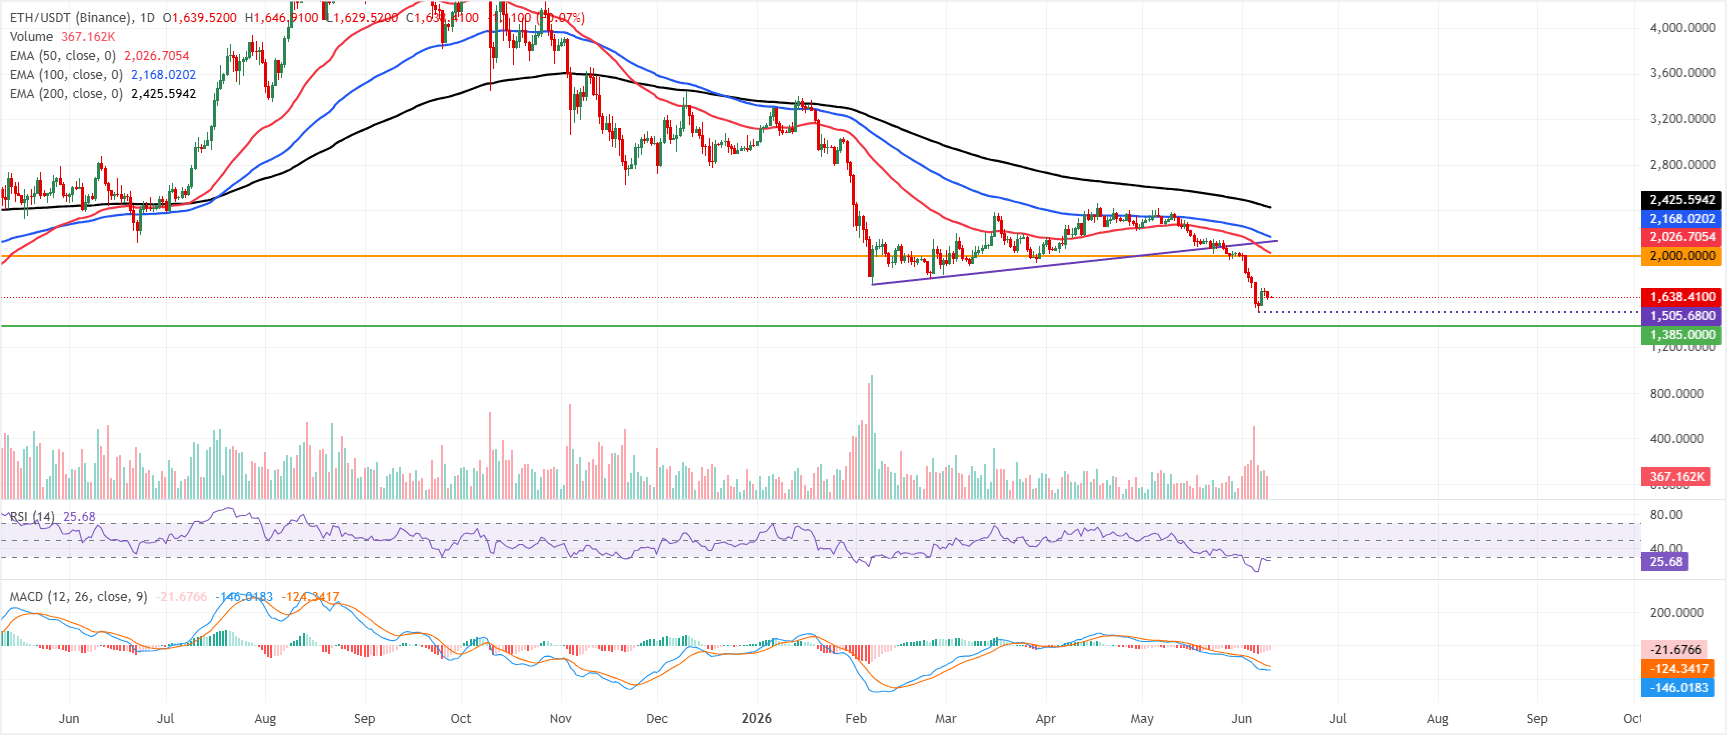
- Ethereum continues its losses, trading below $1,650.
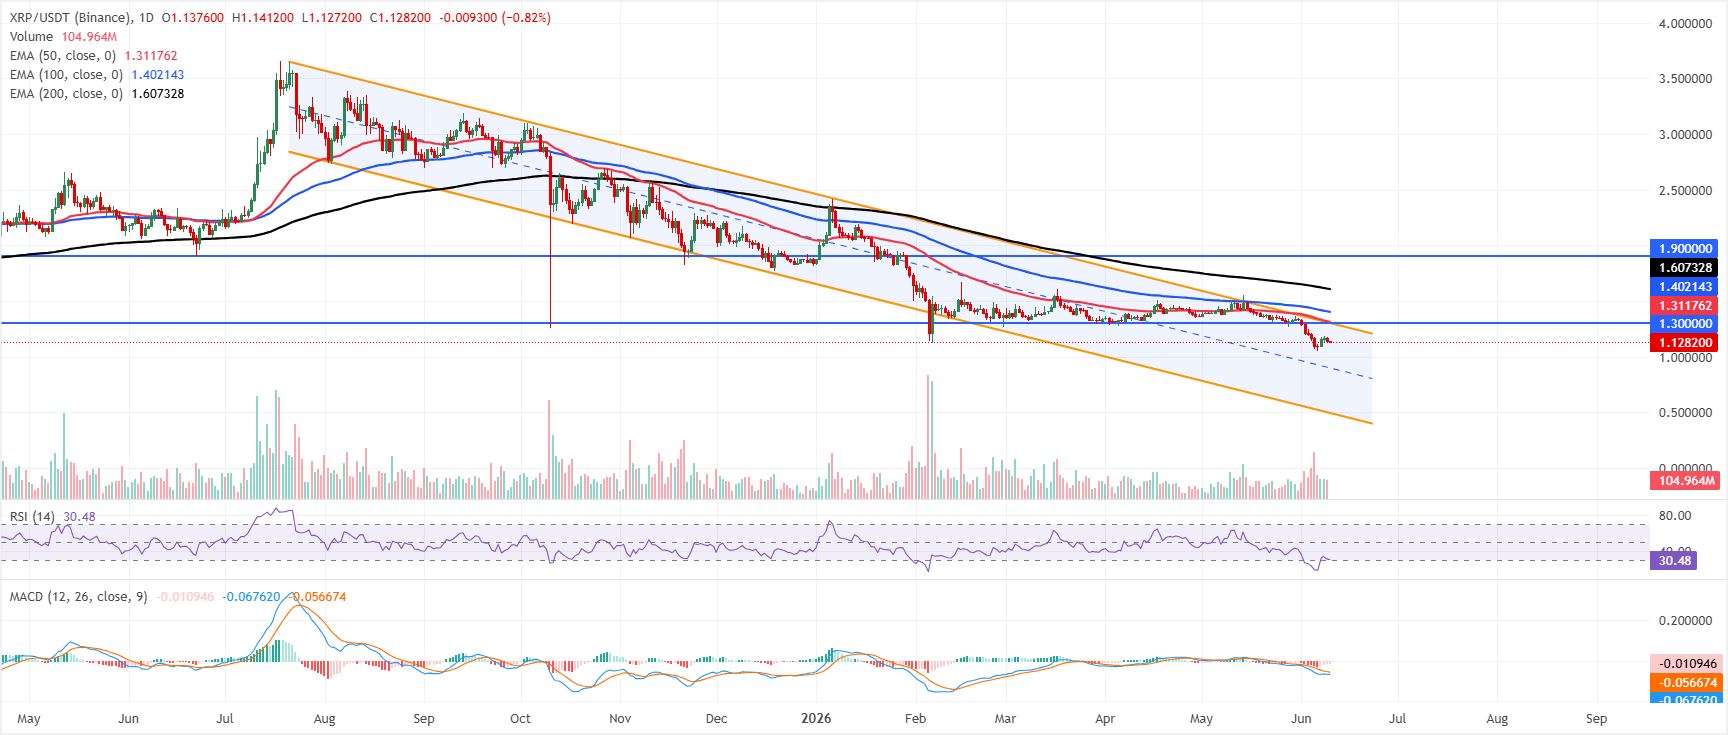
- XRP remains under selling pressure, with momentum indicators favoring further downside.
Bitcoin (BTC), Ethereum (ETH), and Ripple (XRP) remain under pressure mid-week, as the broader cryptocurrency market struggles to regain recovery momentum after last week’s massive correction. BTC struggles below $62,000, ETH continues to weaken below $1,650, while XRP’s momentum indicators remain biased toward further downside.
Bitcoin downtrend deepens as sellers dominate
Bitcoin price trades at $61,778 on Wednesday, extending a decisive bearish phase, with the price remaining well below the 50-day, 100-day, and 200-day Exponential Moving Averages (EMAs). The reclaim of the former horizontal barrier at $64,004 has failed, leaving BTC entrenched below a dense band of overhead supply. At the same time, the break of the previously rising trendline support around $72,981 now reinforces the downside bias.
The Relative Strength Index (RSI) hovers near oversold territory around 24, and the Moving Average Convergence Divergence (MACD) remains deeply negative, which together suggests persistent downside pressure, even if the pace of losses could become more erratic at such depressed momentum levels.
On the topside, initial resistance is now seen at the reclaimed horizontal level near $64,004, with the 50-day EMA at $72,045 and the broken ascending trendline around $72,981 forming the next key supply zone. Above, the 100-day EMA at $74,235 and the 200-day EMA at $79,400 form a broader bearish barrier, ahead of major horizontal resistance at $84,410.
With no clear technical support from moving averages or structural lines in the immediate vicinity of the current price, any further downside would likely seek a new floor below $61,778, leaving the pair vulnerable to additional liquidation until buyers are willing to step back in size.
Ethereum sellers target lower support levels
Ethereum price trades at $1,638 on Wednesday, maintaining a clear bearish bias and remaining well below the 50-day, 100-day, and 200-day EMAs at $2,026, $2,168, and $2,425, respectively. The RSI on the daily chart sits deeply in oversold territory near 25, while the MACD remains negative, which together hints that downside momentum is stretched but not yet decisively reversing.
On the topside, initial resistance aligns with the prior horizontal cap at $2,000, followed by the 50-day EMA at $2,026, then the 100-day EMA at $2,168, with the 200-day EMA near $2,425 reinforcing the broader bearish structure.
On the downside, the nearest notable floor emerges at the horizontal support around $1,385, where any stabilization could coincide with an oversold RSI and a potential moderation of negative MACD readings.
XRP’s weak momentum signals further downside risks
XRP trades at $1.128 on Wednesday, maintaining a clear bearish near-term bias as price remains well below the 50-day, 100-day, and 200-day EMAs, which form layered resistance overhead. The RSI hovers just above the oversold boundary near 30, hinting that downside momentum is stretched but not yet reversing. At the same time, the MACD remains negative and below its signal line, reinforcing persistent selling pressure.
On the topside, initial resistance is seen around the psychologically important 1.300 level, reinforced by the nearby parallel-channel boundary at 1.301 and the 50-day EMA at $1.311, forming a dense cap that bulls would need to reclaim to ease immediate pressure. Above that cluster, the 100-day EMA at $1.402 and the 200-day EMA near $1.607 emerge as successive barriers before the more distant horizontal resistance zone around $1.900, keeping rallies vulnerable while price trades beneath this stacked resistance structure and leaving the chart without a clear support reference below current levels.
(The technical analysis of this story was written with the help of an AI tool.)
Cryptocurrency prices FAQs
Token launches influence demand and adoption among market participants. Listings on crypto exchanges deepen the liquidity for an asset and add new participants to an asset’s network. This is typically bullish for a digital asset.
A hack is an event in which an attacker captures a large volume of the asset from a DeFi bridge or hot wallet of an exchange or any other crypto platform via exploits, bugs or other methods. The exploiter then transfers these tokens out of the exchange platforms to ultimately sell or swap the assets for other cryptocurrencies or stablecoins. Such events often involve an en masse panic triggering a sell-off in the affected assets.
Macroeconomic events like the US Federal Reserve’s decision on interest rates influence crypto assets mainly through the direct impact they have on the US Dollar. An increase in interest rate typically negatively influences Bitcoin and altcoin prices, and vice versa. If the US Dollar index declines, risk assets and associated leverage for trading gets cheaper, in turn driving crypto prices higher.
Halvings are typically considered bullish events as they slash the block reward in half for miners, constricting the supply of the asset. At consistent demand if the supply reduces, the asset’s price climbs.

Higit sa isang milyong user ang umaasa sa FXStreet para sa real-time market data, charting tools, expert insights, at Forex news. Ang komprehensibong economic calendar at educational webinars nito ay tumutulong sa mga trader na manatiling may alam at gumawa ng kalkuladong mga desisyon. Sinusuportahan ang FXStreet ng humigit-kumulang 60 propesyonal sa pagitan ng Barcelona HQ at iba’t ibang rehiyon sa buong mundo.
Magbasa pa


