
Top 3 Price Prediction: Bitcoin, Ethereum, Ripple – BTC under pressure, ETH loses key support, XRP momentum weakens
Ni Manish Chhetri
Na-update: 24 Jun 2026


Sikat na Artikulo

Bitcoin (BTC), Ethereum (ETH) and Ripple (XRP) remain under pressure on Wednesday after falling slightly the previous day. BTC trades below $63,000, ETH slips below $1,700, while XRP momentum continues to weaken.
- Bitcoin remains under pressure on Wednesday after falling 2% on the previous day.
- Ethereum slips below $1,700 support, increasing the risk of a deeper correction.
- XRP shows early bearish signals as momentum indicators weaken.
Bitcoin (BTC), Ethereum (ETH) and Ripple (XRP) remain under pressure on Wednesday after falling slightly the previous day. BTC trades below $63,000, ETH slips below $1,700, while XRP momentum continues to weaken. The deteriorating price action in these top three cryptocurrencies suggests a potential continuation of the near-term correction.
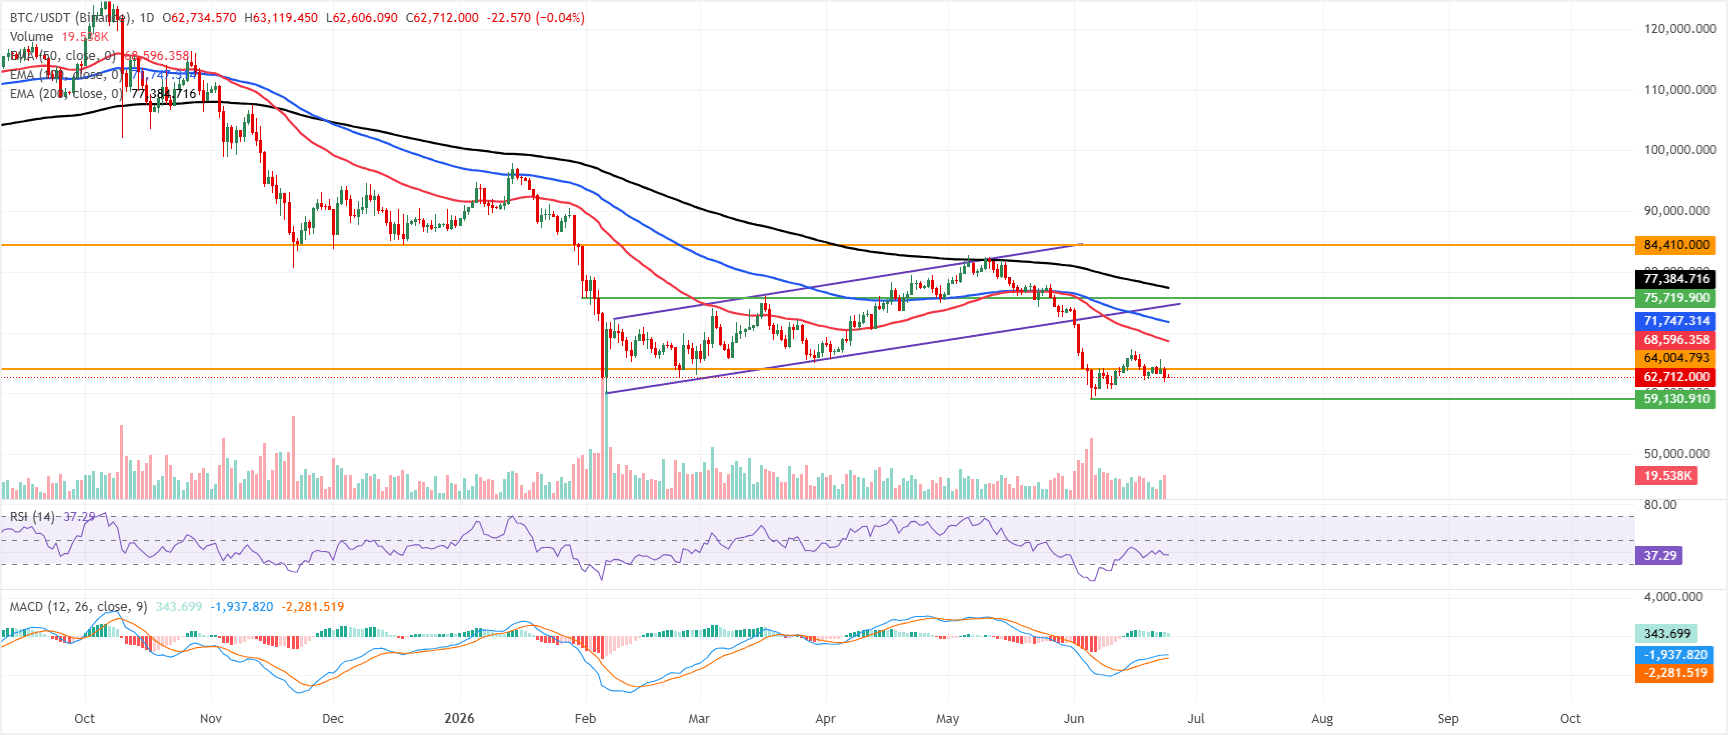
Bitcoin extends its correction
Bitcoin price trades at $62,700 on Wednesday, maintaining a bearish near-term bias as it remains well below the 50-day, 100-day, and 200-day Exponential Moving Averages (EMAs) at roughly $68,596, $71,747, and $77,384, respectively.
The dense cap formed by these overhead EMAs suggests that bounces are likely to be sold into, even as the Relative Strength Index (RSI) stabilizes in mildly oversold territory near 37 and the Moving Average Convergence Divergence (MACD) indicator remains in positive territory, hinting at fading downside momentum rather than a clear bullish reversal.
On the topside, initial resistance is seen at the horizontal level around $64,004, with further barriers at the 50-day EMA near $68,596 and then the 100-day EMA at $71,747; a sustained break above this EMA cluster would be needed to ease the prevailing downside pressure, while the 200-day EMA near $77,384 and the prior horizontal resistance at $84,410 remain medium-term caps.
On the downside, the next notable support is the rising trendline base drawn from around $60,000, and a daily close below this area would expose additional weakness toward lower psychological levels, keeping the broader structure under bearish control.
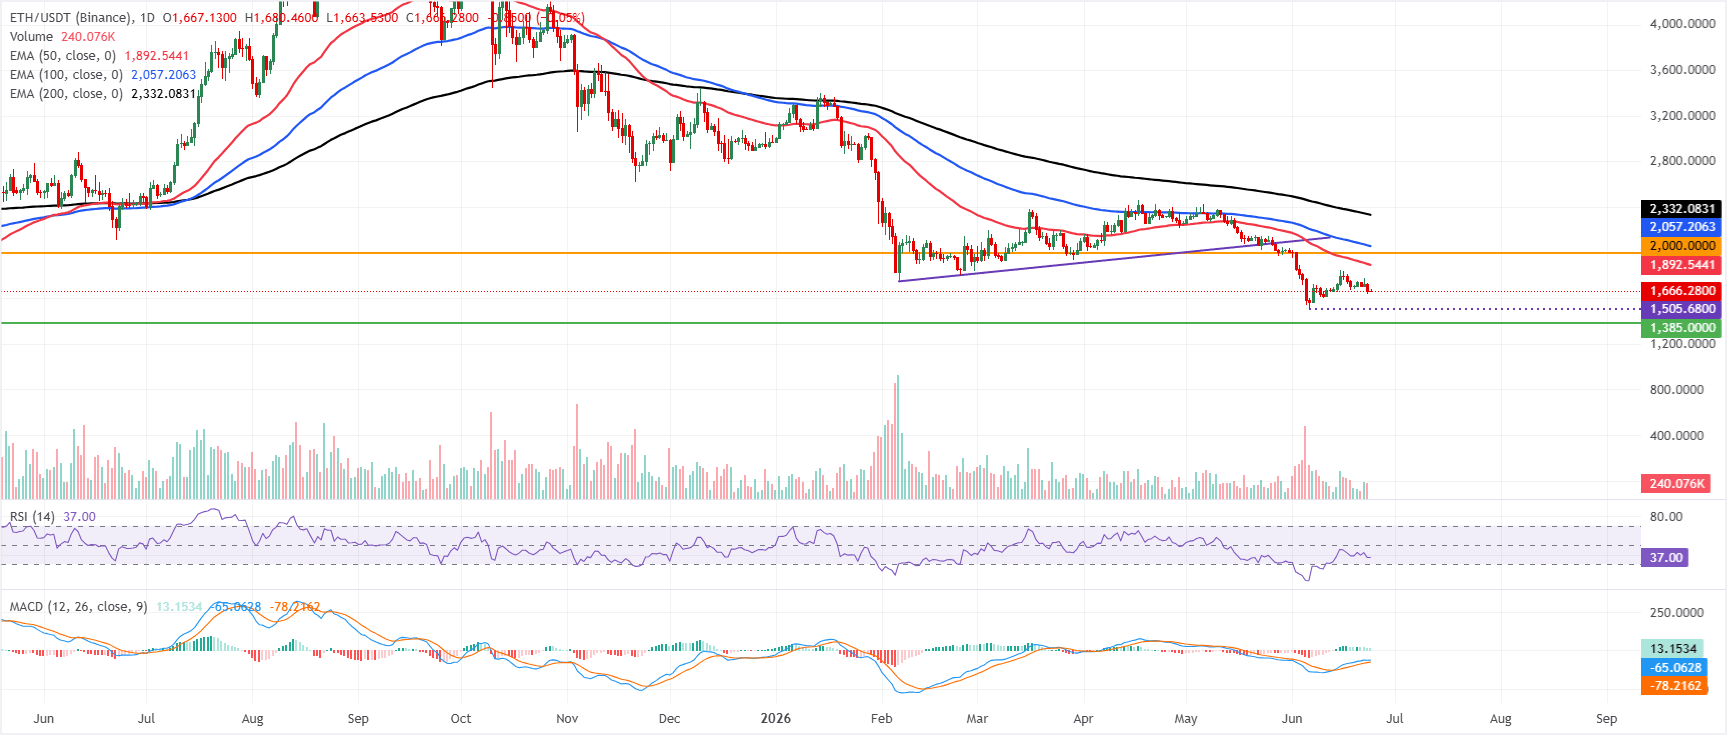
Ethereum slips below the key $1,700 support
Ethereum price trades at $1,666 on Wednesday, retaining a bearish near-term bias as price holds well below the key EMAs. The 50-day EMA is around $1,892, the 100-day EMA near $2,057 and the 200-day EMA at about $2,332 all sit overhead, suggesting that rebounds remain corrective within a broader downtrend.
Momentum is attempting to stabilize, with the RSI hovering near 37 and MACD holding in positive territory, but this improvement has yet to translate into a meaningful reclaim of structural levels.
On the topside, initial resistance is seen at the horizontal barrier near $2,000, ahead of the 50-day EMA at $1,892, which, together with the 100-day EMA at $2,057 and the 200-day EMA at $2,332, defines a dense supply zone that could cap any recovery attempts.
On the downside, the next notable support does not appear until the prior horizontal floor near $1,385, and a daily close below recent lows would expose that area, reinforcing the prevailing bearish structure despite the tentative improvement in momentum indicators.
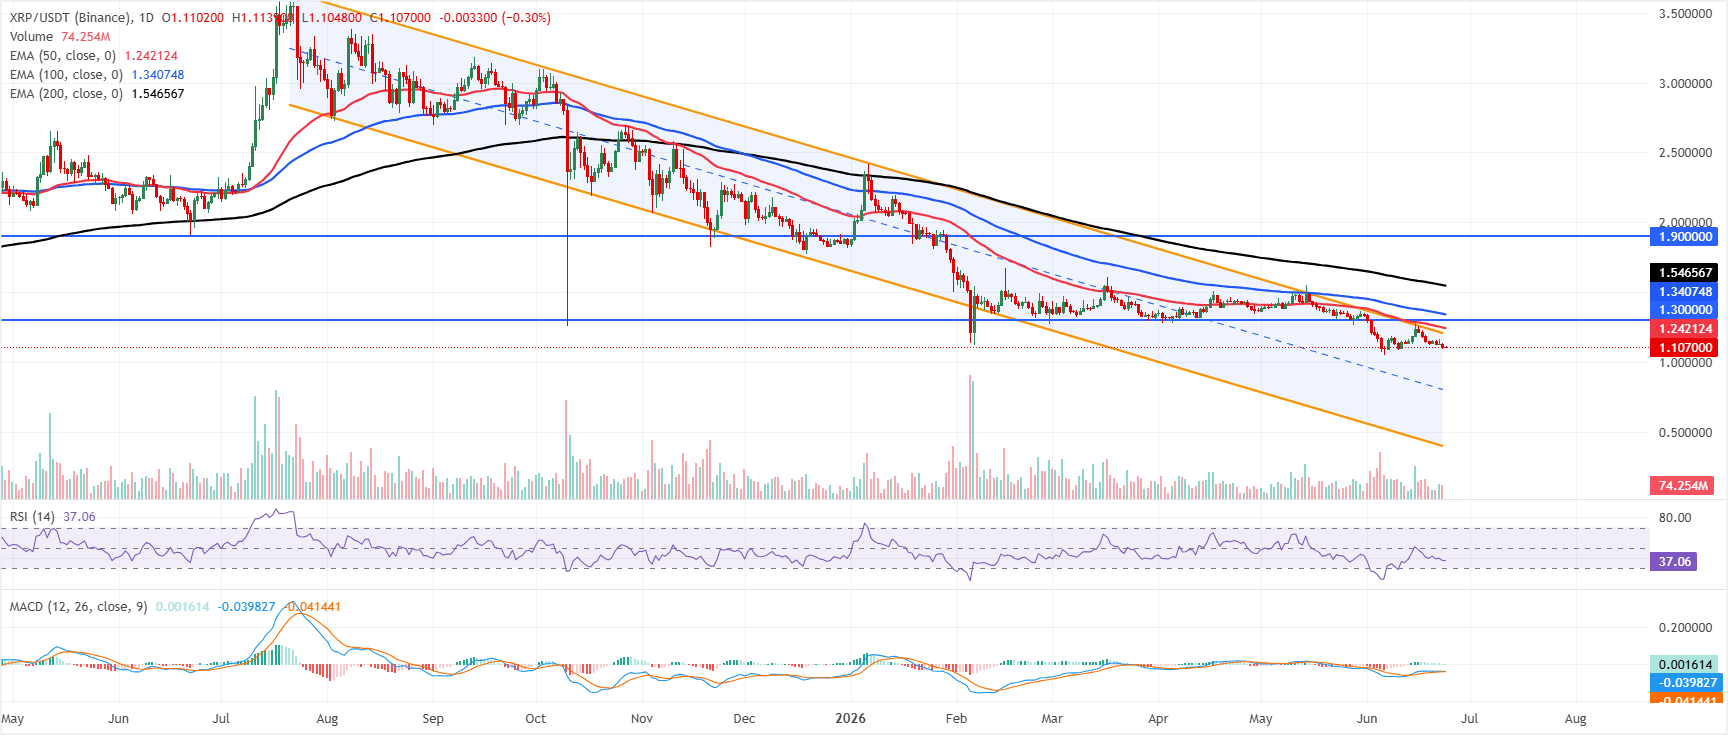
XRP shows early bearish signs in momentum indicators
XRP price trades at $1.1070 on Wednesday, maintaining a bearish near-term bias as it sits well below the 50-day, 100-day, and 200-day EMAs at $1.2421, $1.3407, and $1.5466, respectively.
XRP also holds under the upper boundary of a downward parallel channel near $1.2000 and below the horizontal resistance at $1.3000, suggesting rallies are likely to be capped. At the same time, the RSI lingers in mildly bearish territory around 37, and the MACD indicator flattens just above the zero line, hinting at only tentative upside momentum.
On the topside, initial resistance is located around the channel boundary near $1.2000, followed by the $1.3000 horizontal barrier, before the 50-day EMA at $1.2421 and the 100-day EMA at $1.3407 come into play as additional supply zones, with the 200-day EMA at $1.5466 and the distant $1.9000 horizontal level marking more substantial hurdles. With no clear structural support defined by the indicators below the current price, any renewed selling would leave XRP vulnerable to finding fresh demand at lower levels.
(The technical analysis of this story was written with the help of an AI tool.)
Cryptocurrency prices FAQs
Token launches influence demand and adoption among market participants. Listings on crypto exchanges deepen the liquidity for an asset and add new participants to an asset’s network. This is typically bullish for a digital asset.
A hack is an event in which an attacker captures a large volume of the asset from a DeFi bridge or hot wallet of an exchange or any other crypto platform via exploits, bugs or other methods. The exploiter then transfers these tokens out of the exchange platforms to ultimately sell or swap the assets for other cryptocurrencies or stablecoins. Such events often involve an en masse panic triggering a sell-off in the affected assets.
Macroeconomic events like the US Federal Reserve’s decision on interest rates influence crypto assets mainly through the direct impact they have on the US Dollar. An increase in interest rate typically negatively influences Bitcoin and altcoin prices, and vice versa. If the US Dollar index declines, risk assets and associated leverage for trading gets cheaper, in turn driving crypto prices higher.
Halvings are typically considered bullish events as they slash the block reward in half for miners, constricting the supply of the asset. At consistent demand if the supply reduces, the asset’s price climbs.

Higit sa isang milyong user ang umaasa sa FXStreet para sa real-time market data, charting tools, expert insights, at Forex news. Ang komprehensibong economic calendar at educational webinars nito ay tumutulong sa mga trader na manatiling may alam at gumawa ng kalkuladong mga desisyon. Sinusuportahan ang FXStreet ng humigit-kumulang 60 propesyonal sa pagitan ng Barcelona HQ at iba’t ibang rehiyon sa buong mundo.
Magbasa pa


