
Top 3 Price Prediction: Bitcoin, Ethereum, XRP prepare for a potential New Year rebound
Ni Vishal Dixit
Petsa ng Pag-publish: 31 Dec 2025 | Petsa ng Pag-edit: 31 Dec 2025


Sikat na Artikulo

Bitcoin (BTC), Ethereum (ETH), and Ripple (XRP) are holding steady on Wednesday after recording minor gains on the previous day. Technically, Bitcoin could extend gains within a triangle pattern while Ethereum and Ripple face critical overhead resistance.
- Bitcoin trades above $88,000, extending a lateral move within a symmetrical triangle pattern after a 1.43% rise on Tuesday.
- Ethereum struggles to resurface above $3,000 as an overhead resistance trendline looms.
- Ripple prepares for a potential breakout of a falling wedge pattern after a 1.45% rise on Tuesday.
Bitcoin (BTC), Ethereum (ETH), and Ripple (XRP) are holding steady on Wednesday after recording minor gains on the previous day. Technically, Bitcoin could extend gains within a triangle pattern while Ethereum and Ripple face critical overhead resistance.
Bitcoin’s New Year rebound might be limited
Bitcoin is trading above $88,000 at press time on Wednesday, holding steady after the 1.43% rise on the previous day. The recent fluctuations in BTC indicate a sideways trend within a symmetrical triangle.
A potential rebound from the support area could test the overhead trendline connecting the November 15 and December 9 highs, near $92,000, as well as the 50-day Exponential Moving Average at $91,829.
The momentum indicators on the daily chart support the thesis of a potential recovery. The Relative Strength Index (RSI) is at 48, inching toward the midpoint, suggesting a decline in selling pressure.
Additionally, the Moving Average Convergence Divergence (MACD) rises with its signal line after a crossover on December 19. However, the close moving average lines bear the risk of a bearish crossover, which would trigger a sell signal if BTC price corrects sharply.
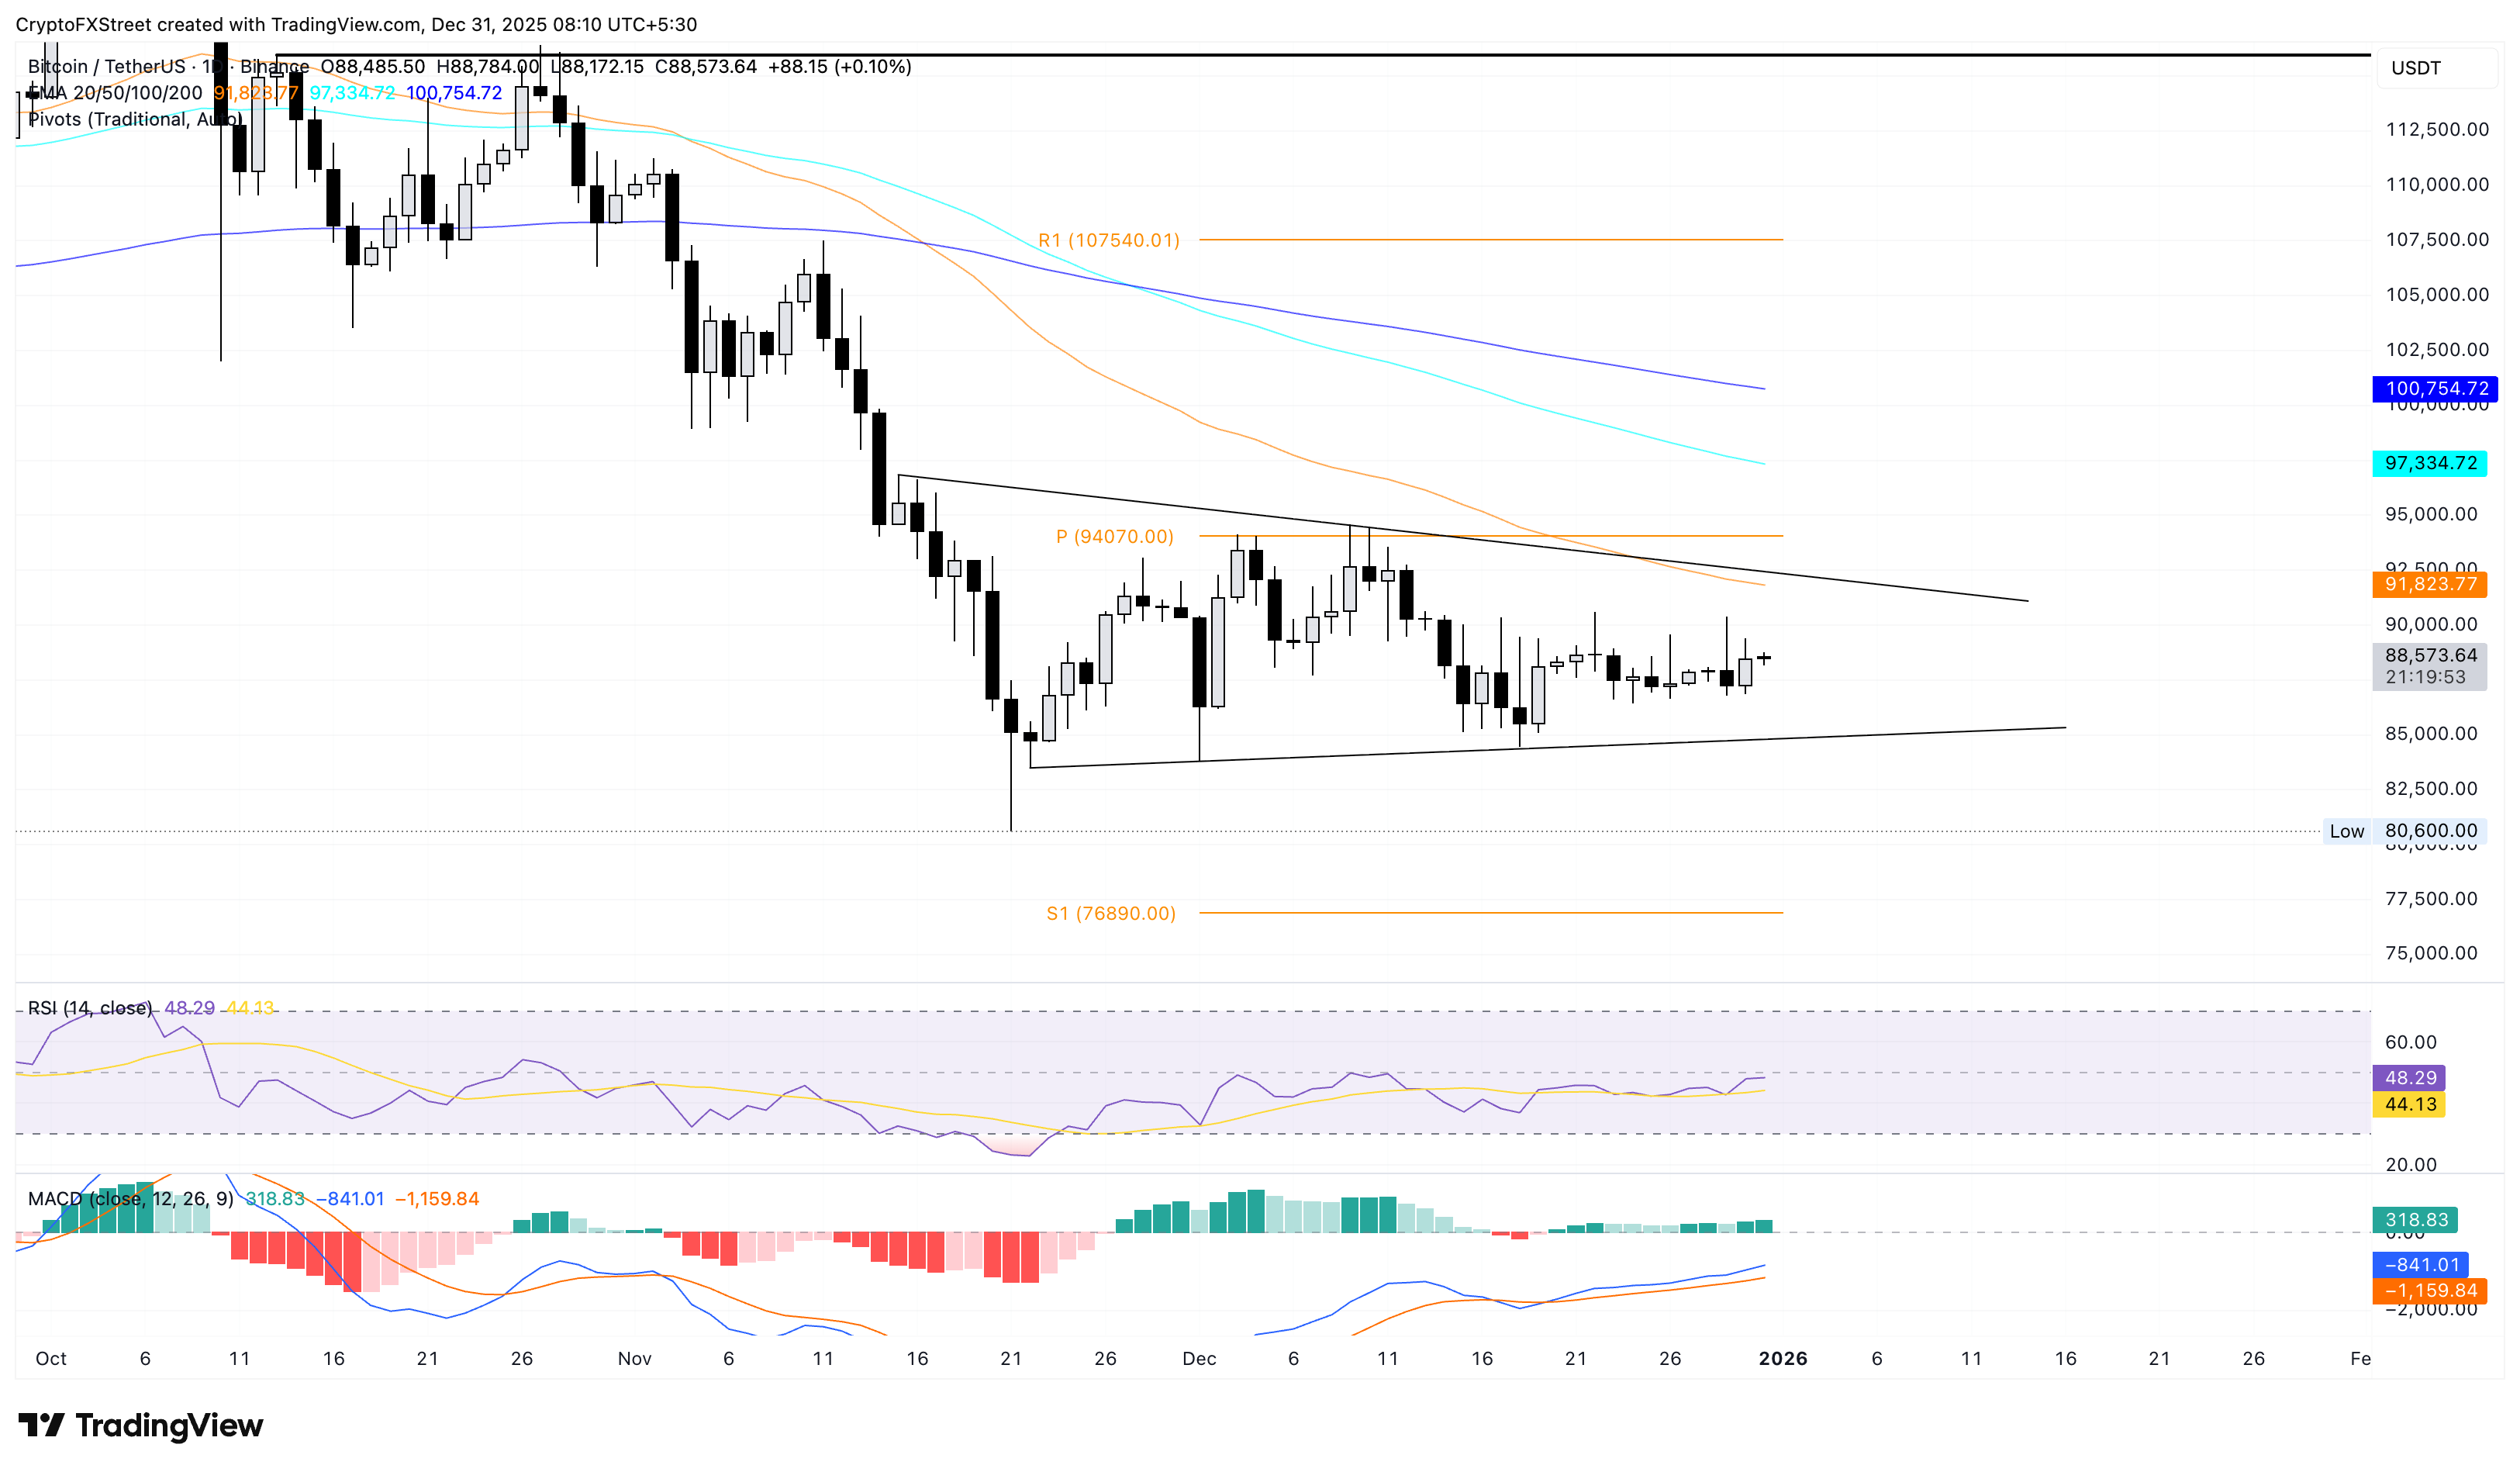
If BTC slips below the support trendline connecting the November 22 and December 1 lows, near $85,000, it could revisit the November 21 low at $80,600.
Ethereum must break this trendline for a New Year rebound
Ethereum faces resistance from an overhead trendline connecting the October 7 and December 10 highs. At the time of writing, Ethereum hovers near $3,000 on Wednesday, retaining the 1.22% gains from the previous day.
If the major altcoin clears the trendline, it could face opposition near the 50-day EMA at $3,120, followed by the R1 Pivot Point at $3,177.
The RSI at 47 remains slightly below the midline as bulls struggle to overcome the bearish pressure. However, the MACD diverging upward from the signal line after a crossover on Saturday sustains the buy indication.
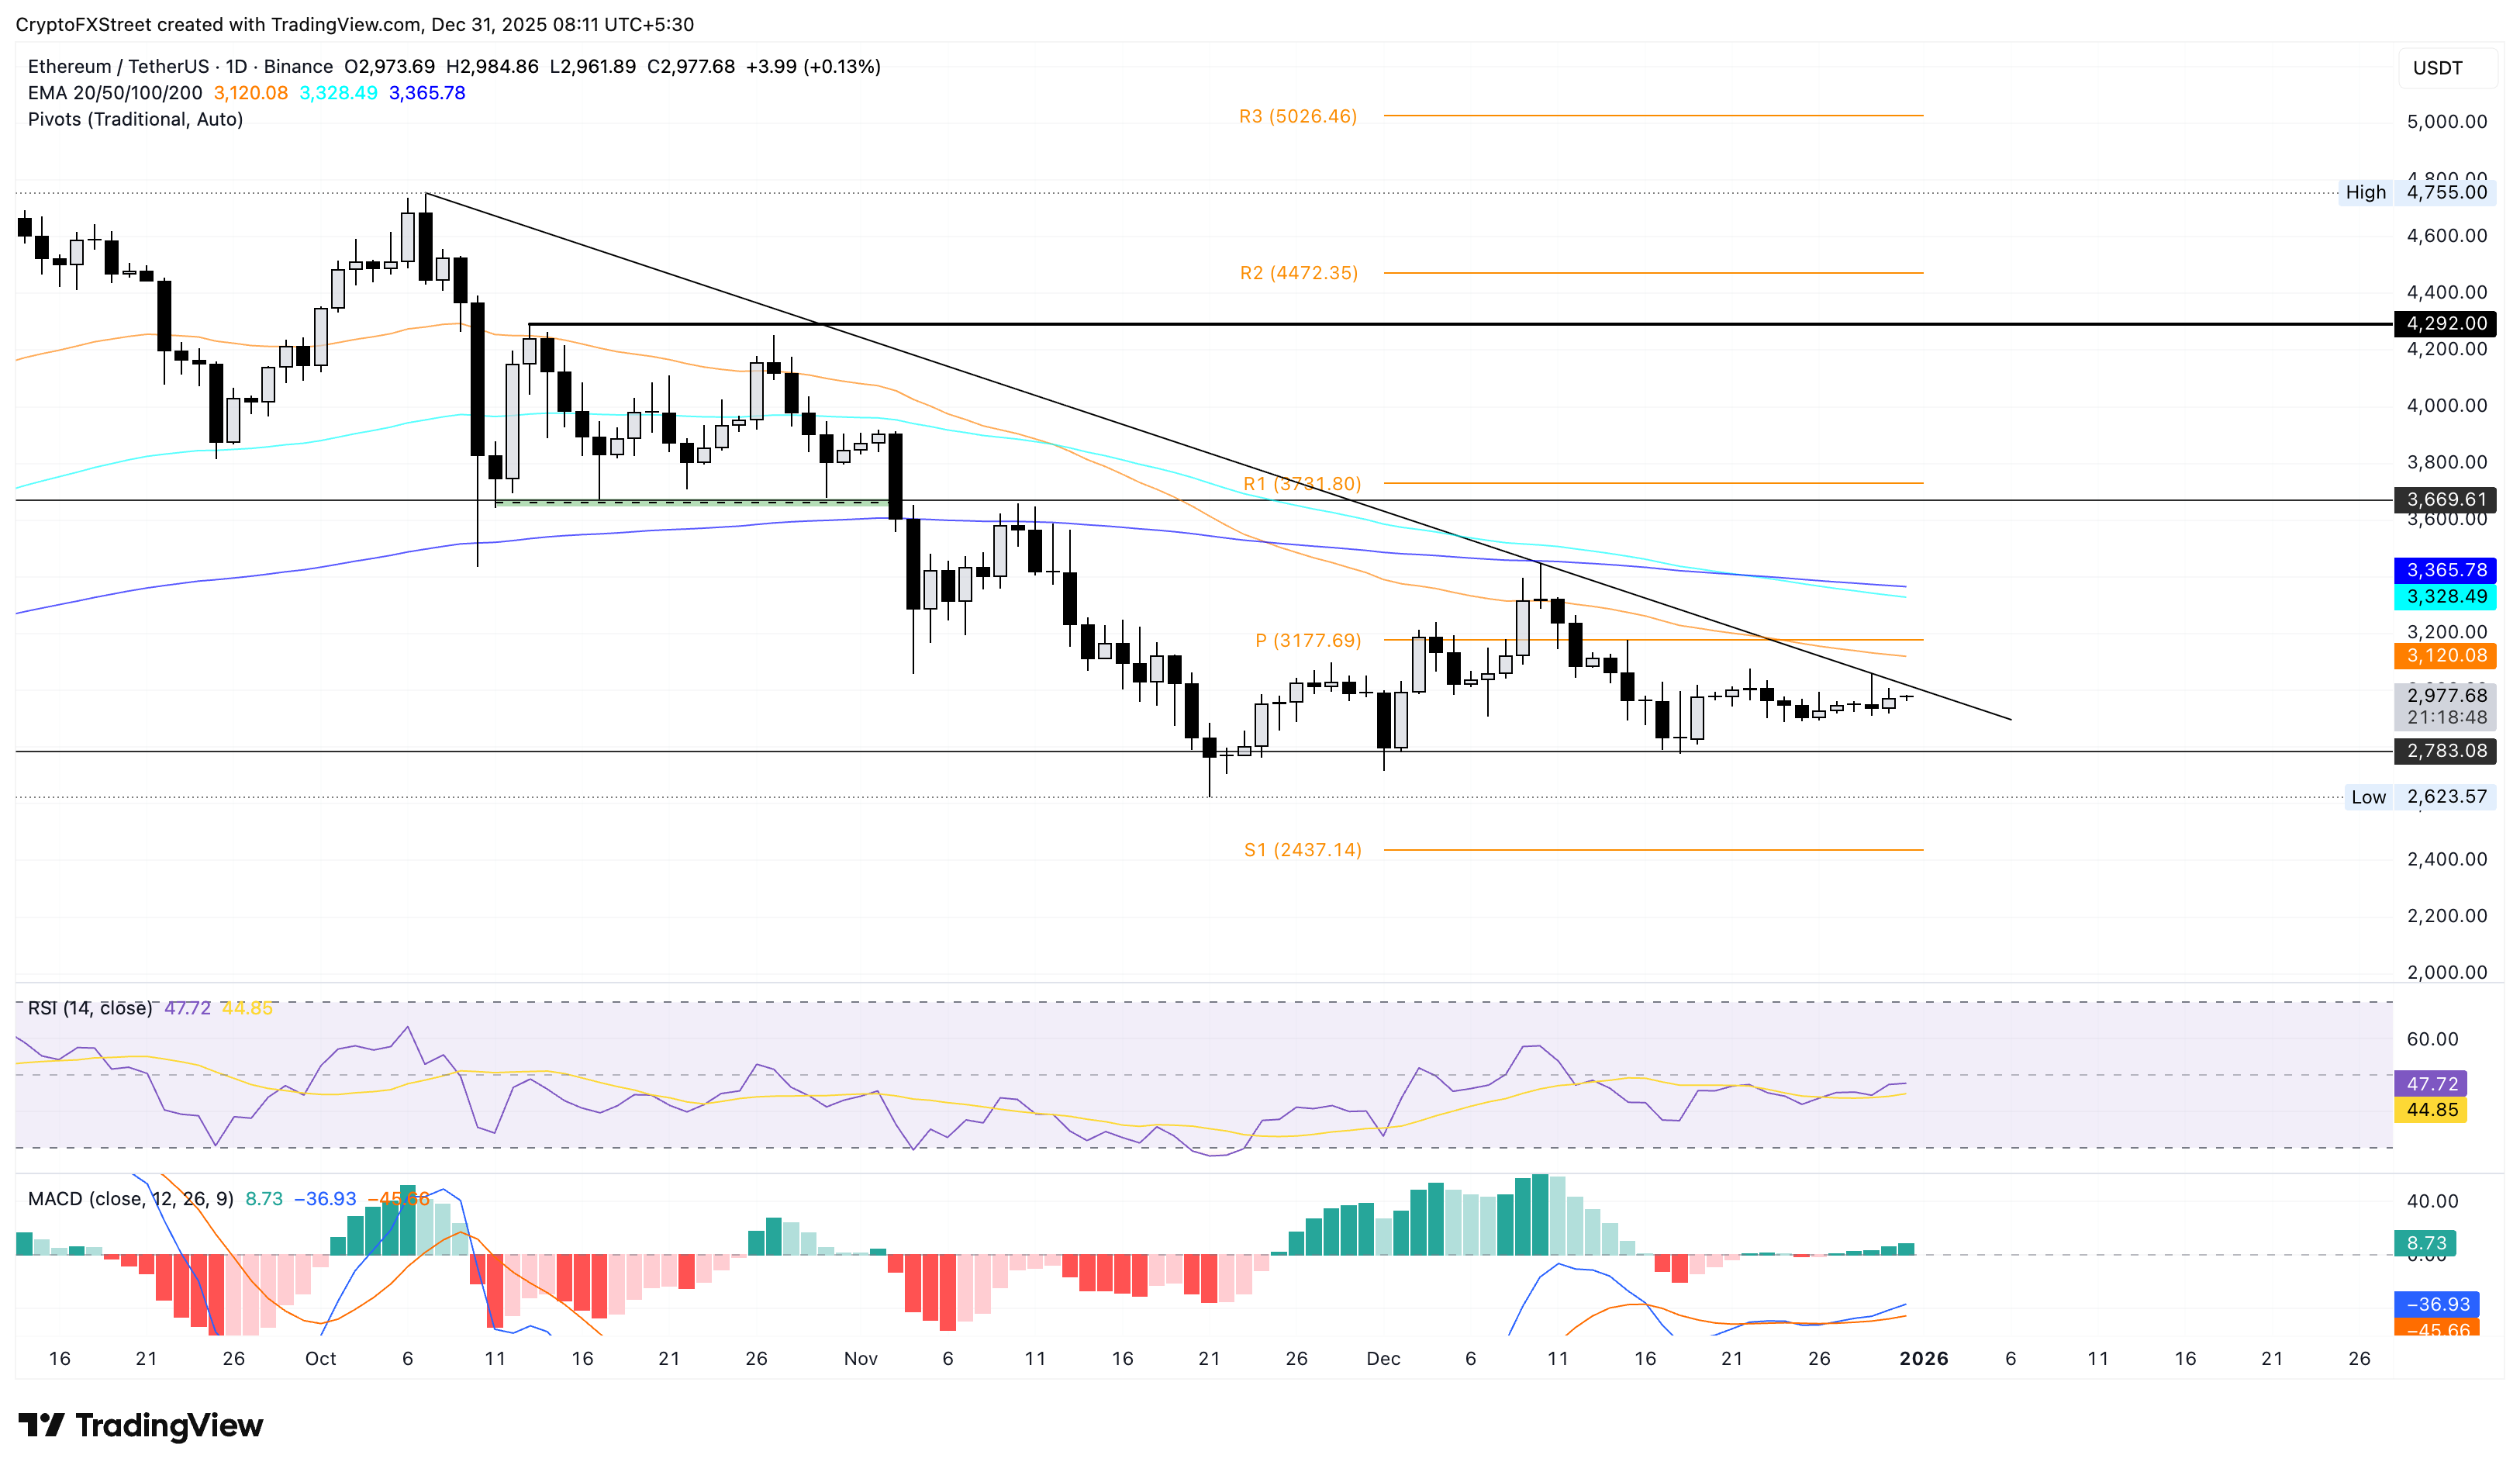
On the flip side, the $2,783 support level, last tested on December 18, could serve as primary support before the November 21 low at $2,623.
Ripple inches closer to breakout of a falling wedge pattern
Similar to Ethereum, Ripple struggles near a resistance trendline connecting the November 13 and December 9 highs, near $1.90. This trendline completes a falling wedge pattern on the daily chart, with a converging support trendline connecting the October 17 and November 4 lows.
If XRP secures a daily close above $1.90, it could confirm a bullish breakout and extend the rally to the 50-day EMA at $2.05.
The RSI is at 42 on the daily chart, maintaining a broadly upward trend after reversing from the oversold boundary on December 18. This suggests a loosening of the bearish grip on XRP, and a move above the halfway line would signal renewed buying pressure.
Additionally, the MACD indicator maintains the buy signal from Saturday's crossover, while successive green histogram bars indicate a rise in bullish momentum.
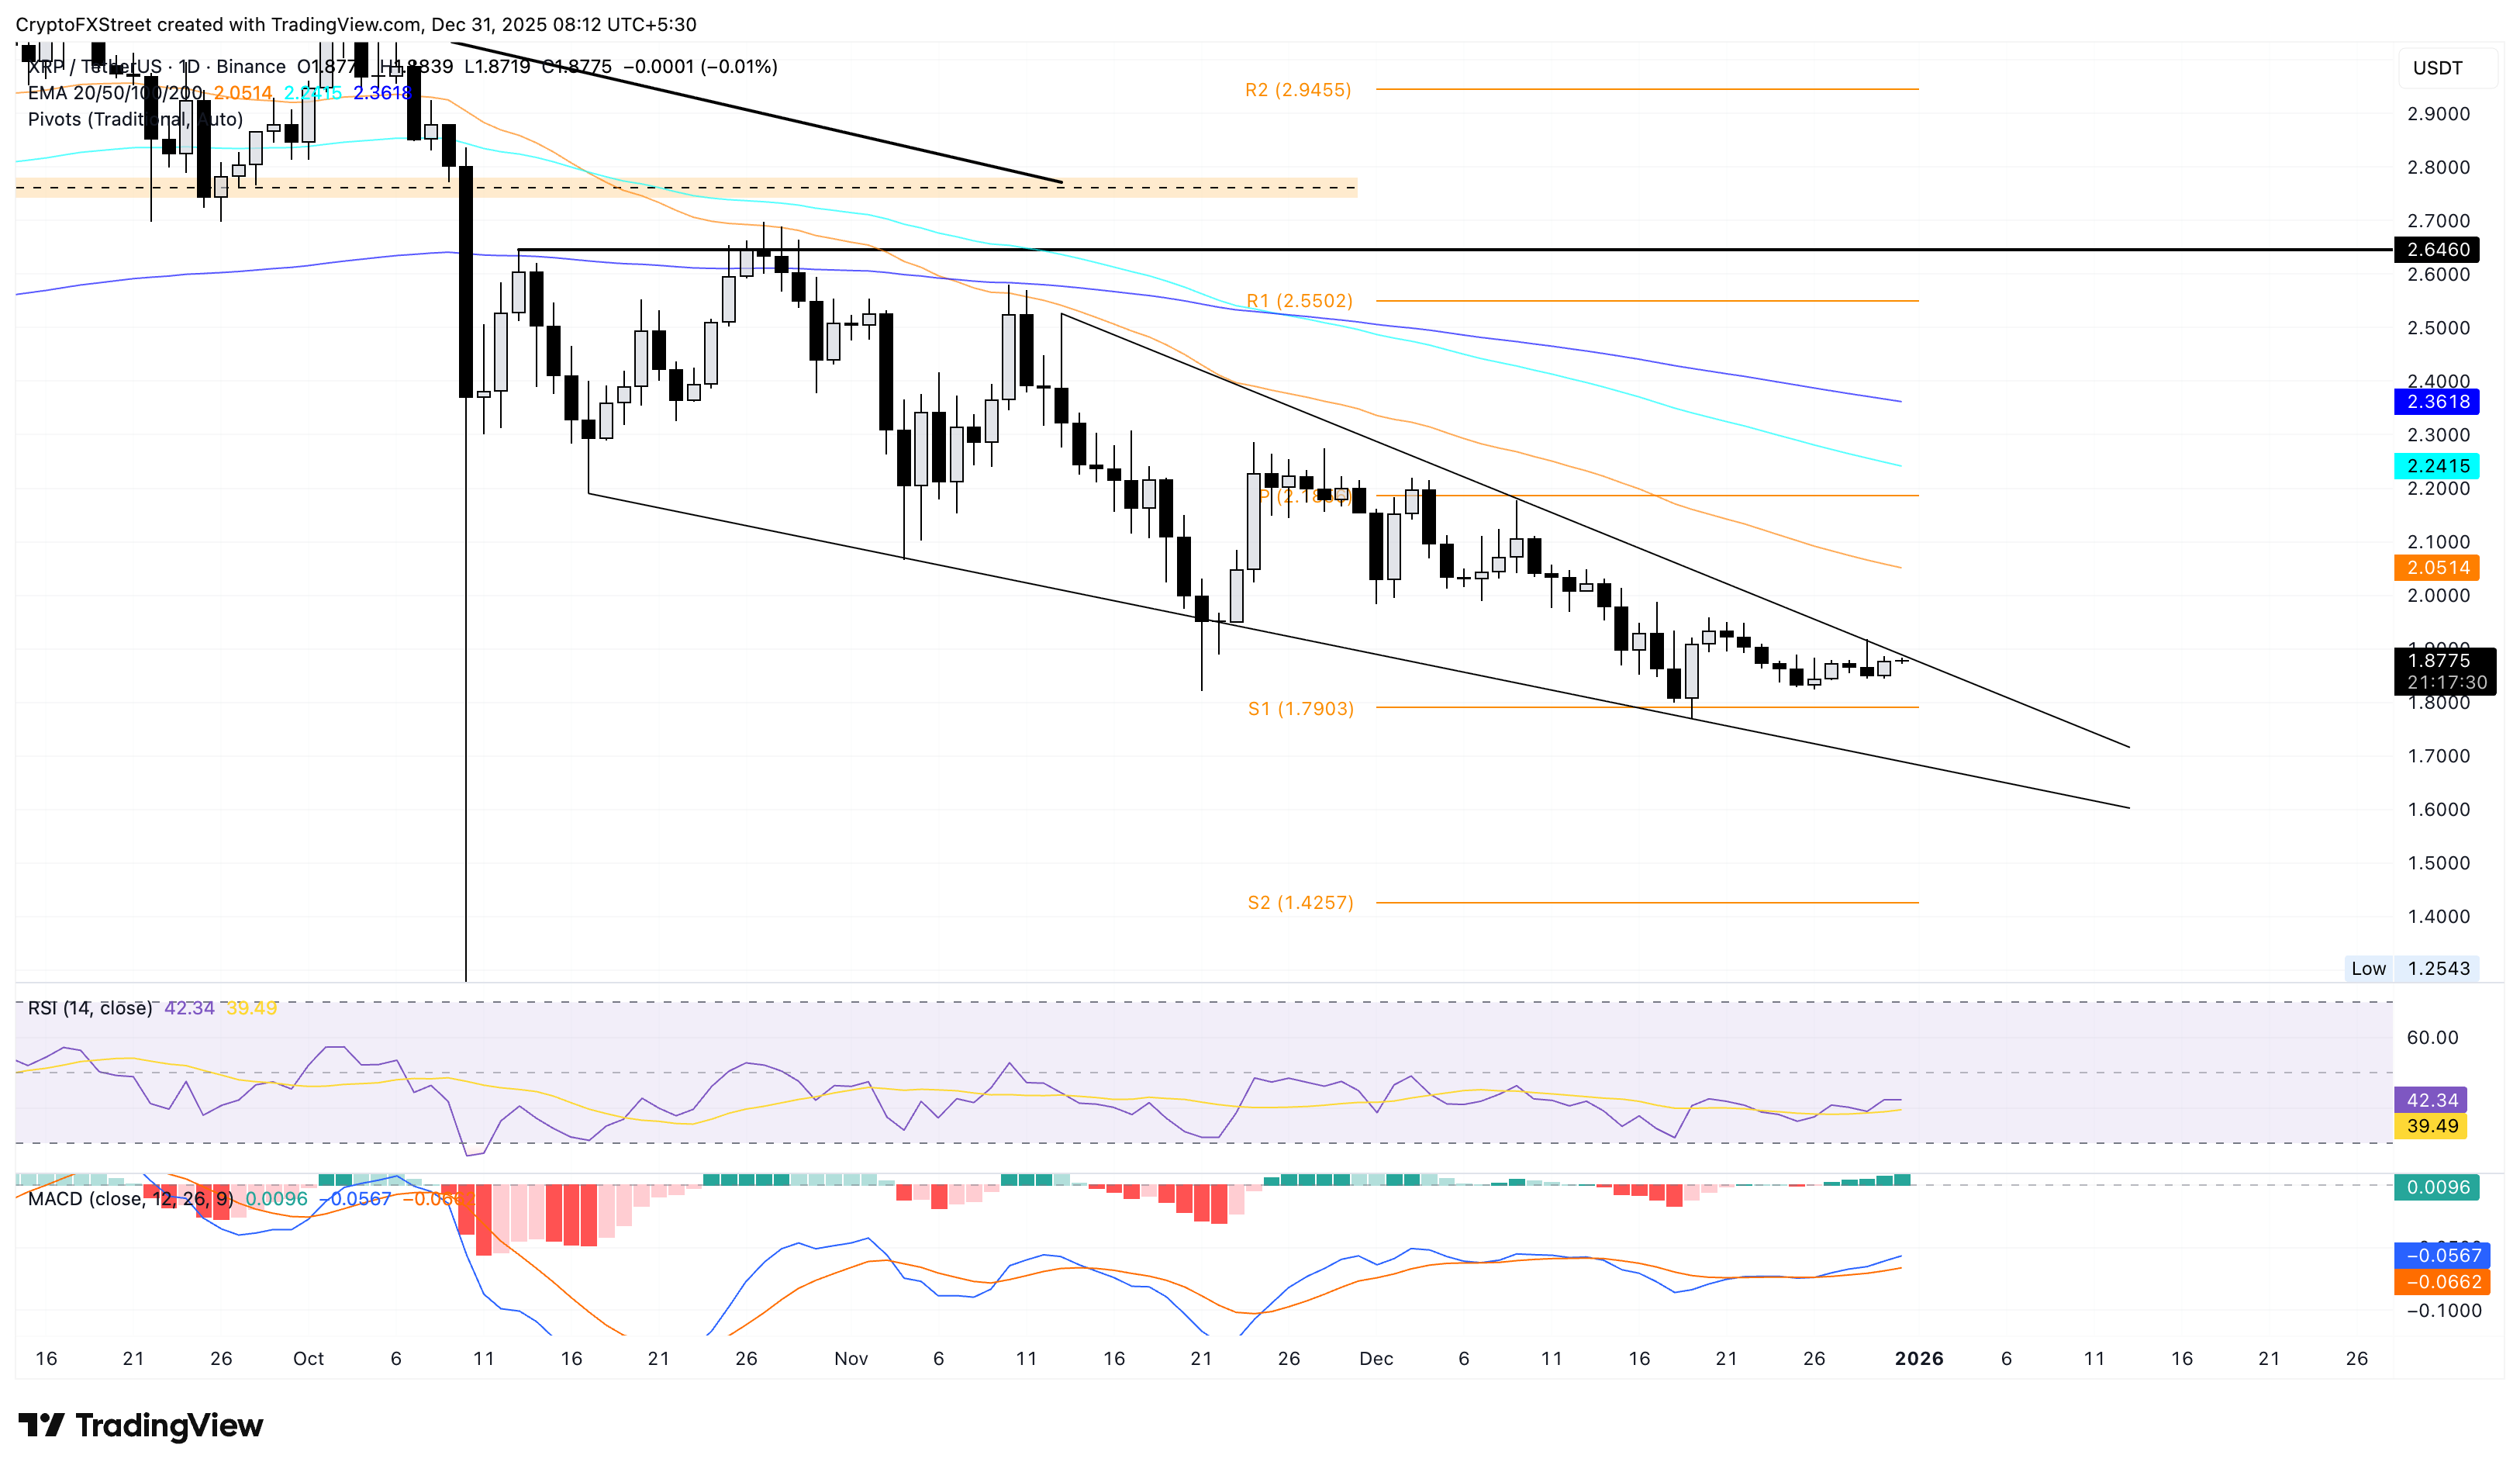
Looking down, if XRP reverses from the $1.90, it could test the S1 Pivot Point at $1.79, followed by the support trendline at $1.68.
(This story was corrected on December 31 at 05:26 GMT to say "November 21 low" instead of "November 21" in the Ethereum price analysis.)

Higit sa isang milyong user ang umaasa sa FXStreet para sa real-time market data, charting tools, expert insights, at Forex news. Ang komprehensibong economic calendar at educational webinars nito ay tumutulong sa mga trader na manatiling may alam at gumawa ng kalkuladong mga desisyon. Sinusuportahan ang FXStreet ng humigit-kumulang 60 propesyonal sa pagitan ng Barcelona HQ at iba’t ibang rehiyon sa buong mundo.
Magbasa pa


