
Top 3 Price Predictions: Bitcoin and Ethereum aim for breakouts as Ripple holds at $2
Ni Vishal Dixit
Petsa ng Pag-publish: 8 Dec 2025 | Petsa ng Pag-edit: 8 Dec 2025


Sikat na Artikulo

Bitcoin (BTC), Ethereum (ETH), and Ripple (XRP) record a minor recovery on Monday, starting the week on a positive note. The retail demand for major cryptocurrencies remains strong despite outflows from Bitcoin and Ethereum Exchange Traded Funds (ETFs).
- Bitcoin trades above $91,000, approaching a local resistance trendline amid strengthening retail demand.
- Ethereum rises above $3,100, with bulls aiming to break the two-month-old resistance trendline.
- Ripple ticks higher by over 1% on Monday, holding the ground at the $2.00 psychological mark.
Bitcoin (BTC), Ethereum (ETH), and Ripple (XRP) record a minor recovery on Monday, starting the week on a positive note. The retail demand for major cryptocurrencies remains strong despite outflows from Bitcoin and Ethereum Exchange Traded Funds (ETFs). The technical outlook for BTC, ETH, and XRP focuses on the key overhead trendline resistance as selling pressure wanes.
Retail demand remains consistent amid mixed ETF inflows
The US spot Bitcoin and Ethereum ETFs recorded mild weekly outflows of $87.77 million and $65.59 million, respectively. This indicates a short-term weakness in institutional support, while the XRP ETFs record $230.74 million in inflows, marking its fourth consecutive positive week.
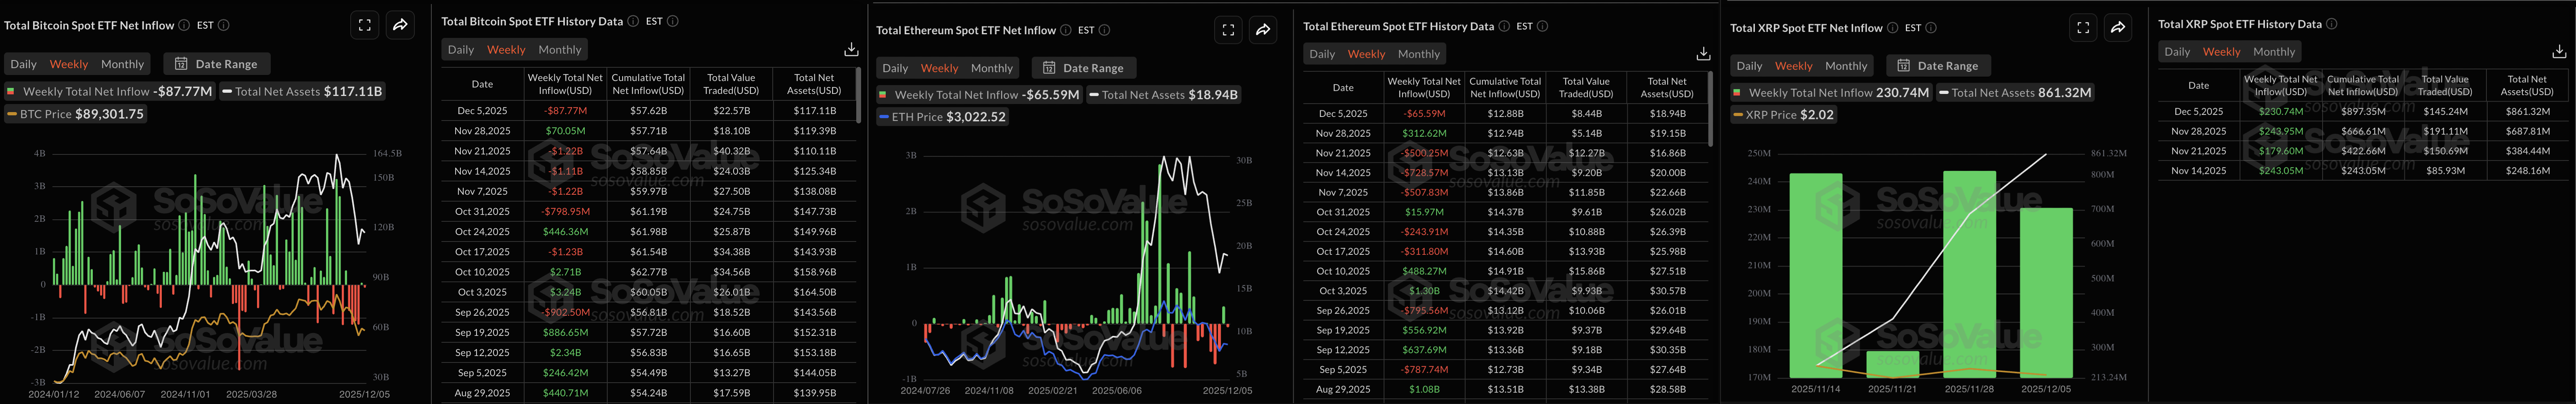
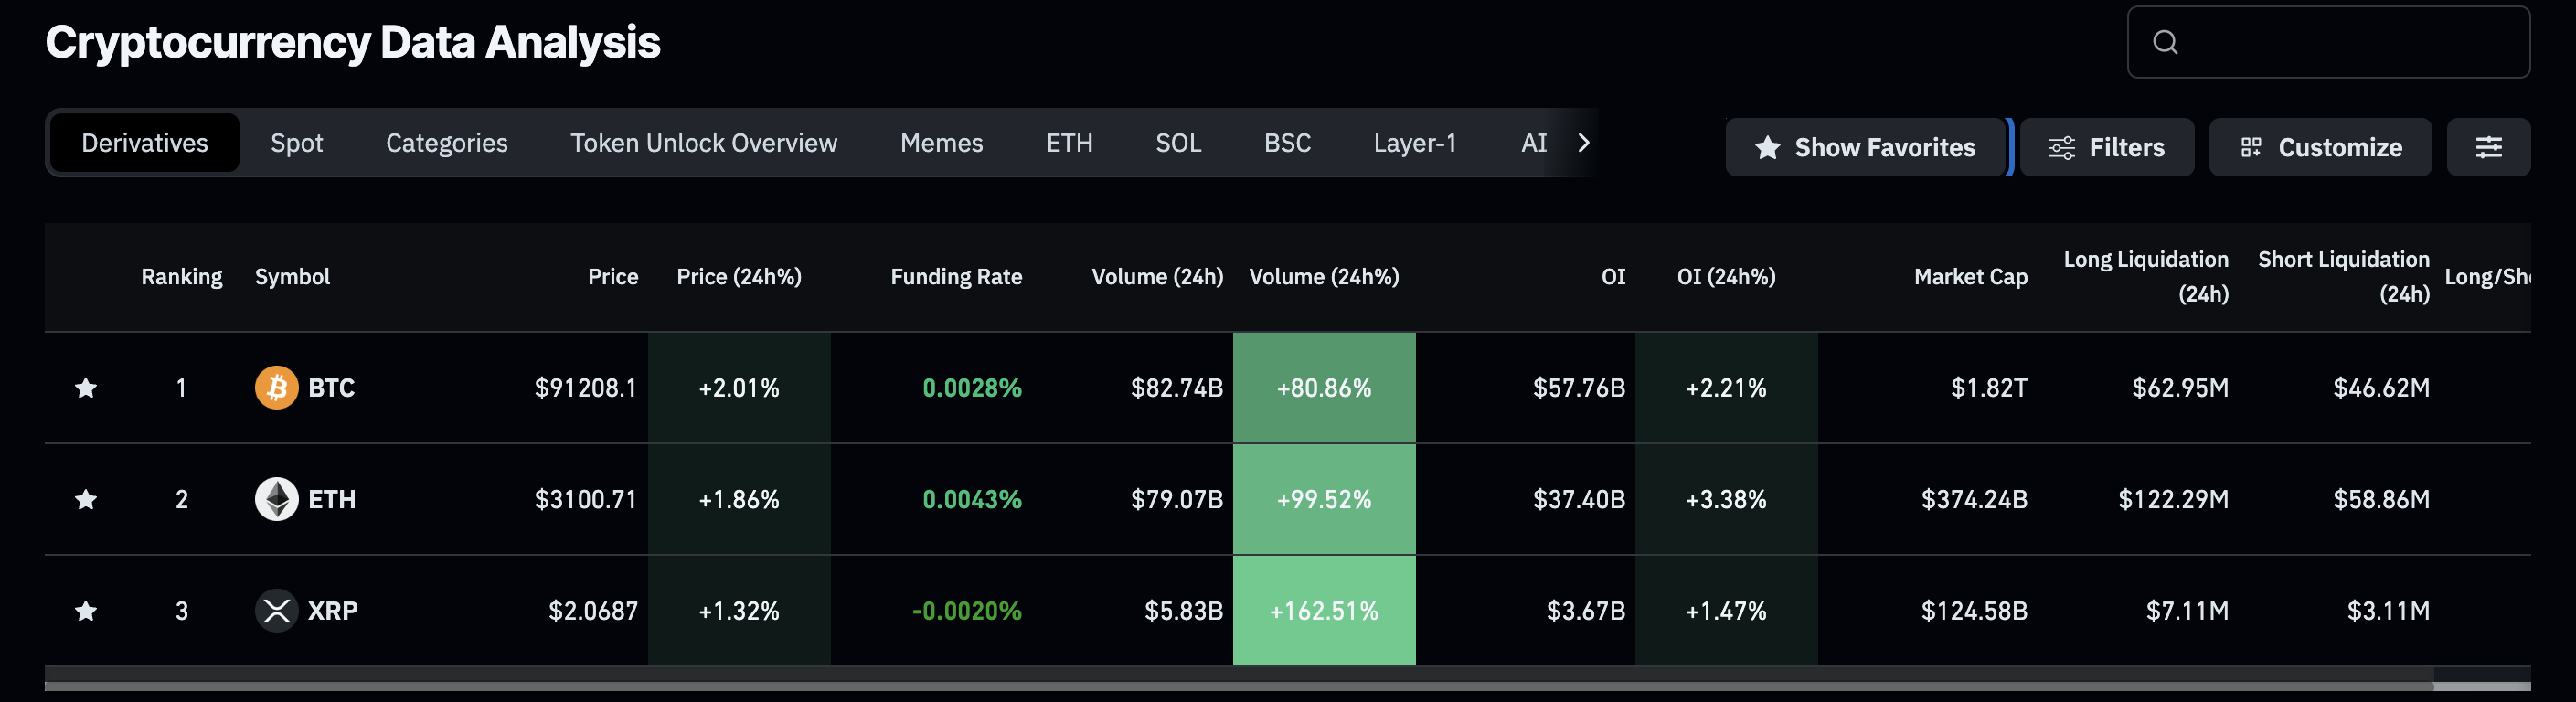
Still, retail demand for Bitcoin, Ethereum, and Ripple remains steady, as rising futures Open Interest (OI) suggests a risk-on sentiment. According to CoinGlass data, the OI for BTC, ETH, and XRP futures has increased by over 2%, 3%, and 1% in the last 24 hours, respectively.
Bitcoin aims to break out of a triangle pattern
Bitcoin is trading above $91,000 at press time on Monday, marking its second straight day of recovery. The recovery run approaches the resistance trendline of a symmetrical triangle pattern on the daily chart, formed by connecting the highs of November 15 and December 3, near $93,500.
A decisive close above this level could confirm the bullish breakout and extend the rally to the 50-day Exponential Moving Average (EMA) at $97,205.
The momentum indicators on the daily chart suggest a gradual bullish shift as selling pressure wanes. The Relative Strength Index (RSI) is at 46, maintaining an upward trend toward the halfway line. A steady increase above the midline would open further space for growth before reaching the overbought zone.
At the same time, the Moving Average Convergence Divergence (MACD) and the signal line keep a steady rise, aiming for the zero line.
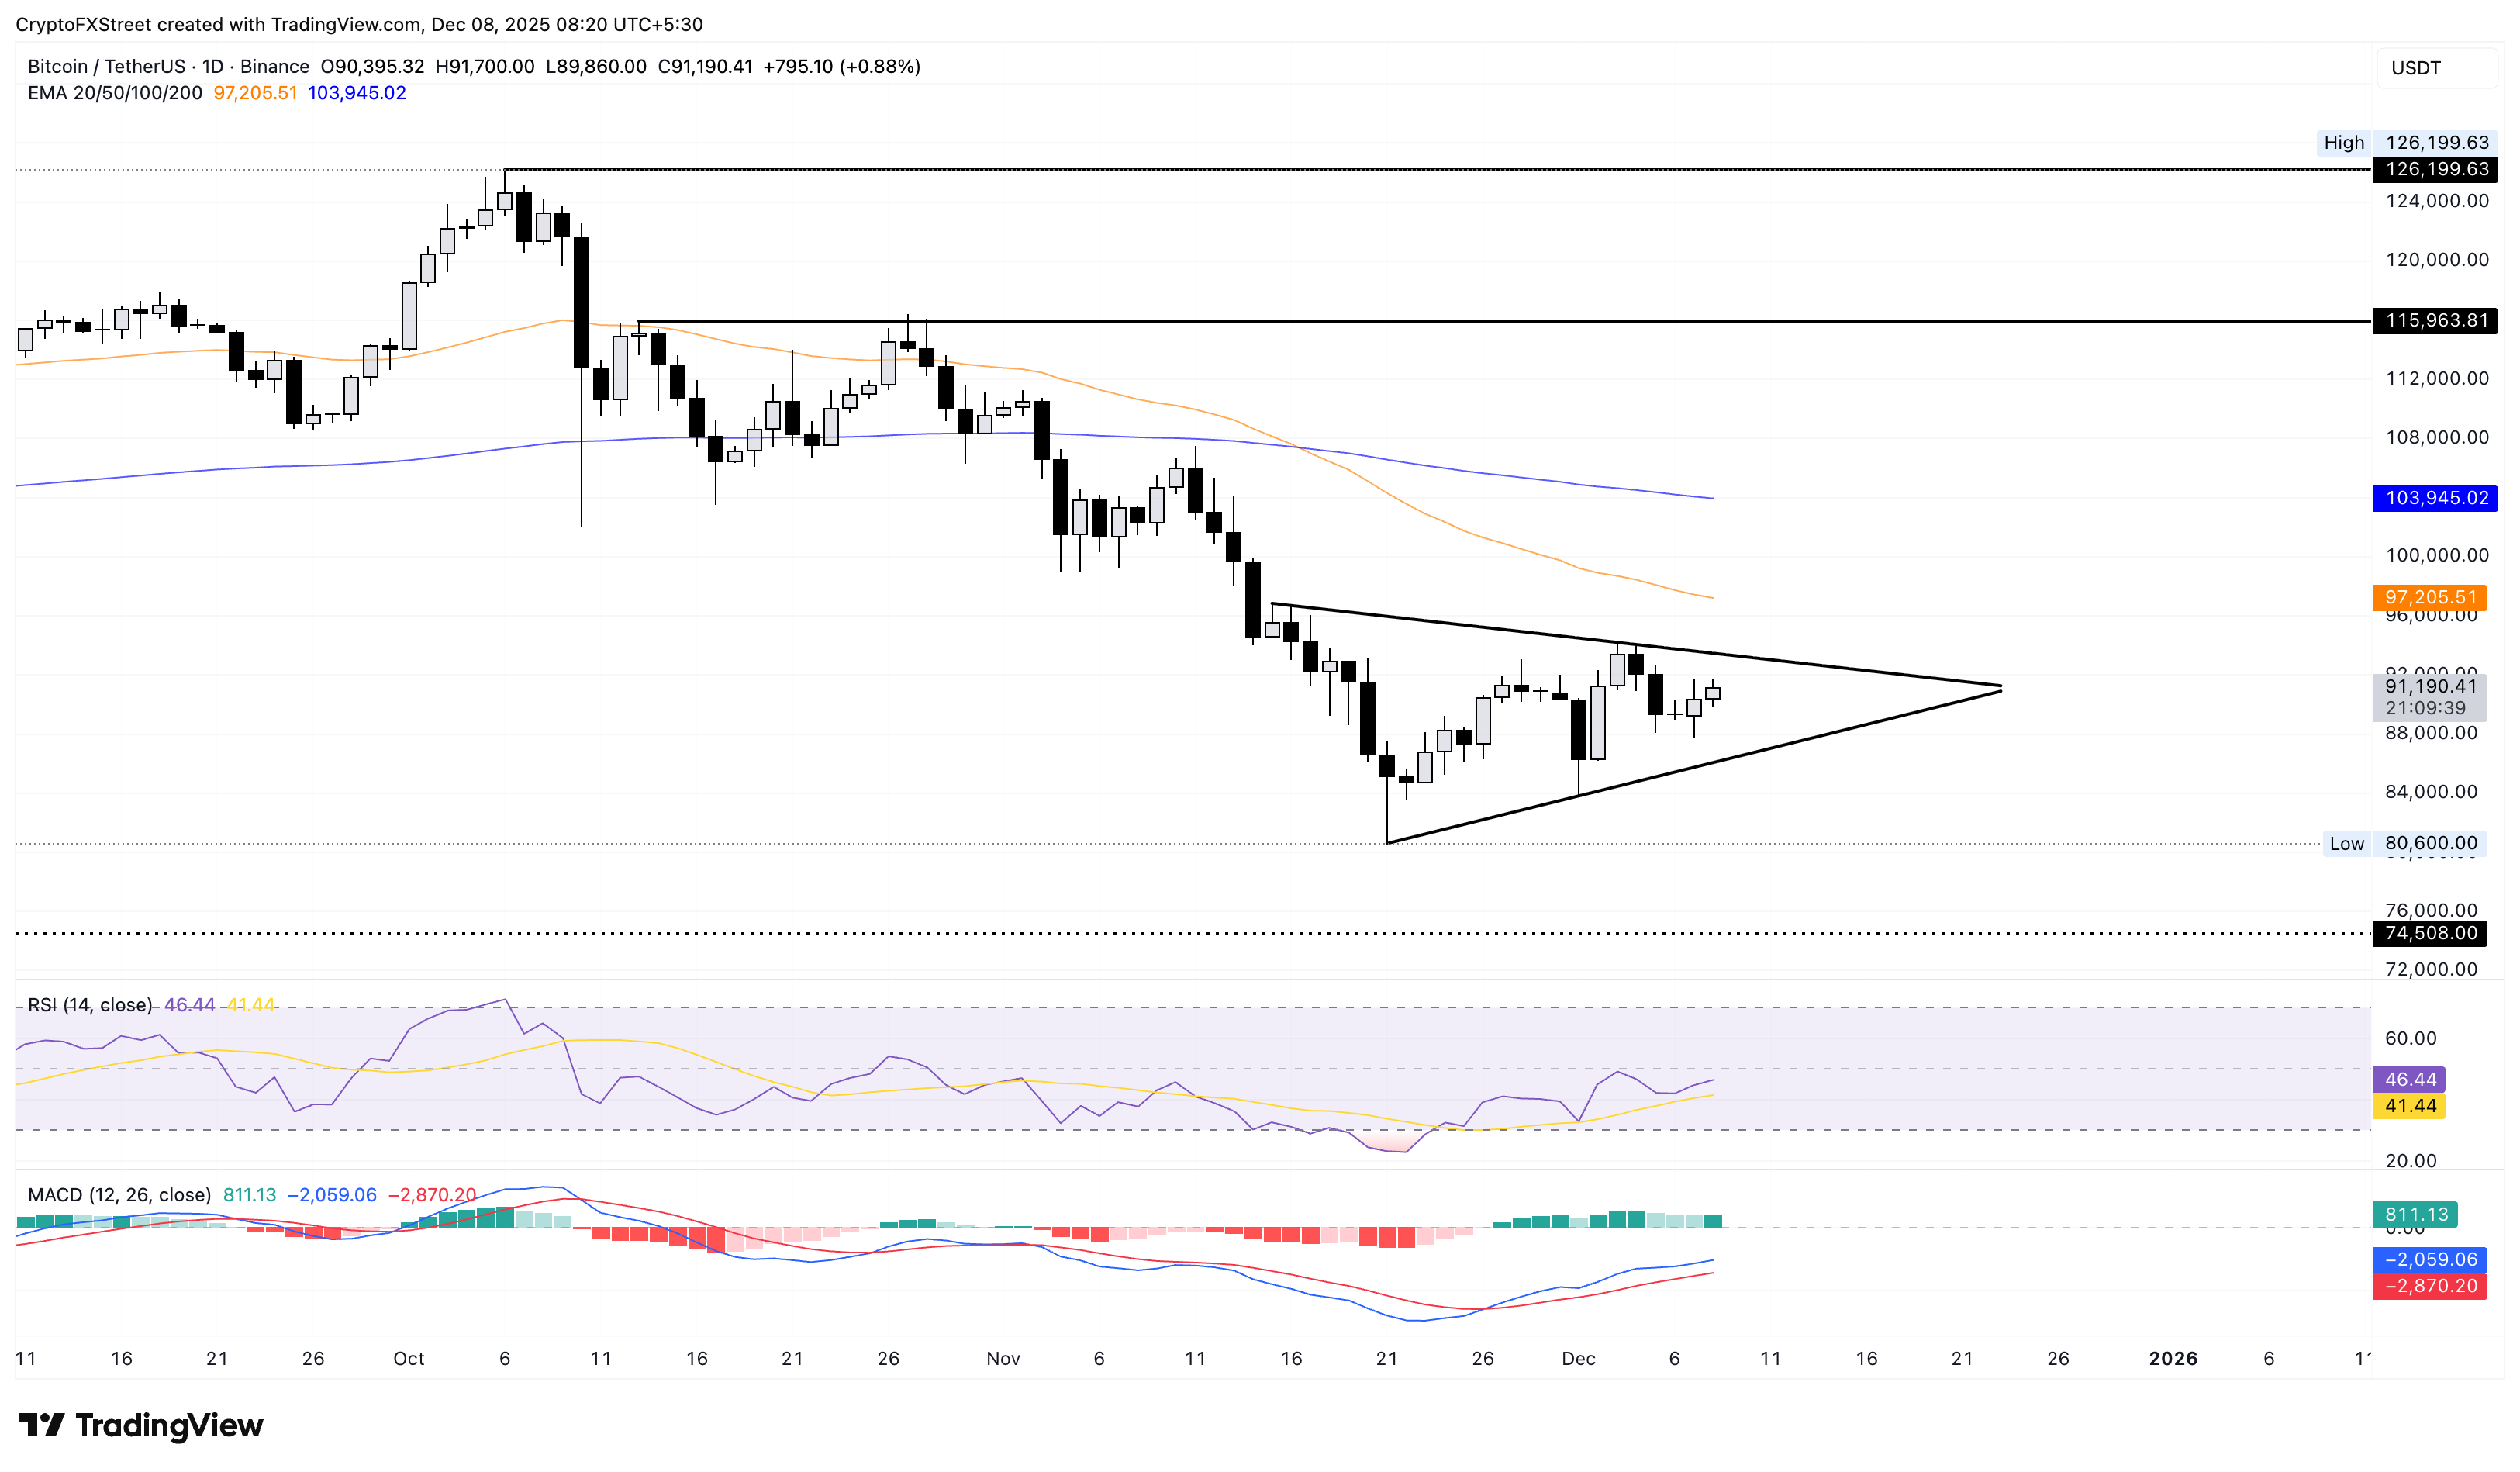
Although the rising retail demand anticipates further recovery in Bitcoin, a potential flip from $93,500 could test the lower support trendline near $84,000.
Ethereum inches closer to a key resistance trendline
Ethereum ticks higher by nearly 2% at press time on Monday, struggling to break above the resistance trendline connecting the October 7 and 27 highs on the daily chart. If the major altcoin exceeds Thursday’s high at $3,240 with a decisive close, it could aim for the 200-day EMA at $3,459.
Similar to Bitcoin, Ethereum is gaining traction, evidenced by the RSI rising to 49 while the MACD steadies higher toward the zero line.
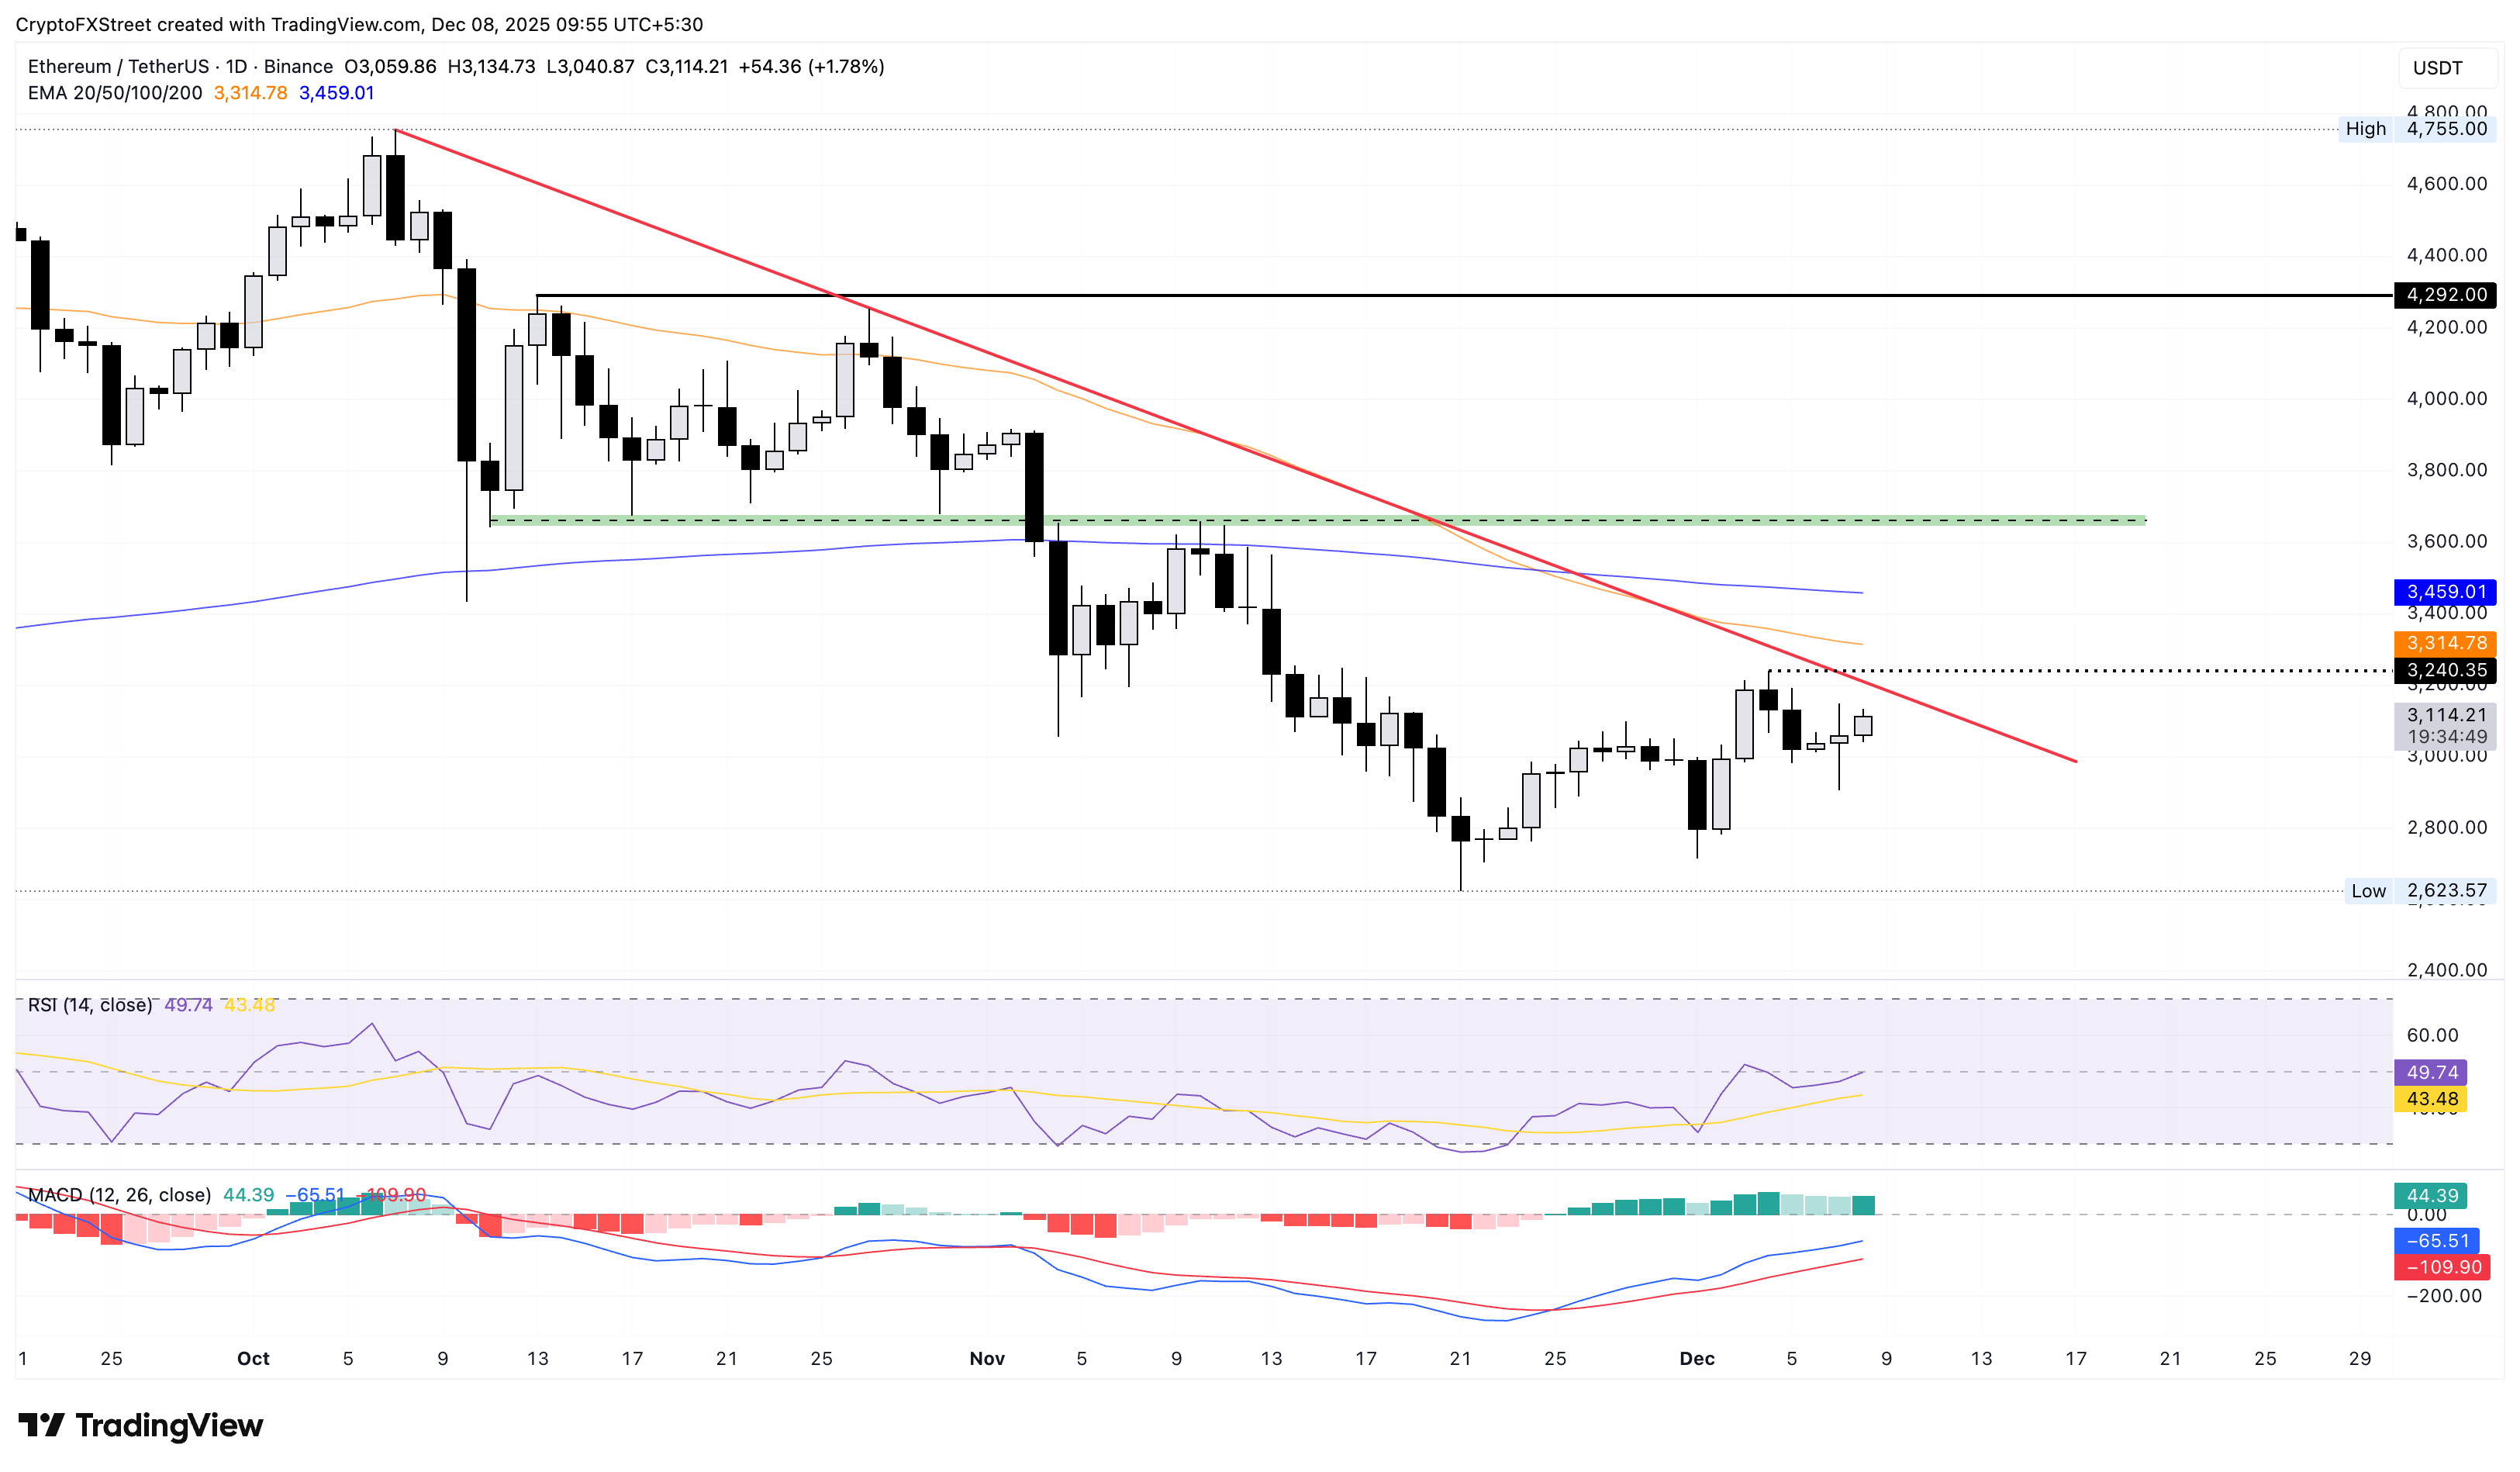
However, a bearish reversal below $3,000 could extend the decline to the November 21 low at $2,623.
Ripple recovers within a falling channel
Ripple is up nearly 2% at the time of writing on Monday as bulls hold the ground at the $2.00 psychological mark. The intraday recovery signals a potential upcycle within a larger falling channel pattern on the daily chart.
A potential upside extension could target the overhead resistance trendline formed by connecting the October 6 and November 10 highs at $2.18. In the event of a bullish breakout, XRP prices could aim for the 200-day EMA at $2.47.
The intraday recovery delays a sell signal from the MACD indicator as the blue line bounces off the red one. Furthermore, the RSI at 44 reverses to the upside, inching toward the halfway line.
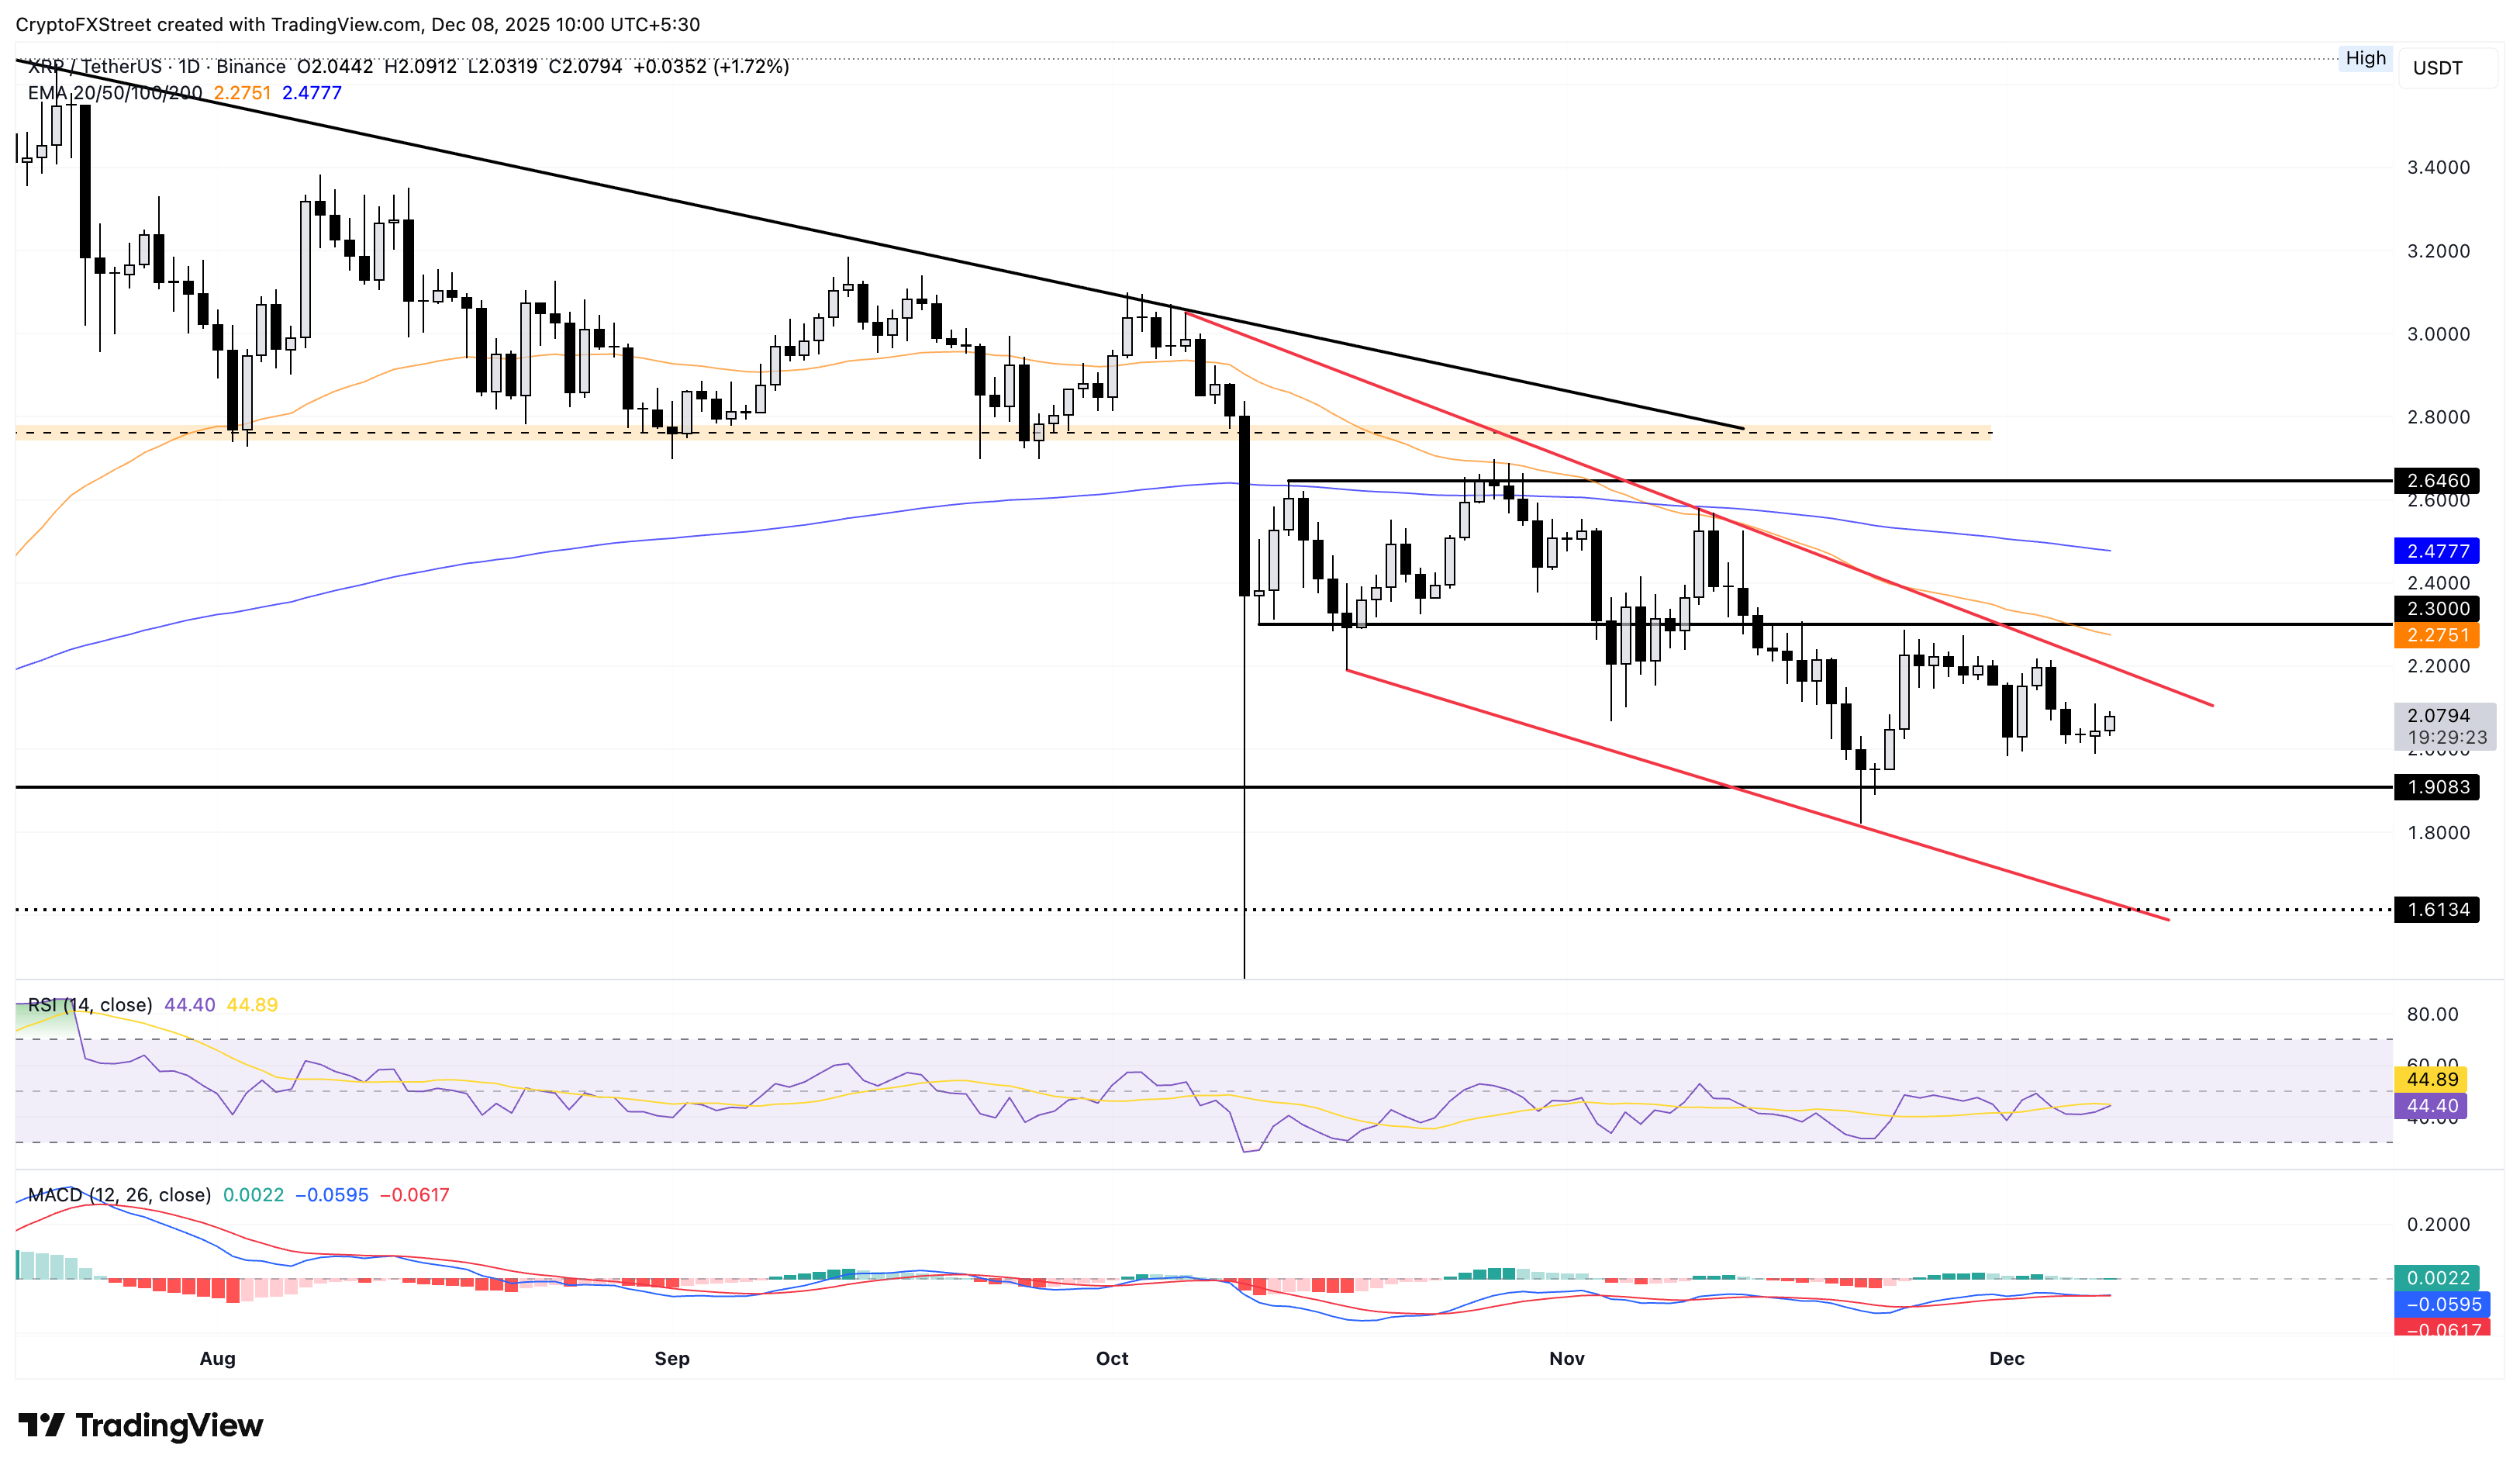
Looking down, the key support for XRP remains at $1.90, aligning with the June 22 low.

Higit sa isang milyong user ang umaasa sa FXStreet para sa real-time market data, charting tools, expert insights, at Forex news. Ang komprehensibong economic calendar at educational webinars nito ay tumutulong sa mga trader na manatiling may alam at gumawa ng kalkuladong mga desisyon. Sinusuportahan ang FXStreet ng humigit-kumulang 60 propesyonal sa pagitan ng Barcelona HQ at iba’t ibang rehiyon sa buong mundo.
Magbasa pa


