
Top Crypto Gainers: PENGU, SUI, and PUMP rally as Bitcoin breaks $92K
Ni Vishal Dixit
Petsa ng Pag-publish: 3 Dec 2025 | Petsa ng Pag-edit: 3 Dec 2025


Sikat na Artikulo

Altcoins, including Pudgy Penguins (PENGU), Sui (SUI), and Pump.fun (PUMP) secure double-digit gains as Bitcoin (BTC) rebounds nearly 8% in the last 24 hours to surface above $92,000 amid Vanguard's decision to allow crypto Exchange Traded Funds (ETFs) on its platform.
- Pudgy Penguins rallied 25% on Tuesday, reclaiming the $0.0100 psychological level.
- Sui steadies above $1.60 after Tuesday's 21% gains signal a double-bottom reversal.
- Pump.fun signals fresh recovery with a 17% rise, with bulls aiming for the 50-day EMA.
Altcoins, including Pudgy Penguins (PENGU), Sui (SUI), and Pump.fun (PUMP) secure double-digit gains as Bitcoin (BTC) rebounds nearly 8% in the last 24 hours to surface above $92,000 amid Vanguard's decision to allow crypto Exchange Traded Funds (ETFs) on its platform.
Bitcoin’s recovery gains traction as Vanguard allows crypto ETFs
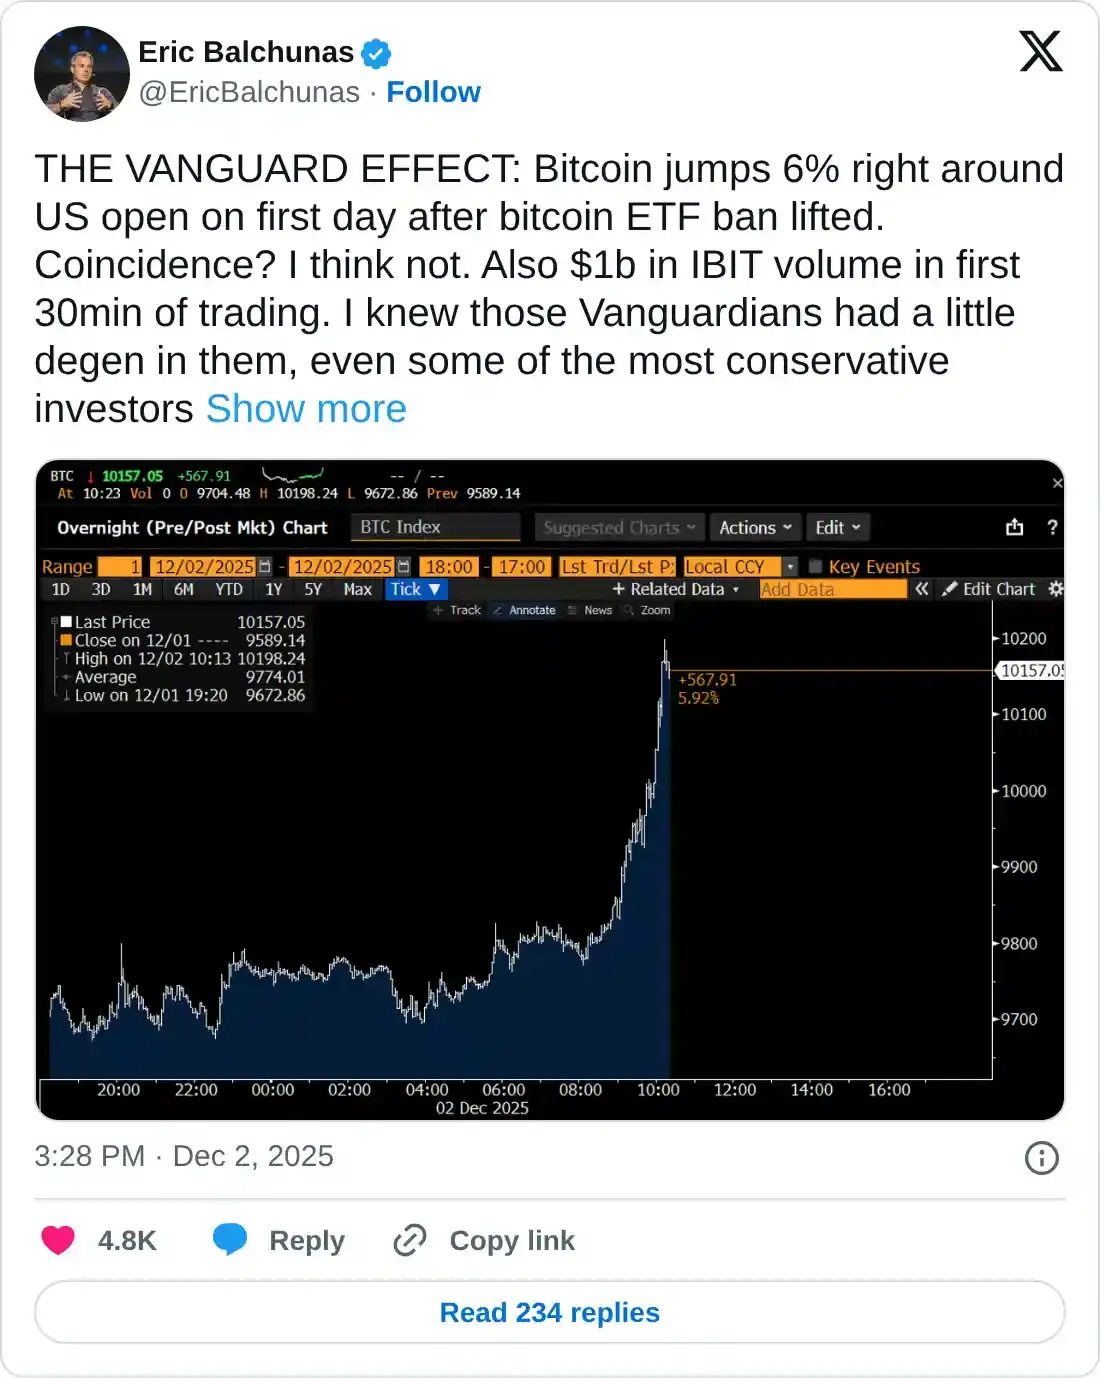
Vanguard, a US-based asset manager with over $11 trillion in assets under management, announced on Tuesday that it would allow Bitcoin ETFs on its platform, resulting in a sharp recovery in BTC prices. According to Eric Balchunas, Bloomberg ETF analyst, BlackRock’s IBIT saw over $1 billion in trading volume in the first 30 minutes of trading, indicating renewed institutional demand.
Bitcoin inches towards $93,000 with nearly 2% gains by press time on Wednesday, building on the nearly 6% rise from the previous day. The recovery in BTC is testing the nearest resistance of $92,800, marked by the April 28 low. If BTC secures a daily close above this level, it could extend the rally towards the 50-day Exponential Moving Average (EMA) at $98,673.
The technical indicators on the daily chart signal a significant reduction in selling pressure as the Relative Strength Index (RSI) rises to 47 from the oversold zone. If RSI crosses above the midline, it would indicate a resurgence in buying pressure.
Corroborating the shift in trend, Moving Average Convergence Divergence (MACD) extends the upward trend after crossing above its signal line on November 25. The recovery in the average line within the negative territory suggests declining bearish momentum.
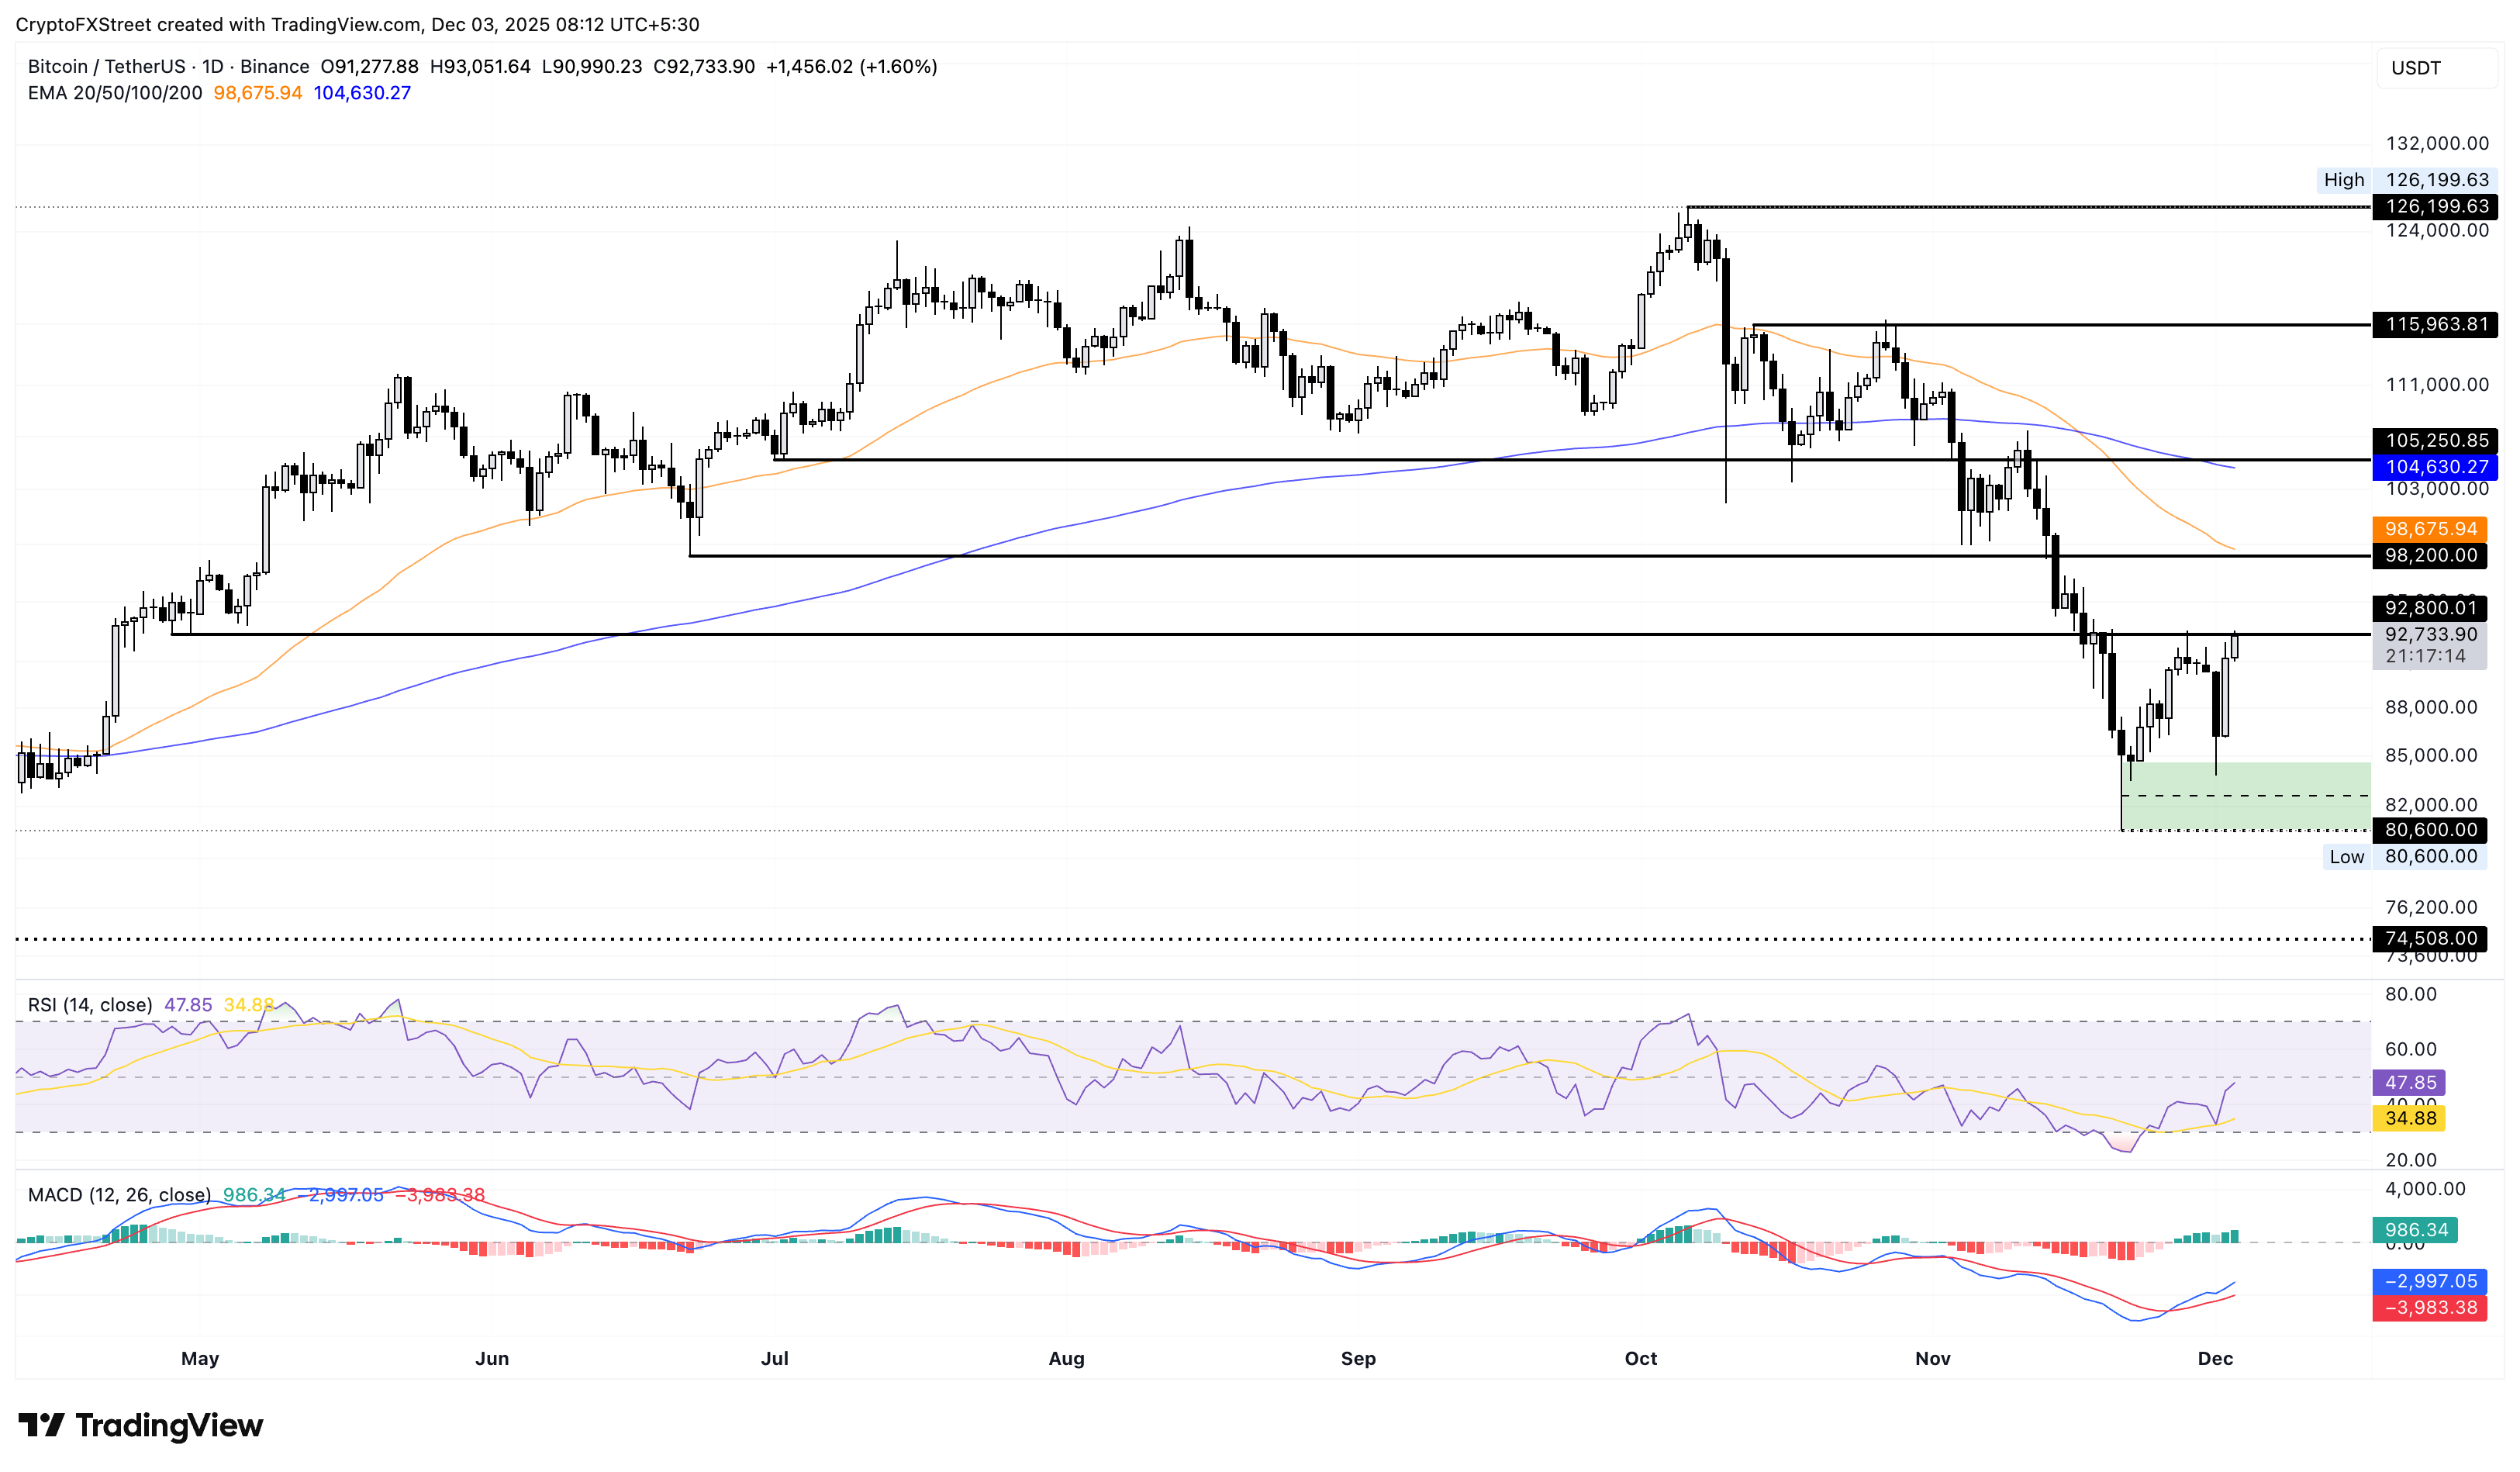
On the flip side, if BTC flips from $92,800, it could test the strong demand zone between the November 22 close at $84,739 and the November 21 low at $80,600.
Pudgy Penguins, Sui, and Pump.fun lead the crypto market recovery
Pudgy Penguins saw a 25% rally on Tuesday, outpacing the broader cryptocurrency market recovery. The rebound in PENGU token has exceeded the $0.0100 psychological level and is approaching the overhead resistance trendline of a larger descending channel pattern on the daily chart.
A decisive close above the November 4 low at $0.0132 could confirm the bullish breakout of the channel pattern. If so, the top performer could extend its rally towards the 50-day EMA at $0.0159.
The momentum indicators suggest a decline in overhead pressure, as the RSI recovers to 45 on the daily chart from the oversold zone. Meanwhile, the MACD and its signal line continue to move steadily upward towards the zero line.
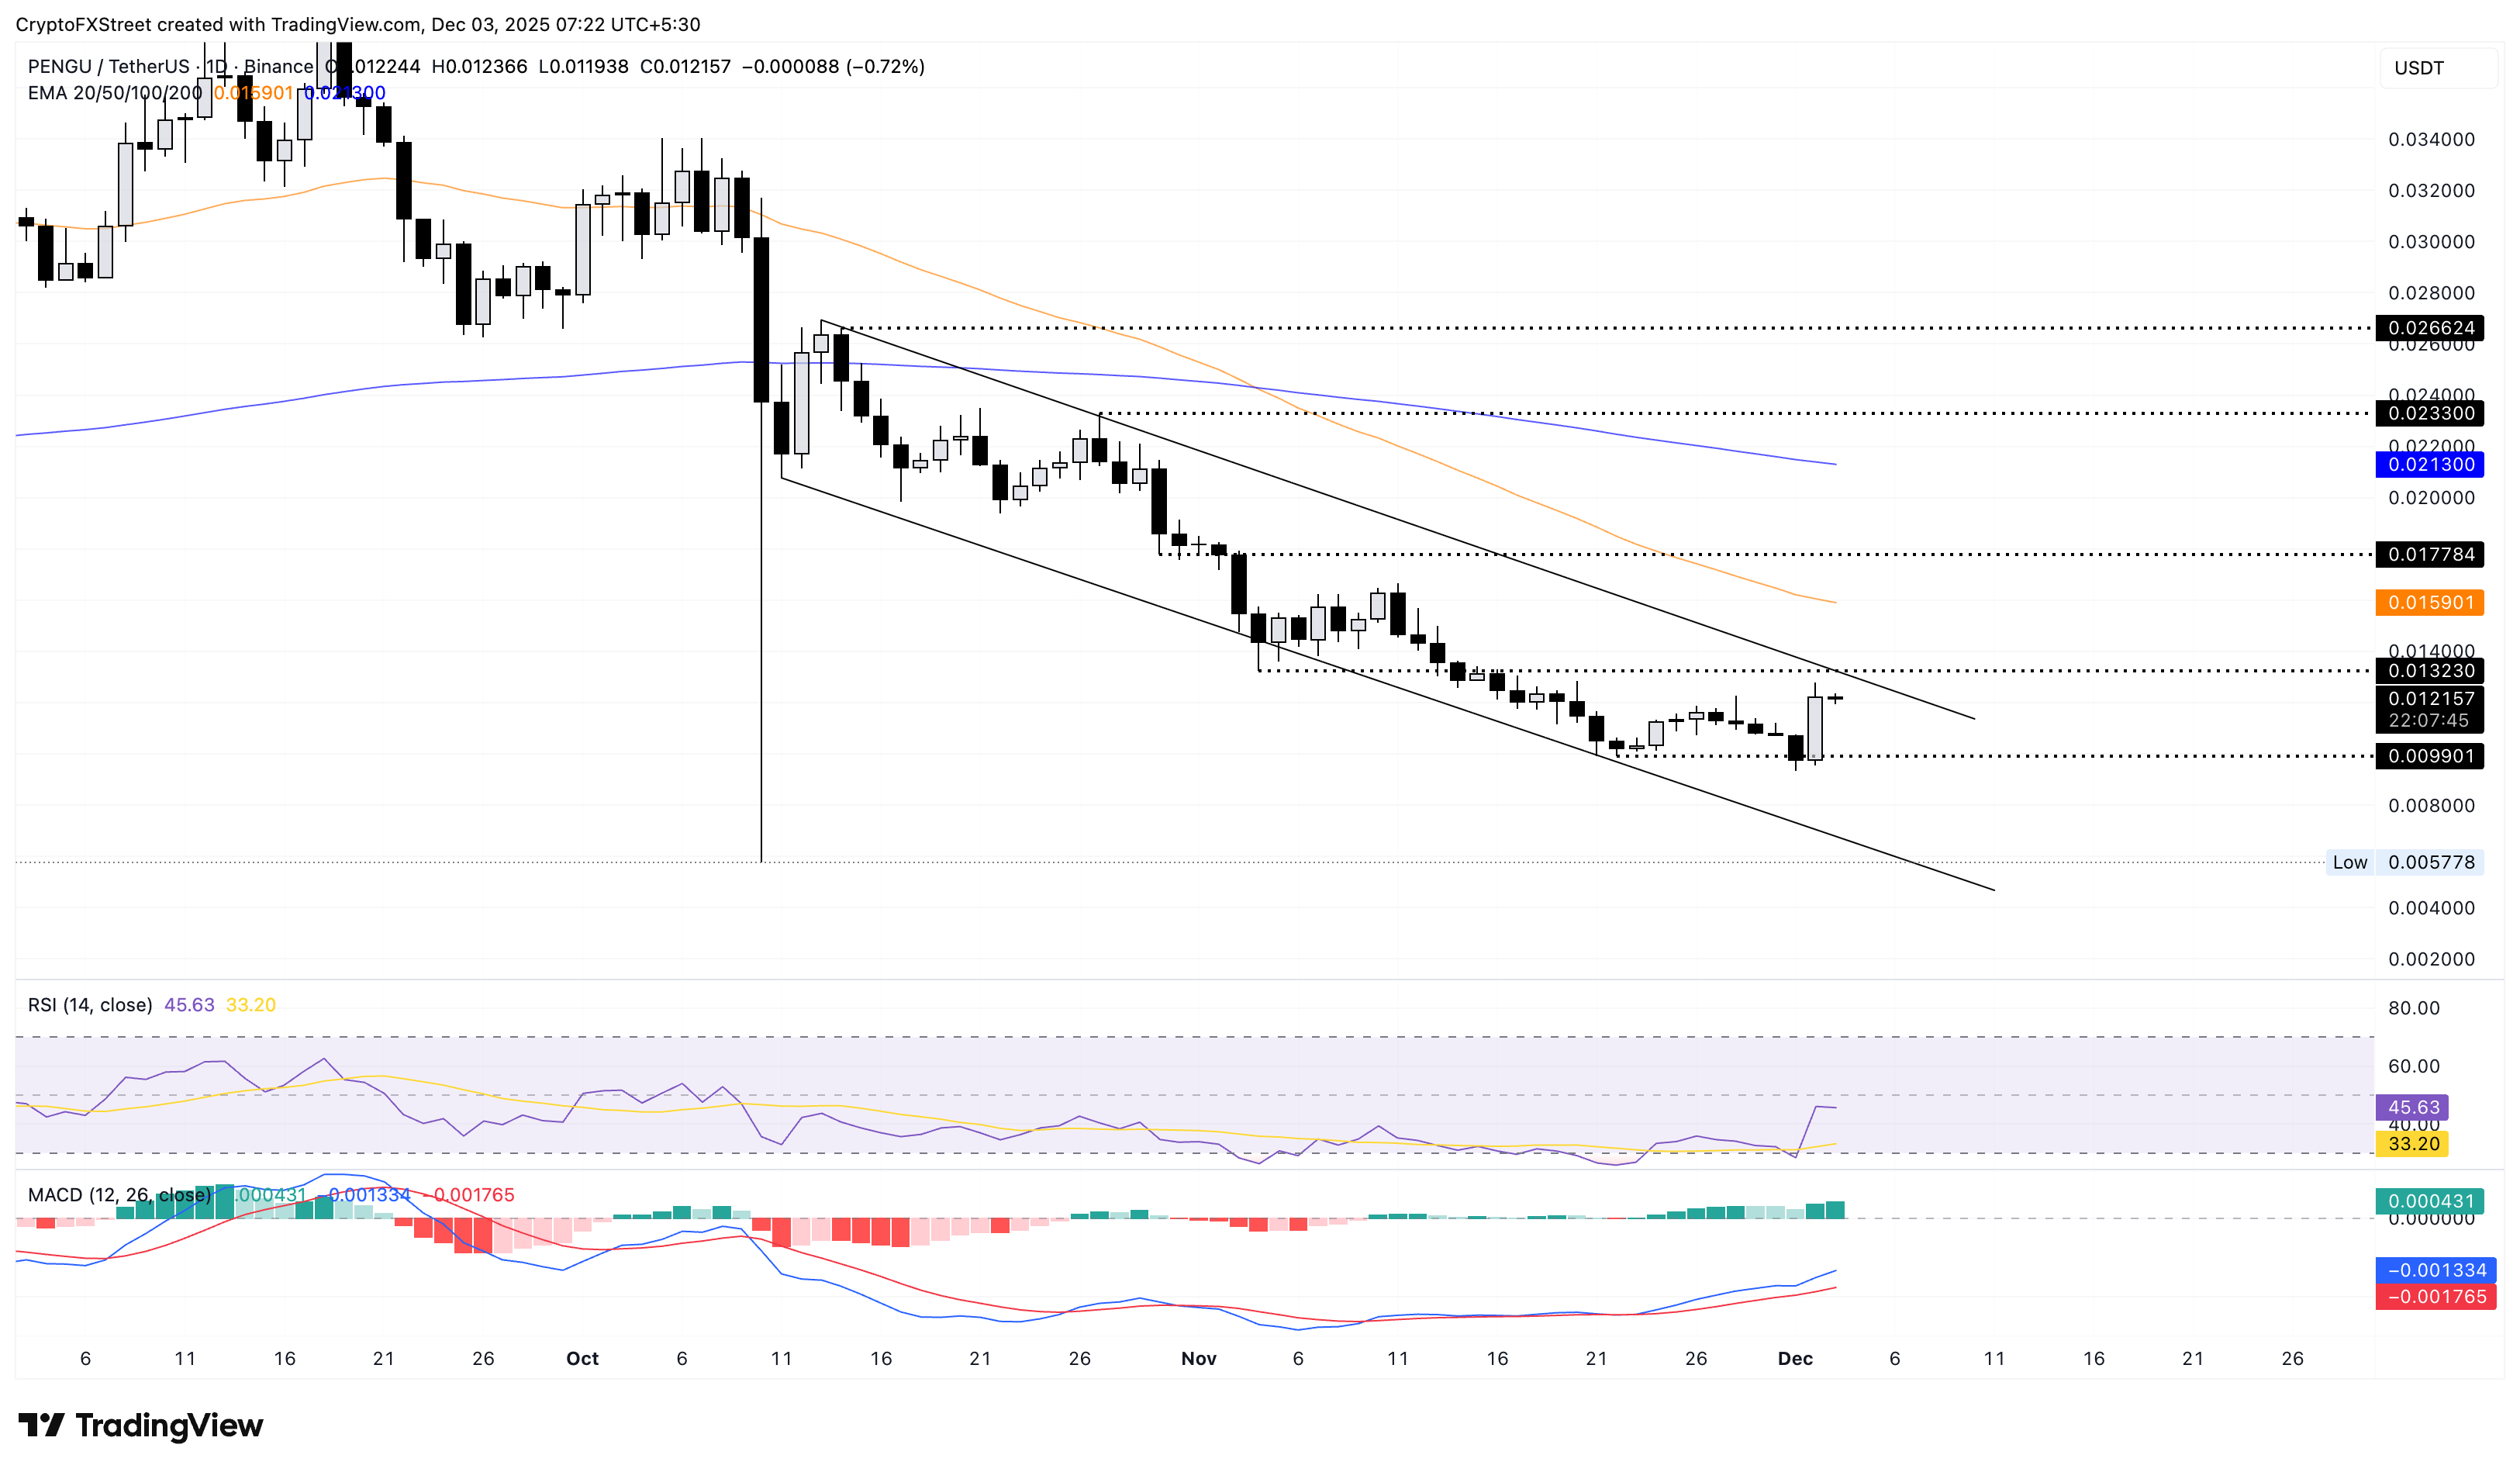
On the flip side, Saturday’s low at $0.0099 could act as an immediate support floor.
On the other hand, SUI rests at $1.63 by press time on Wednesday, following a 21% rise on Tuesday. The path of least resistance for SUI targets the $1.82 level, aligning with the November 4 low as the immediate resistance.
Similar to PENGU, the momentum indicators indicate a decline in selling pressure as RSI and MACD gradually recover.
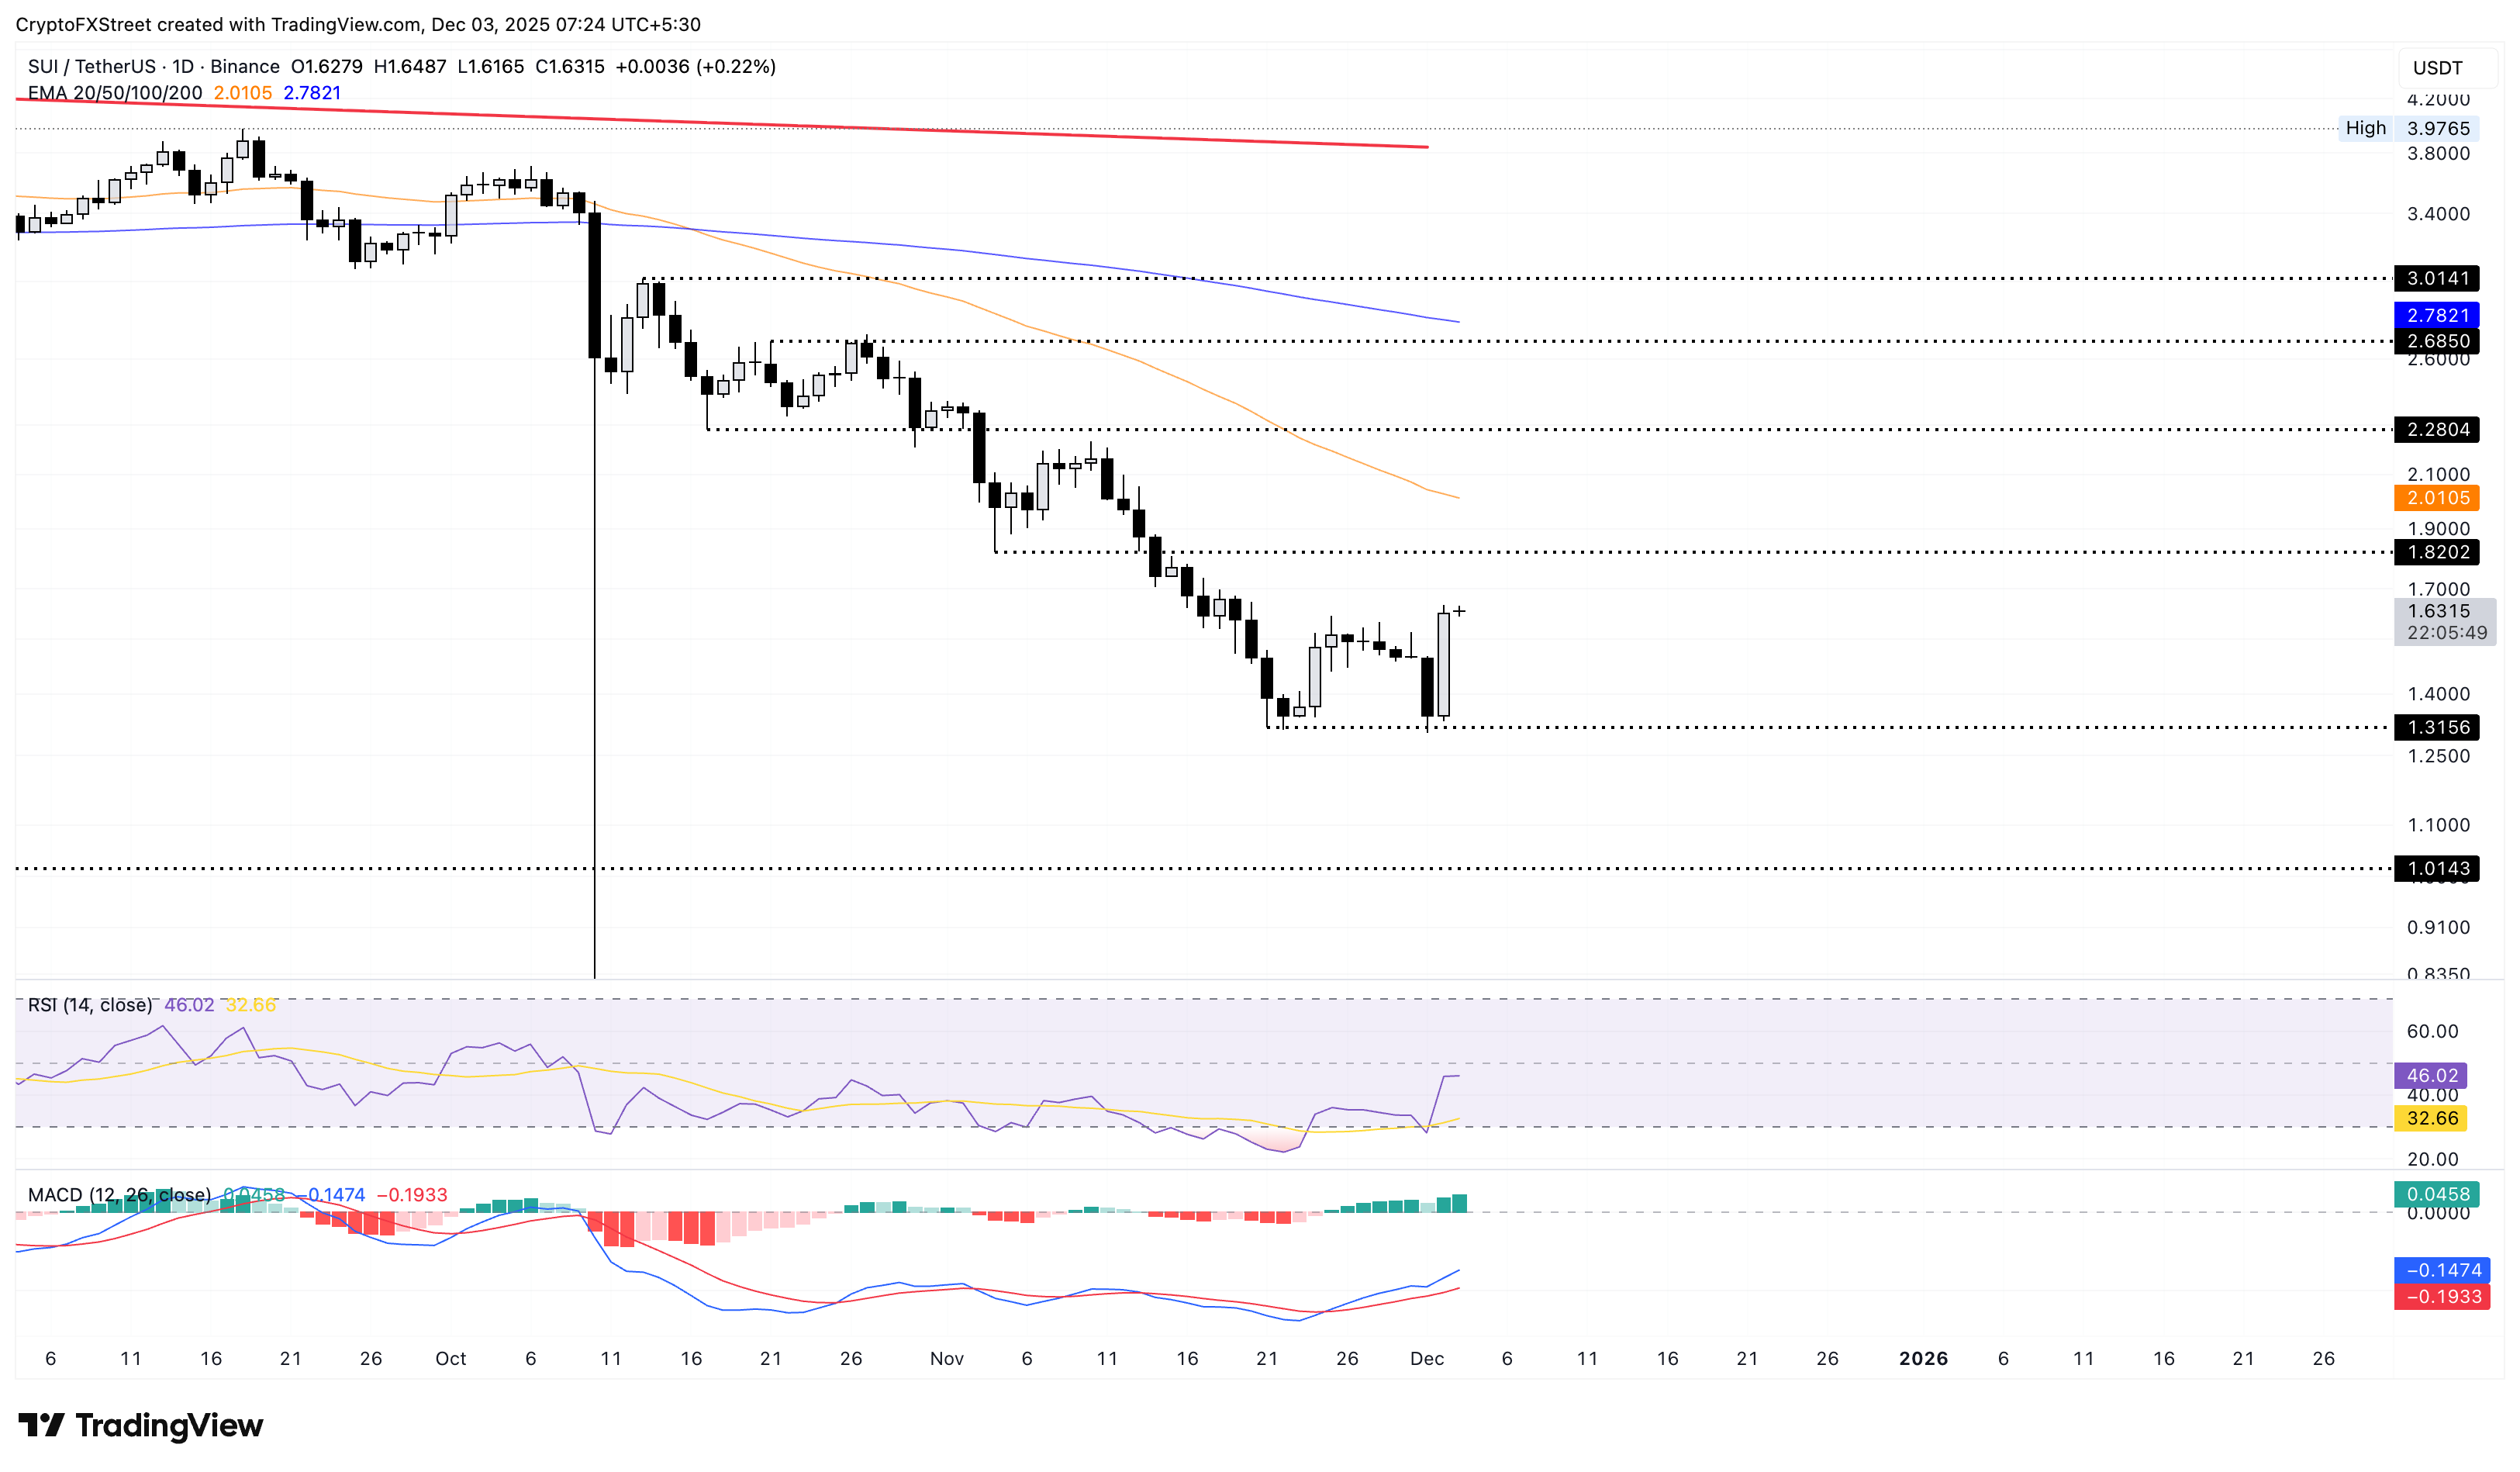
The key support for SUI remains at the November 21 low of $1.31.
Finally, the token launchpad Pump.fun secures a spot among the top performers over the last 24 hours, with almost 17% gains on Tuesday. The PUMP inches towards its 50-day EMA at $0.003658, which serves as immediate resistance.
The RSI at 50 is close to signaling a bullish shift in trend momentum, if it surfaces above the halfway mark. Meanwhile, MACD remains in an upward trend, attempting to exit negative territory and indicating a decline in bearish momentum.
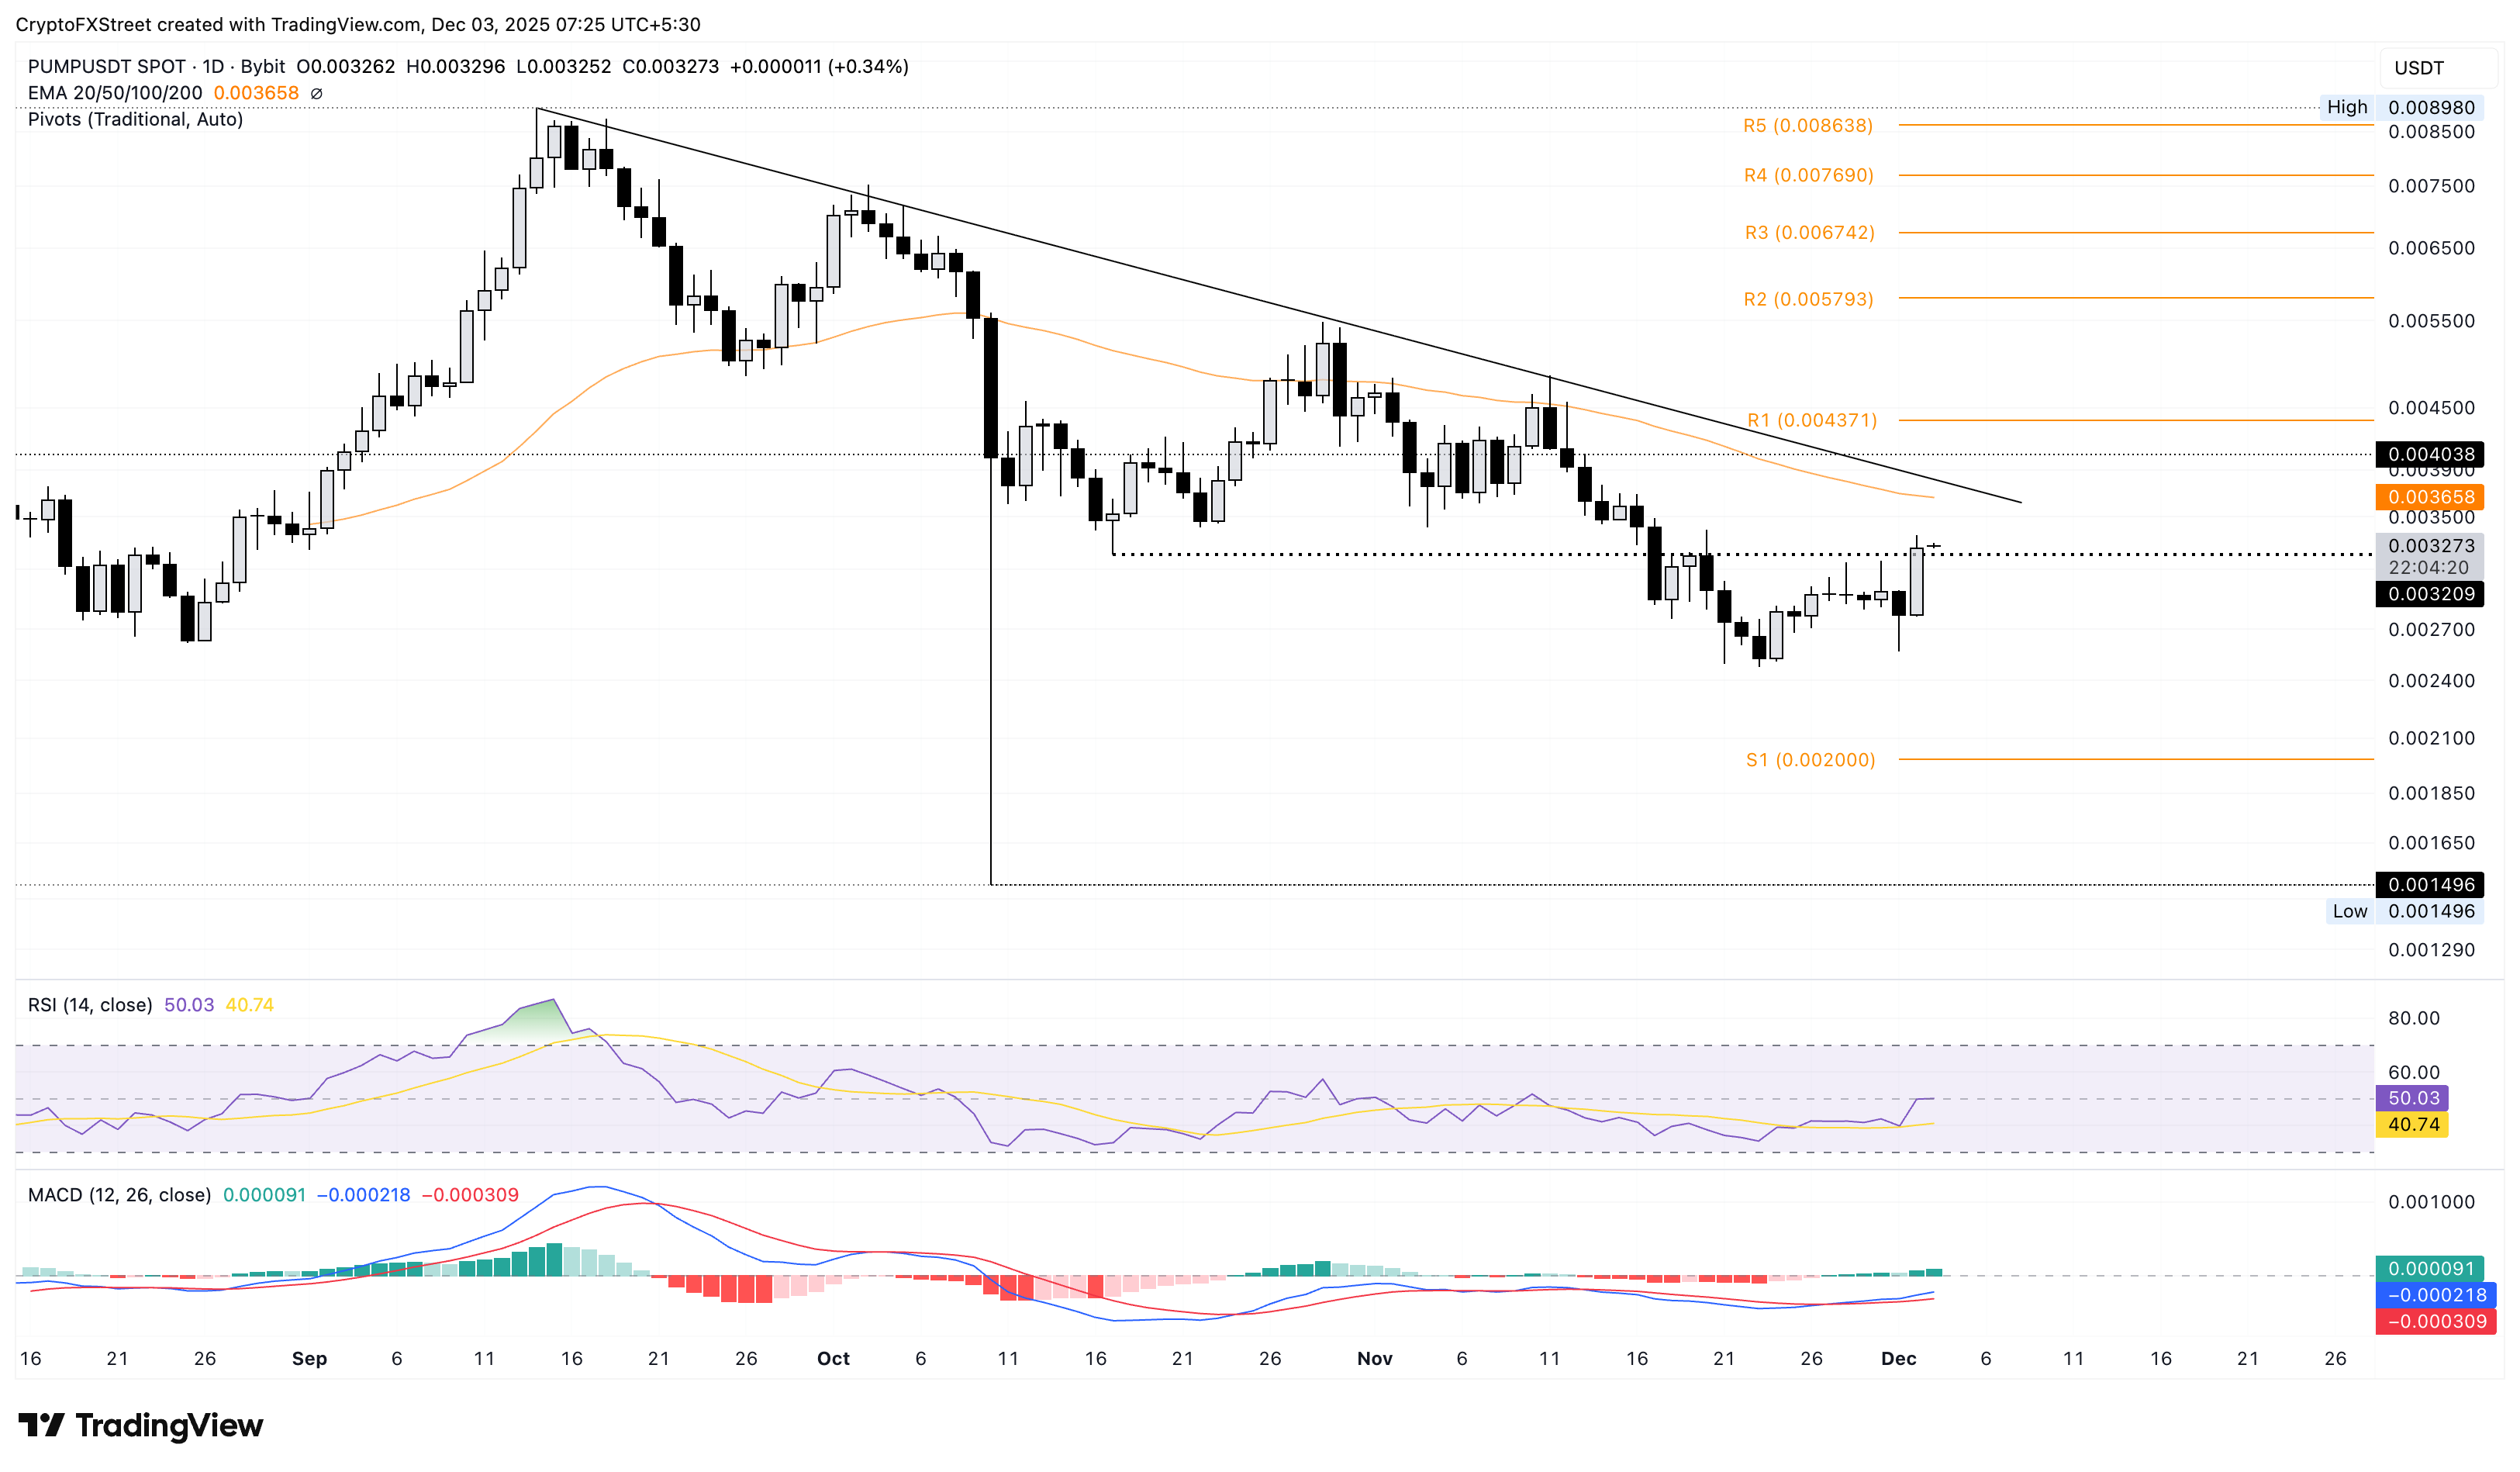
Looking down, the S1 Pivot Point at the $0.002000 psychological mark remains a key support.

Higit sa isang milyong user ang umaasa sa FXStreet para sa real-time market data, charting tools, expert insights, at Forex news. Ang komprehensibong economic calendar at educational webinars nito ay tumutulong sa mga trader na manatiling may alam at gumawa ng kalkuladong mga desisyon. Sinusuportahan ang FXStreet ng humigit-kumulang 60 propesyonal sa pagitan ng Barcelona HQ at iba’t ibang rehiyon sa buong mundo.
Magbasa pa


