
United States Dollar Index climbs to its highest level since May 2025 on Fed hike bets
Ni Vishal Chaturvedi
Na-update: 23 Jun 2026


Sikat na Artikulo

The US Dollar Index (DXY), which tracks the Greenback's value against a basket of six major currencies, extends its rally on Tuesday, climbing to its highest level since May 2025. At the time of writing, the index trades around 100.40, up 0.4% on the day.
- US Dollar Index climbs to its highest level since May 2025, supported by Fed rate hike bets.
- Markets price in a 70% chance of a September Fed rate hike ahead of Thursday's PCE inflation report.
- Technical indicators point to a strengthening uptrend, although overbought conditions are beginning to emerge.
The US Dollar Index (DXY), which tracks the Greenback's value against a basket of six major currencies, extends its rally on Tuesday, climbing to its highest level since May 2025. At the time of writing, the index trades around 100.40, up 0.4% on the day.
The Dollar's advance gathered pace after the index decisively cleared the 100.00 mark, ending a prolonged period of range-bound trading. The upside comes as traders increasingly price in the possibility of a Federal Reserve (Fed) interest rate hike later this year following last week's monetary policy meeting, where Chair Kevin Warsh reiterated the central bank's commitment to bringing inflation back to its 2% target.
Meanwhile, resilient US economic data have bolstered expectations that the Fed can afford to raise borrowing costs. Economic activity remains in expansion territory, while the labor market appears to be stabilizing.
The preliminary S&P Global Services Purchasing Managers Index (PMI) rose to 51.3 from 50.7, while the Manufacturing PMI accelerated to 55.7 from 55.1. Both readings exceeded market expectations. The four-week average of ADP Employment Change climbed to 30.75K from 26.5K.
Markets are currently pricing in a 70% chance of a rate hike at the September meeting, according to the CME FedWatch Tool. Attention now turns to the Personal Consumption Expenditures (PCE) inflation report and the final estimate of first-quarter Gross Domestic Product (GDP), both due on Thursday, for fresh clues on the Fed's policy outlook.
At the same time, focus remains on US-Iran negotiations after both sides reached a 60-day Memorandum of Understanding (MoU) last week. Talks are progressing, but the situation remains fluid and the risk of setbacks persists, particularly over Iran's nuclear program. Uncertainty over whether a final deal can be reached is keeping safe-haven demand for the US Dollar intact.
Technical Analysis:
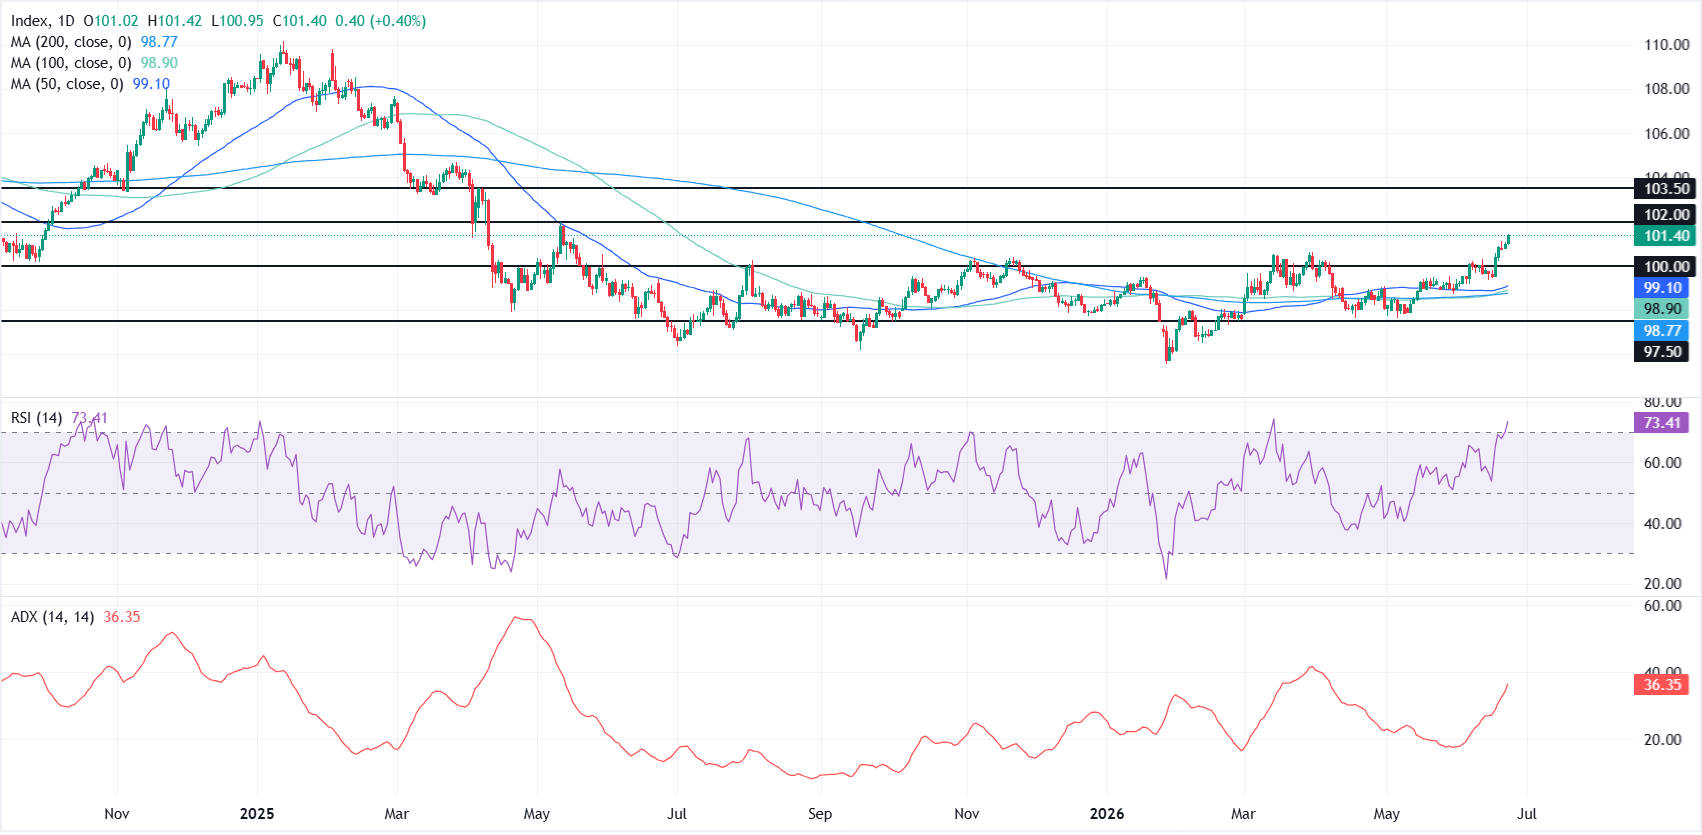
On the daily chart, the Dollar's near-term bias is bullish as price extends well above the 50-, 100- and 200-day Simple Moving Averages (SMAs), which fan out below the market and suggest a reinforced underlying uptrend.
Momentum aligns with this constructive tone, with the Relative Strength Index (RSI) at 73.4 edging deeper into overbought territory while the Average Directional Index (ADX) near 36 signals a strengthening trend.
On the topside, initial resistance emerges at 102.00, where a horizontal barrier caps further gains ahead of a more distant ceiling near 103.50. On the downside, immediate attention lies on the psychological 100.00 level as first support, followed by a dense demand band formed by the 50-day SMA around 99.10, the 100-day SMA near 98.90 and the 200-day SMA at 98.77, with a deeper structural floor only seen toward 97.50 if a sharper correction unfolds from overbought conditions.
(The technical analysis of this story was written with the help of an AI tool.)
US Dollar Price Today
The table below shows the percentage change of US Dollar (USD) against listed major currencies today. US Dollar was the strongest against the Australian Dollar.
| USD | EUR | GBP | JPY | CAD | AUD | NZD | CHF | |
|---|---|---|---|---|---|---|---|---|
| USD | 0.42% | 0.49% | -0.02% | 0.36% | 1.30% | 0.78% | 0.21% | |
| EUR | -0.42% | 0.05% | -0.44% | -0.08% | 0.84% | 0.37% | -0.22% | |
| GBP | -0.49% | -0.05% | -0.47% | -0.11% | 0.81% | 0.32% | -0.26% | |
| JPY | 0.02% | 0.44% | 0.47% | 0.36% | 1.30% | 0.81% | 0.21% | |
| CAD | -0.36% | 0.08% | 0.11% | -0.36% | 0.94% | 0.46% | -0.14% | |
| AUD | -1.30% | -0.84% | -0.81% | -1.30% | -0.94% | -0.45% | -1.10% | |
| NZD | -0.78% | -0.37% | -0.32% | -0.81% | -0.46% | 0.45% | -0.61% | |
| CHF | -0.21% | 0.22% | 0.26% | -0.21% | 0.14% | 1.10% | 0.61% |
The heat map shows percentage changes of major currencies against each other. The base currency is picked from the left column, while the quote currency is picked from the top row. For example, if you pick the US Dollar from the left column and move along the horizontal line to the Japanese Yen, the percentage change displayed in the box will represent USD (base)/JPY (quote).

Higit sa isang milyong user ang umaasa sa FXStreet para sa real-time market data, charting tools, expert insights, at Forex news. Ang komprehensibong economic calendar at educational webinars nito ay tumutulong sa mga trader na manatiling may alam at gumawa ng kalkuladong mga desisyon. Sinusuportahan ang FXStreet ng humigit-kumulang 60 propesyonal sa pagitan ng Barcelona HQ at iba’t ibang rehiyon sa buong mundo.
Magbasa pa


