

USD/CAD Price Forecast: Holds gains above 1.3800 as Oil prices weigh on Loonie
- USD/CAD consolidates above 1.3800 following a 1.7% rally over the last three weeks.
- The recent pullback in Oil prices keeps the Canadian Dollar on the defensive.
- The Greenback is drawing additional support from the Fed's hawkish shift.
The US Dollar (USD) is trading practically flat against the Canadian Dollar (CAD) on Wednesday, consolidating gains above 1.3800 at the time of writing, after having rallied about 1.7% over the previous three weeks. The recent pullback in Crude prices has weighed on the commodity-sensitive Loonie, which is looking for direction this week, as investors await developments from the US-Iran peace process.

Beyond that, the hawkish repricing from the US Federal Reserve (Fed), which is now expected to hike rates at least once this year, is providing additional support to the Greenback. The Bank of Canada (BoC), on the other hand, faces a more challenging environment, with a “low fire, low hire” labour market muddying the bank’s rate path.
Technical Analysis: Surfing a bullish wave
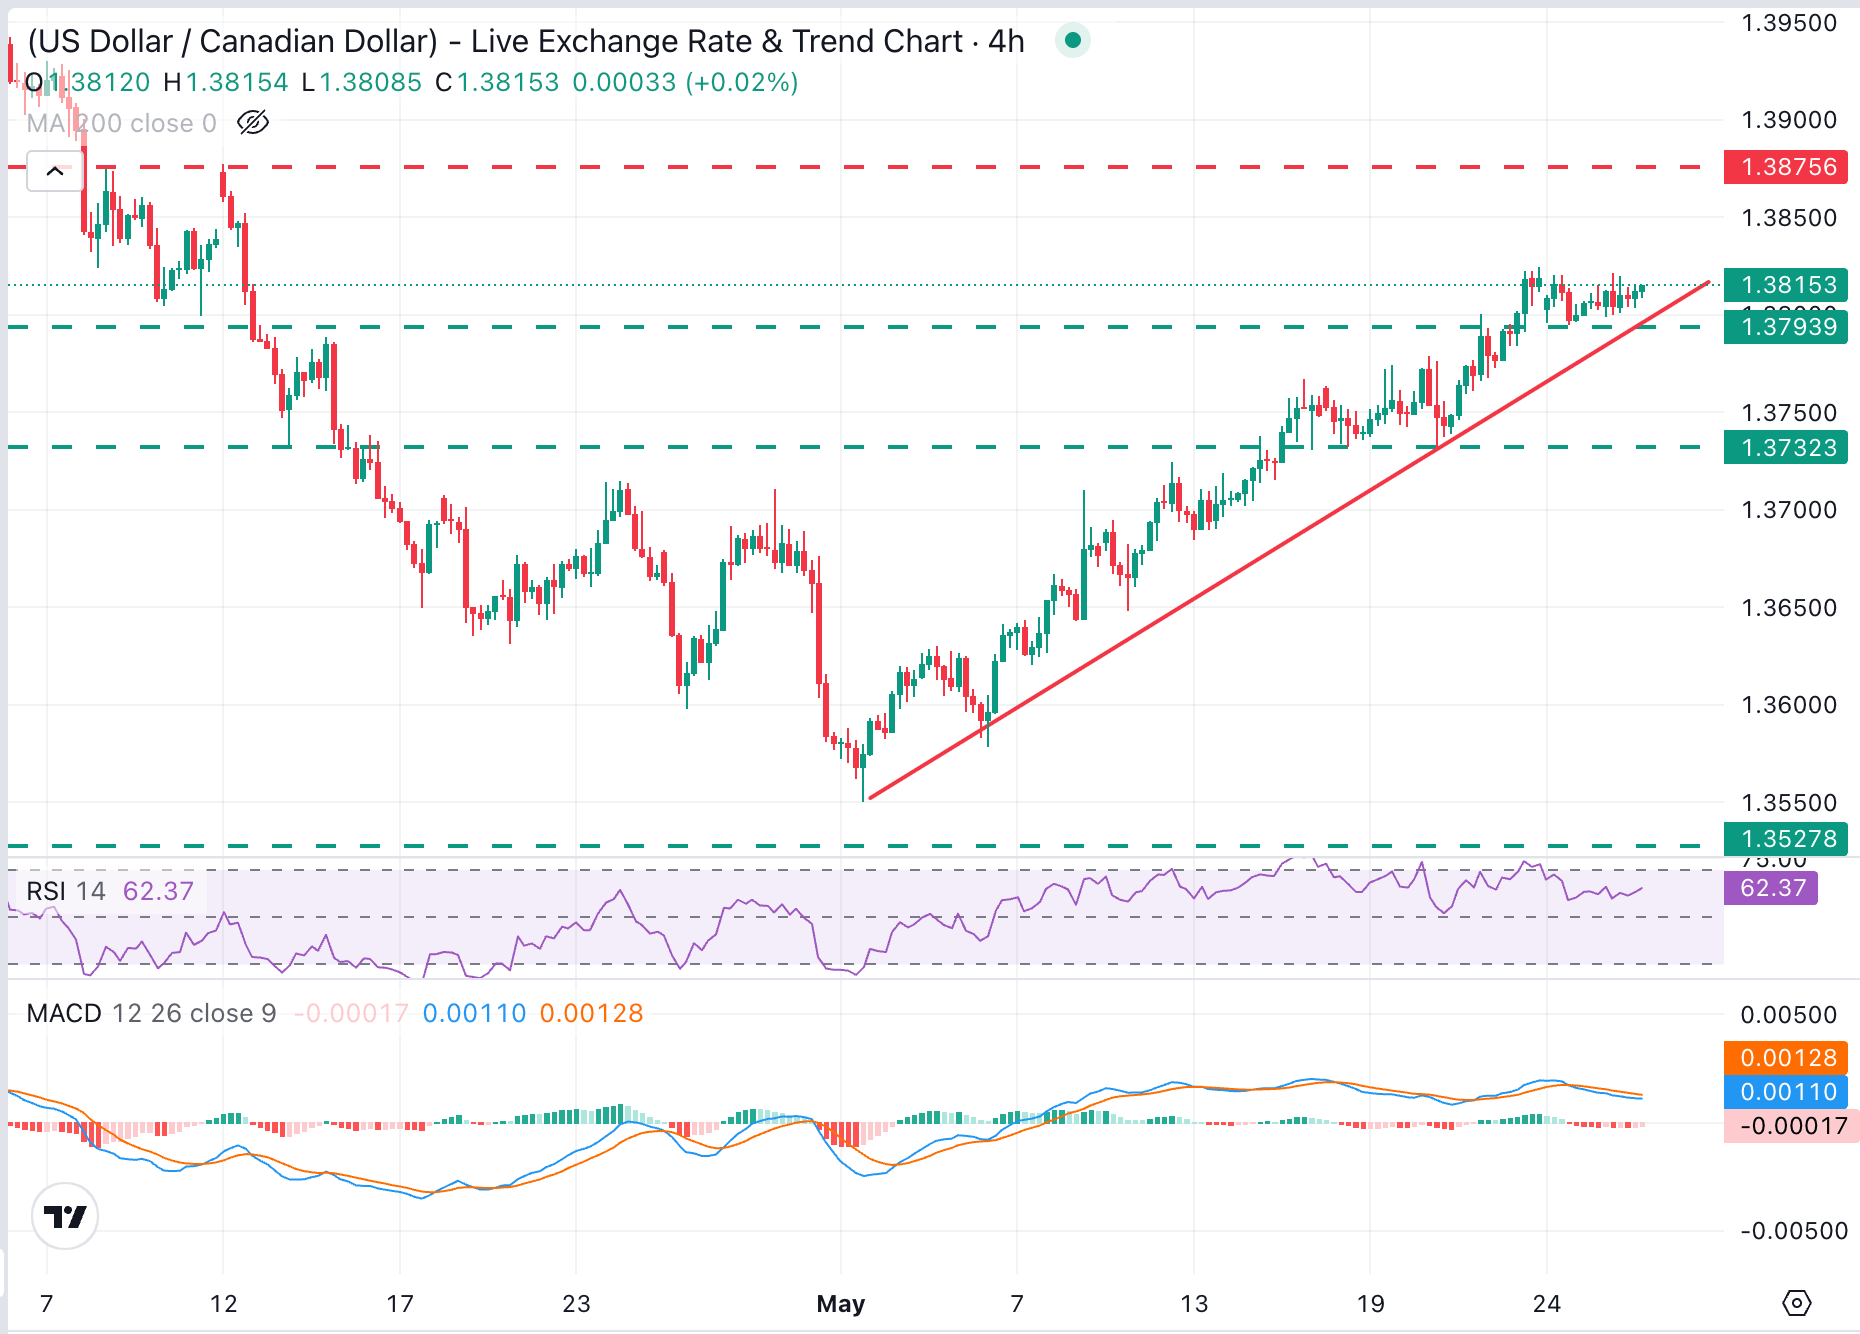
USD/CAD trades at 1.3815, with a near-term bullish structure still in place, although momentum indicators show mixed readings. The 4-hour Relative Strength Index (RSI), now around 60, reinforces the constructive momentum, although the Moving Average Convergence Divergence (MACD) hovers at slightly negative territory, hinting at consolidation rather than an outright reversal for now.
Last week's high, at 1.3820, is holding bulls for now, closing the path towards the April 8 and 12 highs, at the 1.3875 area.
Downside attempts, on the other hand, remain contained above the confluence of trendline support and Monday's lows in the 1.3790 area. A confirmation below here would shift the focus towards May 18 and 20 lows, near 1.3730
(The technical analysis of this story was written with the help of an AI tool.)
US Dollar Price This week
The table below shows the percentage change of US Dollar (USD) against listed major currencies this week. US Dollar was the strongest against the Japanese Yen.
| USD | EUR | GBP | JPY | CAD | AUD | NZD | CHF | |
|---|---|---|---|---|---|---|---|---|
| USD | 0.02% | 0.07% | 0.32% | 0.07% | 0.17% | 0.18% | 0.16% | |
| EUR | -0.02% | 0.07% | 0.33% | 0.04% | 0.11% | 0.15% | 0.13% | |
| GBP | -0.07% | -0.07% | 0.02% | -0.03% | 0.03% | 0.08% | 0.09% | |
| JPY | -0.32% | -0.33% | -0.02% | -0.27% | -0.19% | -0.17% | -0.18% | |
| CAD | -0.07% | -0.04% | 0.03% | 0.27% | 0.08% | 0.10% | 0.13% | |
| AUD | -0.17% | -0.11% | -0.03% | 0.19% | -0.08% | 0.05% | 0.00% | |
| NZD | -0.18% | -0.15% | -0.08% | 0.17% | -0.10% | -0.05% | 0.01% | |
| CHF | -0.16% | -0.13% | -0.09% | 0.18% | -0.13% | -0.01% | -0.01% |
The heat map shows percentage changes of major currencies against each other. The base currency is picked from the left column, while the quote currency is picked from the top row. For example, if you pick the US Dollar from the left column and move along the horizontal line to the Japanese Yen, the percentage change displayed in the box will represent USD (base)/JPY (quote).













