
USD/CAD Price Forecast: Tests 1.3700 support near moving averages
Ni Akhtar Faruqui
Petsa ng Pag-publish: 23 Mar 2026 | Petsa ng Pag-edit: 23 Mar 2026


Sikat na Artikulo

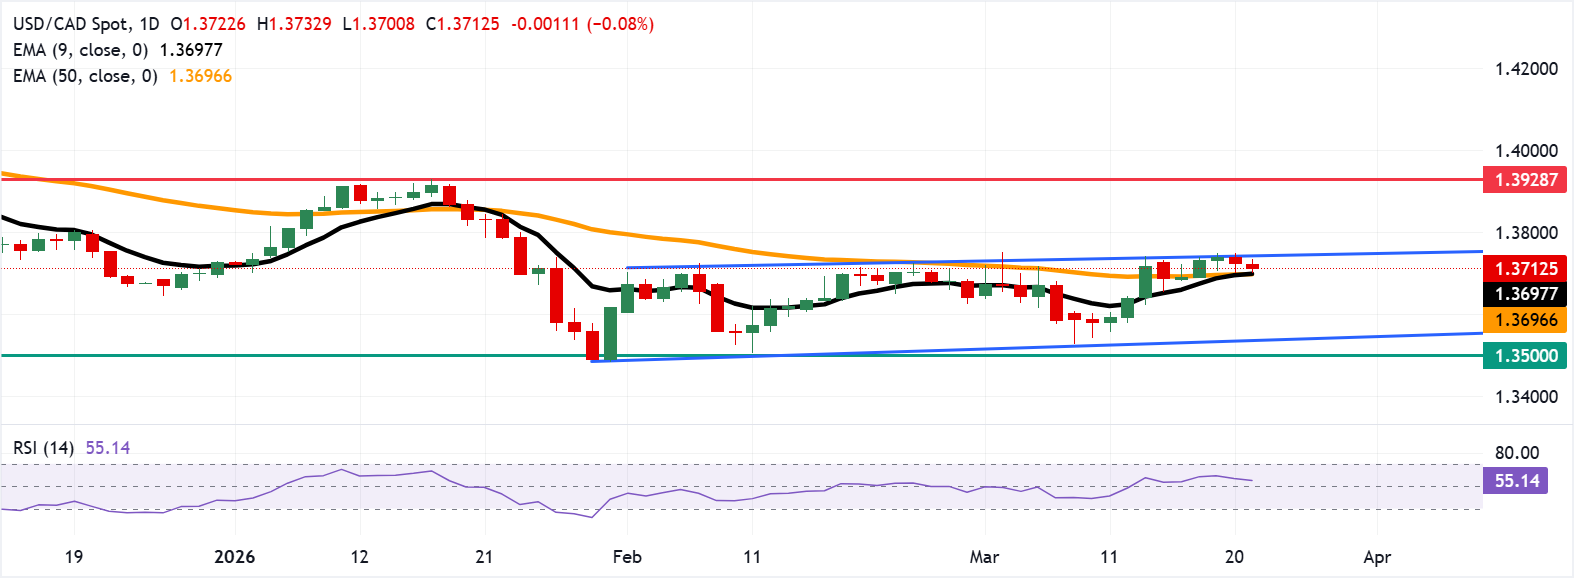
USD/CAD continues to lose ground for the second successive session, trading around 1.3710 during the Asian hours on Monday.
- USD/CAD could test the upper rectangle channel boundary around 1.3750.
- The 14-day Relative Strength Index holds in the mid-50s, signaling strengthening buying pressure.
- The immediate support lies at the 1.3700 psychological level, aligned with the nine- and 50-day EMAs.
USD/CAD continues to lose ground for the second successive session, trading around 1.3710 during the Asian hours on Monday. The near-term bias holds mildly bullish as spot advances above the nine- and 50-day Exponential Moving Average (EMA), indicating an emerging upward correction within a broader range.
Momentum supports this bid tone, with the 14-day Relative Strength Index (RSI) holding in the mid-50s after recovering from sub-40 readings, signalling improving buying pressure rather than overbought conditions.
The technical analysis of the daily chart shows the USD/CAD pair remaining close to the upper boundary of the rectangle channel pattern around 1.3750. A successful break above the channel would offer confirmation of a bullish bias and support the pair to target the three-month high of 1.3928, recorded on January 16.
On the downside, the immediate support lies at the psychological level of 1.3700, aligned with the nine- and 50-day EMAs of 1.3697 and 1.3696, respectively. Further declines below these averages would put downward pressure on the USD/CAD pair to navigate the region around the lower boundary of rectangle 1.3540.
(The technical analysis of this story was written with the help of an AI tool.)
Canadian Dollar Price Today
The table below shows the percentage change of Canadian Dollar (CAD) against listed major currencies today. Canadian Dollar was the strongest against the Australian Dollar.
| USD | EUR | GBP | JPY | CAD | AUD | NZD | CHF | |
|---|---|---|---|---|---|---|---|---|
| USD | 0.21% | 0.16% | 0.08% | -0.11% | 0.63% | 0.45% | 0.15% | |
| EUR | -0.21% | -0.06% | -0.11% | -0.33% | 0.53% | 0.23% | -0.07% | |
| GBP | -0.16% | 0.06% | -0.06% | -0.27% | 0.59% | 0.29% | -0.02% | |
| JPY | -0.08% | 0.11% | 0.06% | -0.18% | 0.54% | 0.29% | 0.06% | |
| CAD | 0.11% | 0.33% | 0.27% | 0.18% | 0.71% | 0.42% | 0.22% | |
| AUD | -0.63% | -0.53% | -0.59% | -0.54% | -0.71% | -0.29% | -0.47% | |
| NZD | -0.45% | -0.23% | -0.29% | -0.29% | -0.42% | 0.29% | -0.26% | |
| CHF | -0.15% | 0.07% | 0.02% | -0.06% | -0.22% | 0.47% | 0.26% |
The heat map shows percentage changes of major currencies against each other. The base currency is picked from the left column, while the quote currency is picked from the top row. For example, if you pick the Canadian Dollar from the left column and move along the horizontal line to the US Dollar, the percentage change displayed in the box will represent CAD (base)/USD (quote).

Higit sa isang milyong user ang umaasa sa FXStreet para sa real-time market data, charting tools, expert insights, at Forex news. Ang komprehensibong economic calendar at educational webinars nito ay tumutulong sa mga trader na manatiling may alam at gumawa ng kalkuladong mga desisyon. Sinusuportahan ang FXStreet ng humigit-kumulang 60 propesyonal sa pagitan ng Barcelona HQ at iba’t ibang rehiyon sa buong mundo.
Magbasa pa


