
Trade The World
AUD/JPY Price Forecast: Reaches fresh five-month highs near 97.00
Ni Akhtar Faruqui
Petsa ng Pag-publish: 11 Jul 2025 | Petsa ng Pag-edit: 11 Jul 2025


POPULAR ARTICLES

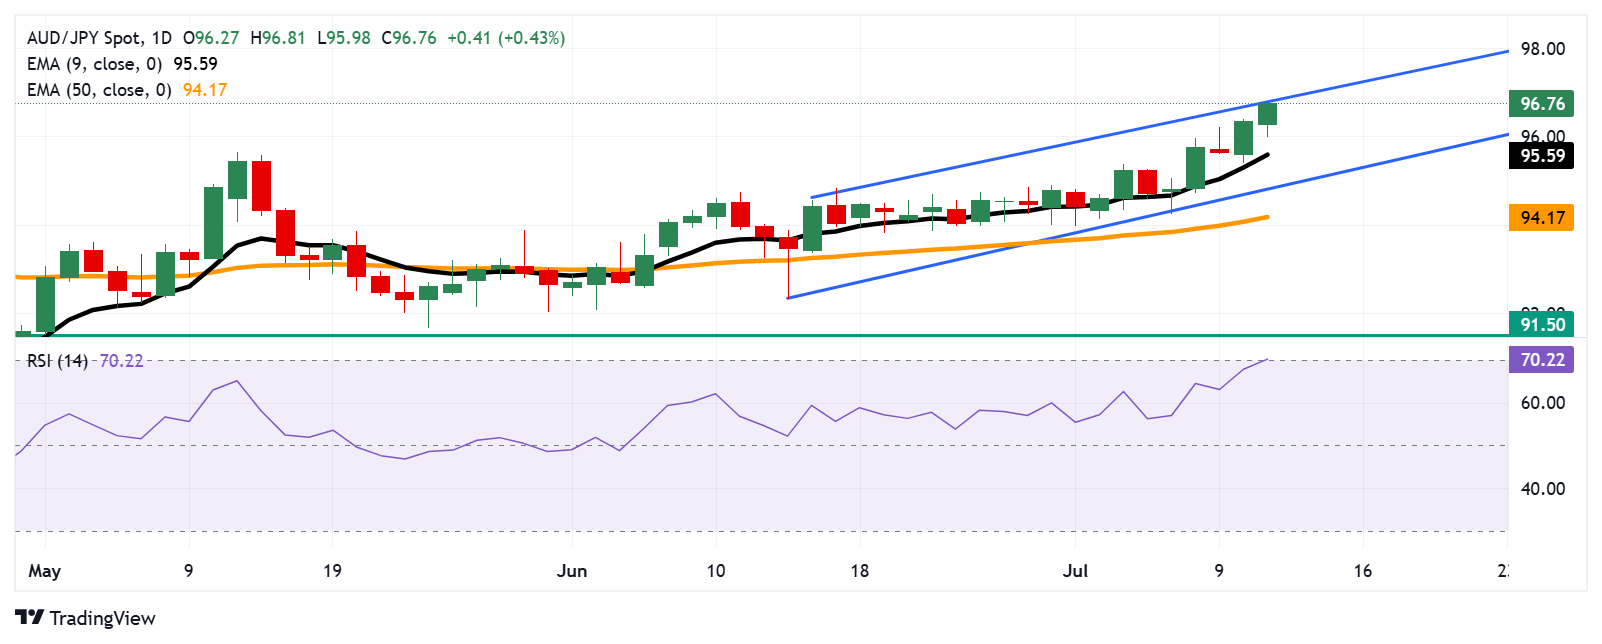
AUD/JPY extends its gains for the second successive session, trading around 96.70 during the Asian hours on Friday. As per the technical analysis of the daily chart, the currency cross remains within the ascending channel pattern, indicating a prevailing bullish bias.
- AUD/JPY has reached a five-month high at 95.81 on Friday.
- The 14-day Relative Strength Index stands at the 70 mark, indicating overbought conditions.
- The immediate support appears at the nine-day EMA of 95.59.
AUD/JPY extends its gains for the second successive session, trading around 96.70 during the Asian hours on Friday. As per the technical analysis of the daily chart, the currency cross remains within the ascending channel pattern, indicating a prevailing bullish bias.
The 14-day Relative Strength Index (RSI) is hovering around the 70 mark, reinforcing bullish momentum but also indicating overbought conditions, which could signal an impending downward correction. However, the AUD/JPY cross rises above the nine-day Exponential Moving Average (EMA), indicating short-term price momentum is stronger.
On the upside, the AUD/JPY cross is testing the upper boundary of the ascending channel around 96.90, marking fresh five-month highs. A successful breach above the channel could strengthen the bullish bias and prompt the currency cross to test the psychological level of 97.00.
The AUD/JPY cross may find immediate support at the nine-day EMA of 95.59. A successful break below the level would weaken the short-term price momentum and put downward pressure on the currency cross to target the ascending channel’s lower boundary around 94.80, followed by the 50-day EMA at 94.15.
AUD/JPY: Daily Chart
Australian Dollar PRICE Today
The table below shows the percentage change of Australian Dollar (AUD) against listed major currencies today. Australian Dollar was the strongest against the Japanese Yen.
| USD | EUR | GBP | JPY | CAD | AUD | NZD | CHF | |
|---|---|---|---|---|---|---|---|---|
| USD | 0.18% | 0.13% | 0.50% | 0.27% | -0.01% | 0.25% | 0.08% | |
| EUR | -0.18% | -0.06% | 0.33% | 0.09% | -0.11% | 0.06% | -0.10% | |
| GBP | -0.13% | 0.06% | 0.42% | 0.13% | -0.04% | 0.16% | -0.08% | |
| JPY | -0.50% | -0.33% | -0.42% | -0.22% | -0.52% | -0.28% | -0.45% | |
| CAD | -0.27% | -0.09% | -0.13% | 0.22% | -0.22% | -0.04% | -0.20% | |
| AUD | 0.00% | 0.11% | 0.04% | 0.52% | 0.22% | 0.31% | 0.00% | |
| NZD | -0.25% | -0.06% | -0.16% | 0.28% | 0.04% | -0.31% | -0.21% | |
| CHF | -0.08% | 0.10% | 0.08% | 0.45% | 0.20% | -0.01% | 0.21% |
The heat map shows percentage changes of major currencies against each other. The base currency is picked from the left column, while the quote currency is picked from the top row. For example, if you pick the Australian Dollar from the left column and move along the horizontal line to the US Dollar, the percentage change displayed in the box will represent AUD (base)/USD (quote).

FXStreet
Higit sa isang milyong user ang umaasa sa FXStreet para sa real-time market data, charting tools, expert insights, at Forex news. Ang komprehensibong economic calendar at educational webinars nito ay tumutulong sa mga trader na manatiling may alam at gumawa ng kalkuladong mga desisyon. Sinusuportahan ang FXStreet ng humigit-kumulang 60 propesyonal sa pagitan ng Barcelona HQ at iba’t ibang rehiyon sa buong mundo.
Read More


