
Trade The World
BONK, WIF, FLOKI Price Prediction: Meme coins to watch as Bitcoin hits record high
Ni Vishal Dixit
Petsa ng Pag-publish: 11 Jul 2025 | Petsa ng Pag-edit: 11 Jul 2025


POPULAR ARTICLES

Meme coins Bonk (BONK), Dogwifhat (WIF), and Floki (FLOKI) are positioned to extend gains as the weekly recovery reaches crucial resistance levels. The meme coins gain bullish momentum on the back of Bitcoin’s (BTC) recovery run, hitting a new all-time high on Thursday.
- Bonk eyes further gains as it breaks out of an inverted head-and-shoulders pattern.
- Dogwifhat reclaims the $1 psychological level, now aims to surpass the 200-day EMA.
- Floki’s channel breakout rally inches closer to the 50% retracement as bullish momentum rises.
Meme coins Bonk (BONK), Dogwifhat (WIF), and Floki (FLOKI) are positioned to extend gains as the weekly recovery reaches crucial resistance levels. The meme coins gain bullish momentum on the back of Bitcoin’s (BTC) recovery run, hitting a new all-time high on Thursday. Furthermore, with the improving risk-on sentiment alongside Bitcoin's dominance declining below 65%, meme coins are the most likely front-runners of the next bull cycle.
Bonk’s pattern breakout rally needs another bullish close
Bonk edges higher by over 2% on Friday, reaching a new 30-day high following the 12% surge on Thursday. The meme coin breaks out of an inverted head and shoulders pattern with a neckline at $0.00002375 marked by the May 10 close on the daily chart.
As BONK exceeds the neckline, it also surpasses the 50% Fibonacci retracement level at $0.00002350, which is retraced between the November 20 high of $0.00006230 and the April 7 low of $0.00000886.
If BONK upholds the neckline breakout, it could target the 61.8% Fibonacci level at $0.00002958, followed by the 78.6% level at $0.00004105.
The technical indicators display a buy signal with the crossover of the 50-day and 100-day Exponential Moving Averages (EMAs).
The momentum indicators indicate a bullish bias as the Relative Strength Index (RSI) enters the overbought zone, while the Moving Average Convergence/Divergence (MACD) indicator displays an upward trend in the MACD and its signal line.
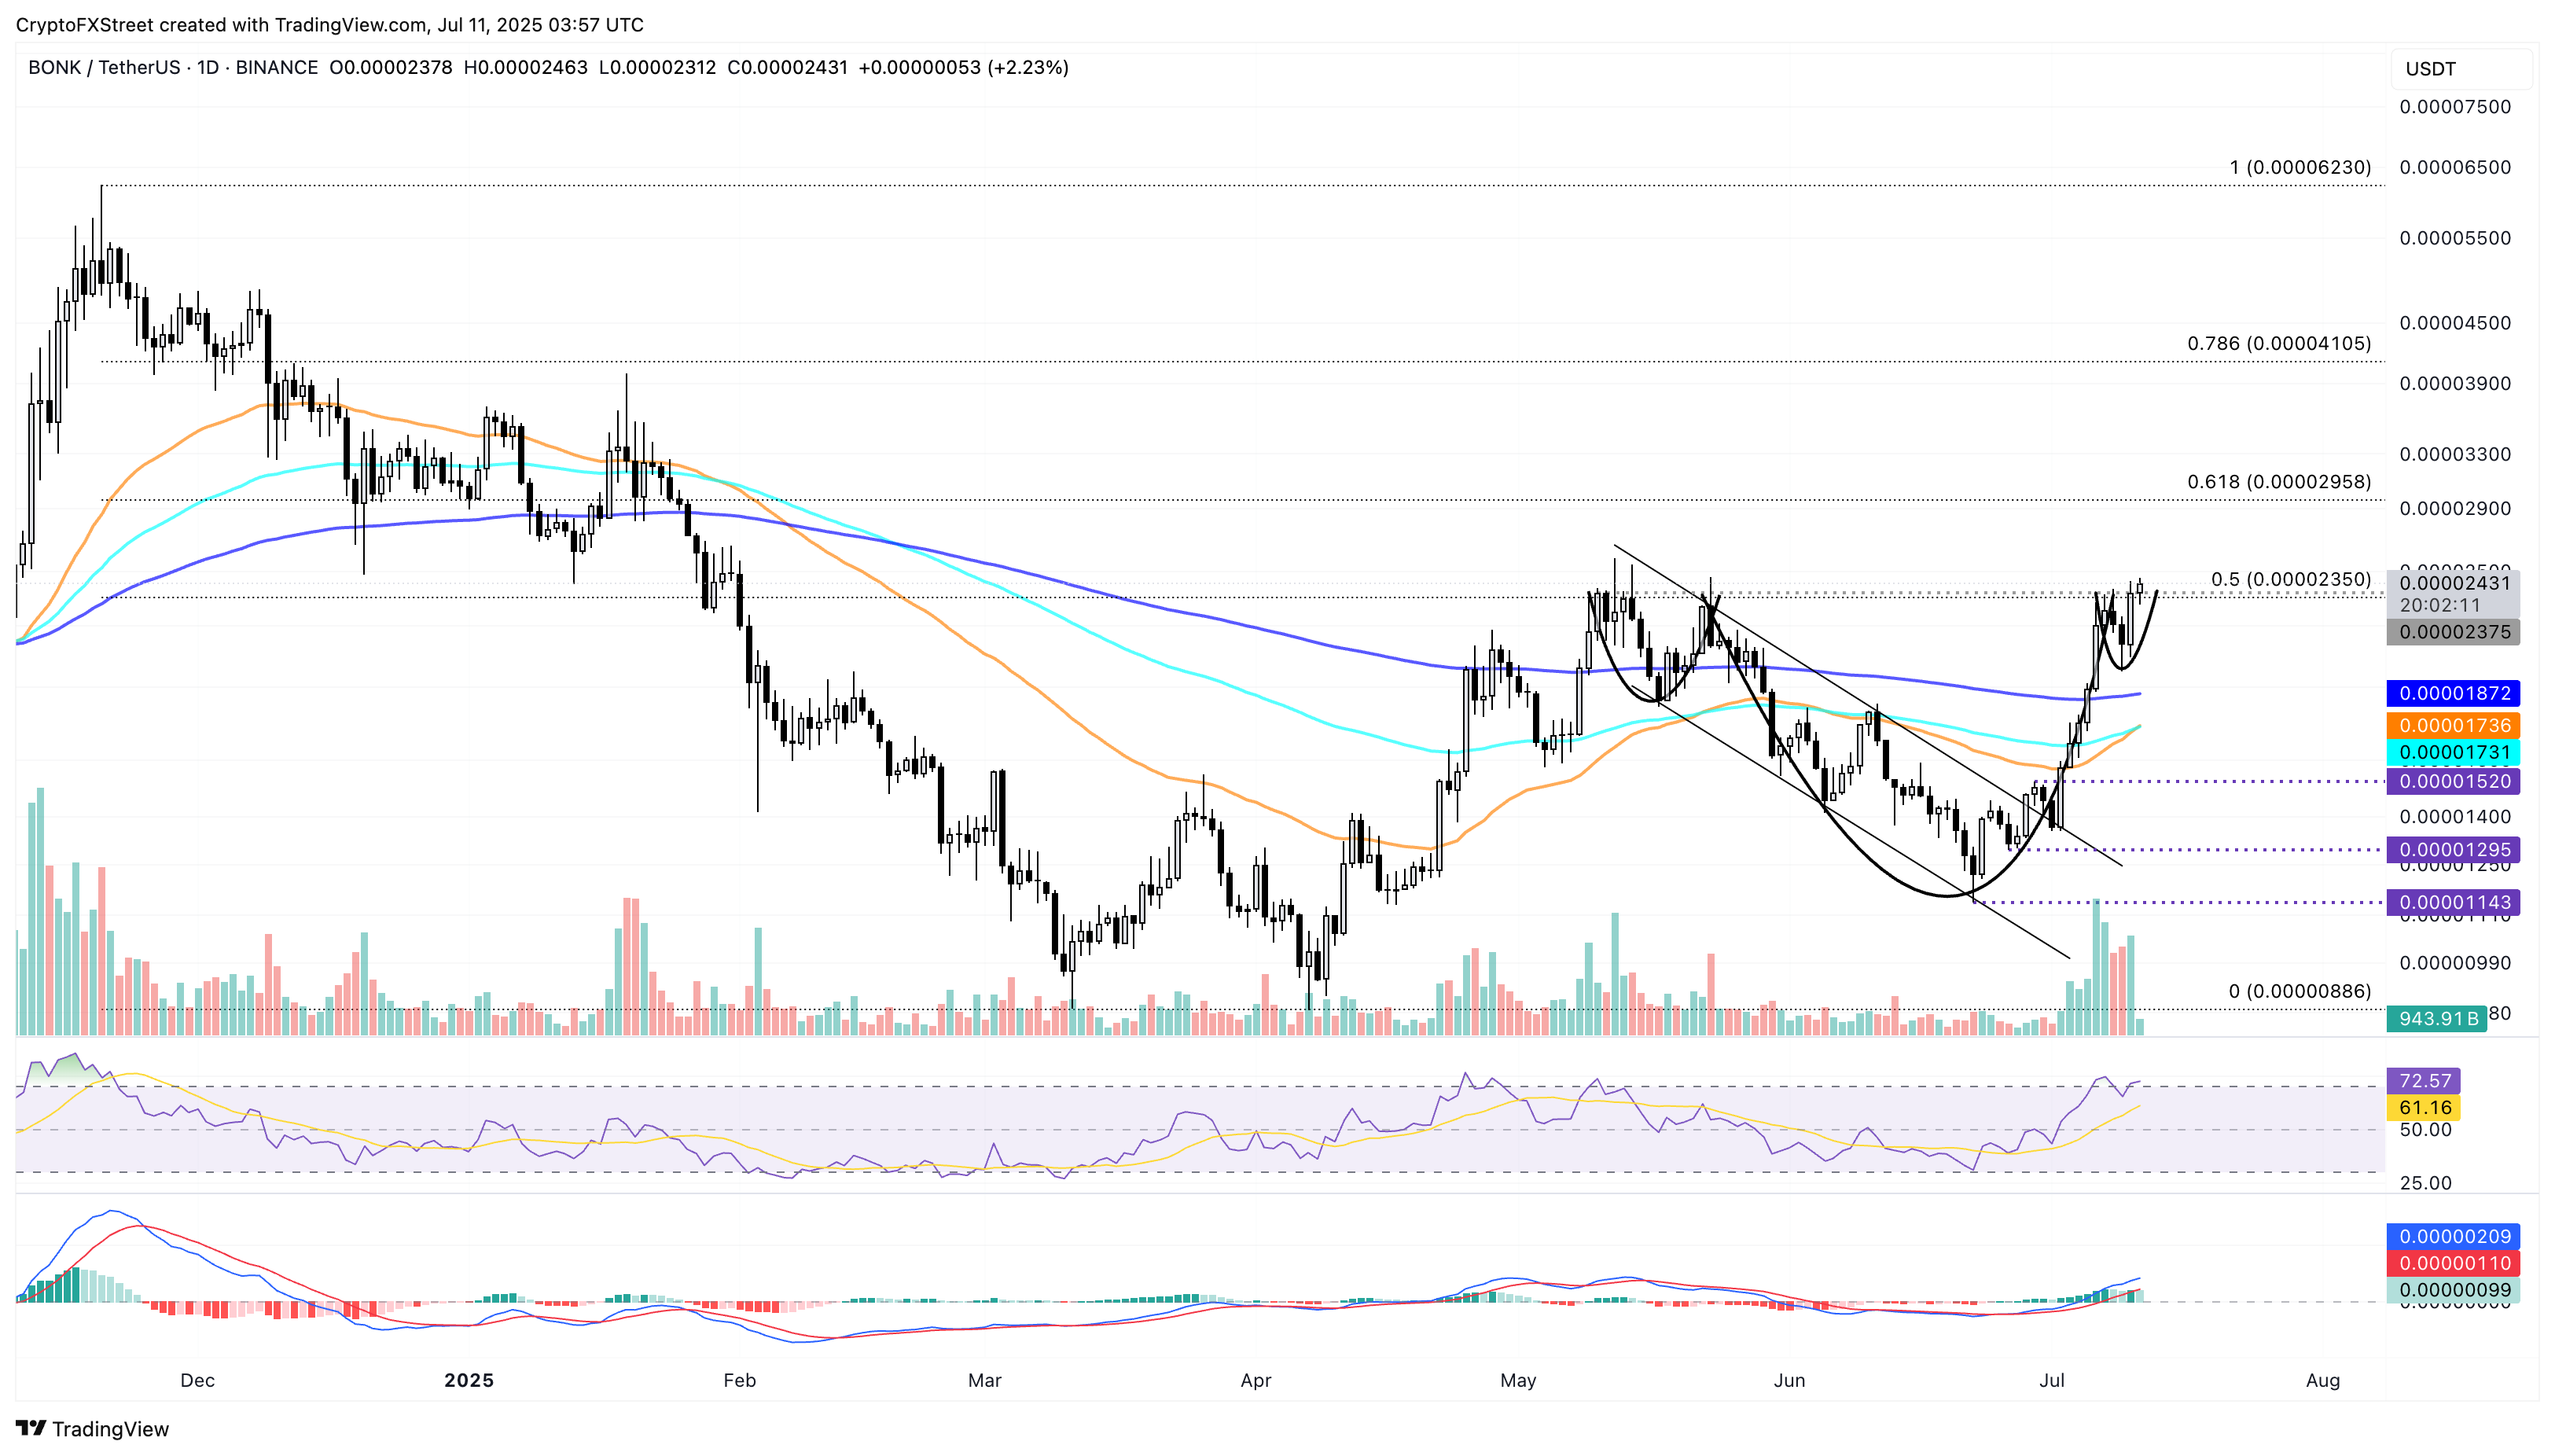
BONK/USDT daily price chart.
The 200-day EMA at $0.00001871 could absorb the incoming supply if BONK fails to sustain above the 50% Fibonacci level.
WIF aims to surpass the 200-day EMA
Dogwifhat reclaims the $1.00 round figure and edges higher to challenge the 200-day EMA at $1.066. The declining broadening wedge breakout in WIF upholds momentum with its third consecutive bullish candle.
A daily close above the 200-day EMA could propel WIF towards the 50% Fibonacci retracement level at $1.212, drawn from the November 12 peak at $4.830 to the April 9 low at $0.304. If the meme coin reclaims $1.212, it could target the 61.8% level at $1.679.
The MACD indicator displays a rising histogram from the zero line, suggesting increased bullish momentum. The RSI at 63 edges closer to the overbought zone with room for growth.
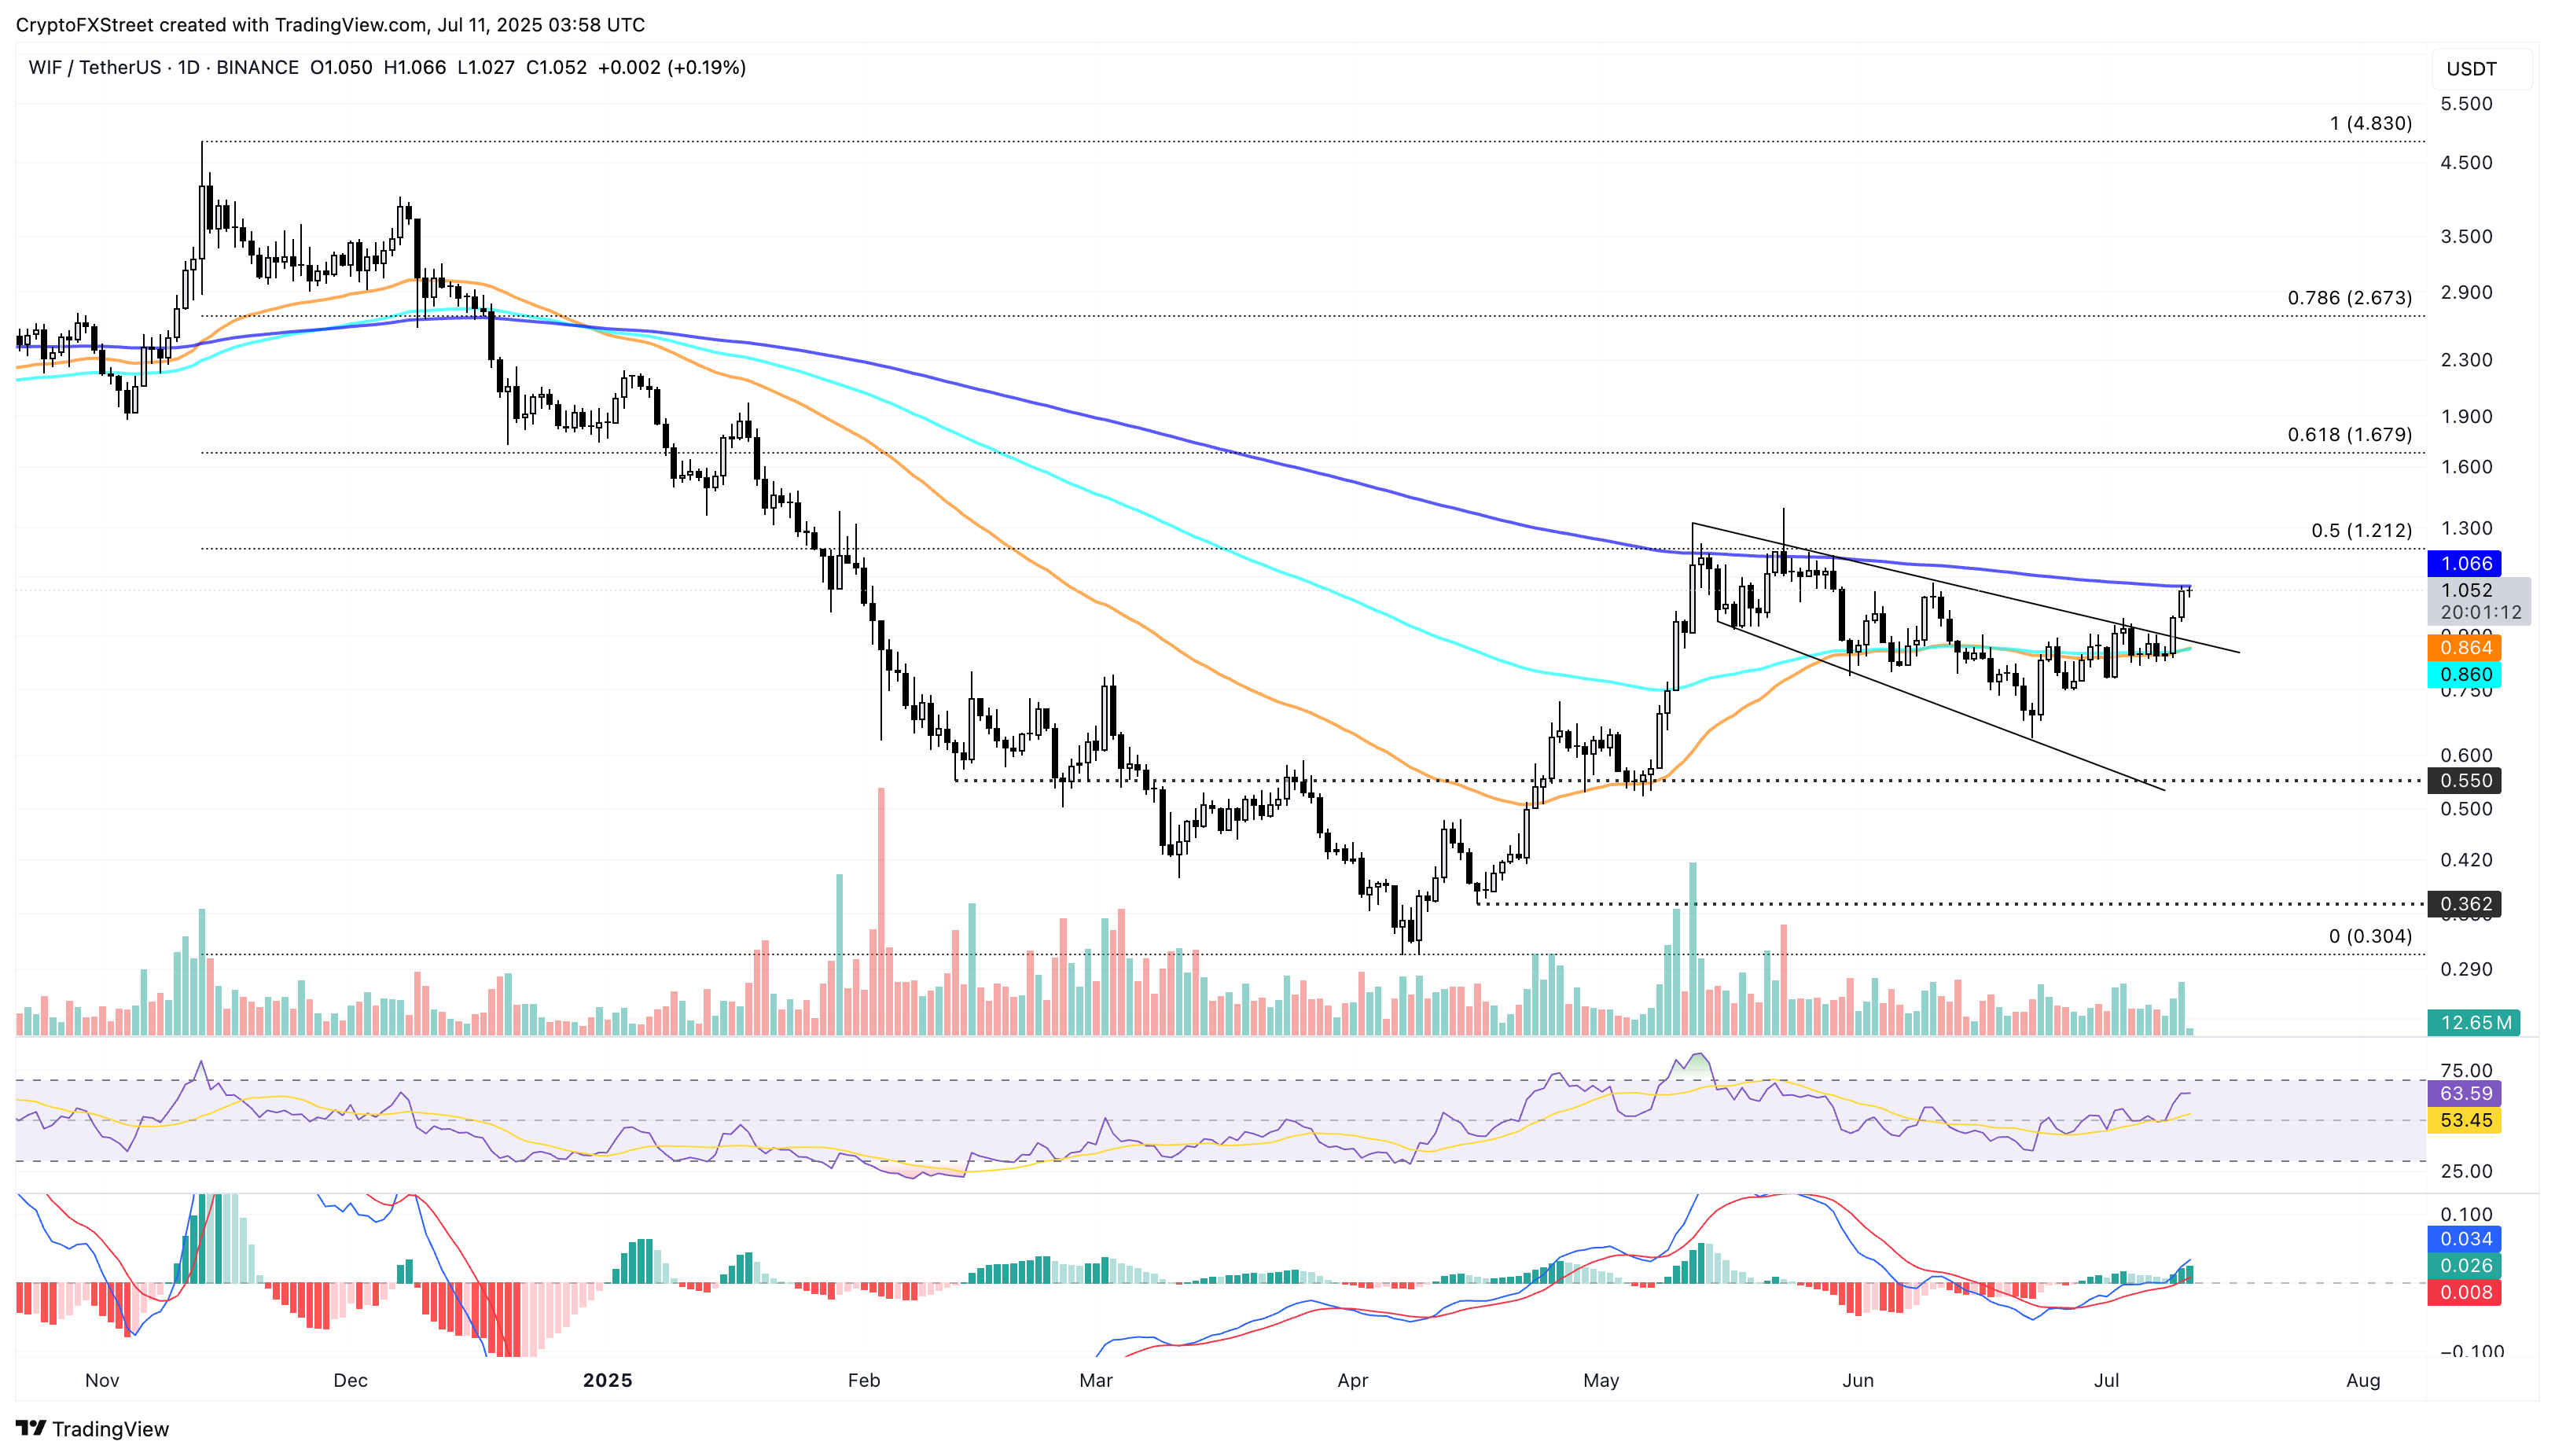
WIF/USDT daily price chart.
If WIF reverses from the 200-day EMA, it could retest the 100-day EMA at $0.860.
Channel breakout fuels FLOKI’s uptrend
Floki’s channel breakout rally exceeds the 200-day EMA and reclaims the $0.0001000 psychological level. The uptrend now aims to surpass the 50% level at $0.0001148, retraced from $0.0002900 on November 21 to $0.0000455 on April 7, marking a potential trend reversal.
Typically, investors with buying pressure above the 50% Fibonacci level fuel the buying pressure to find better exit positions. Such investors could book profits at the 61.8% Fibonacci level, located at $0.0001428, which would position it as a potential resistance.
The MACD and signal lines cross above the zero line, alongside the RSI at 68, indicating a bullish shift in momentum.
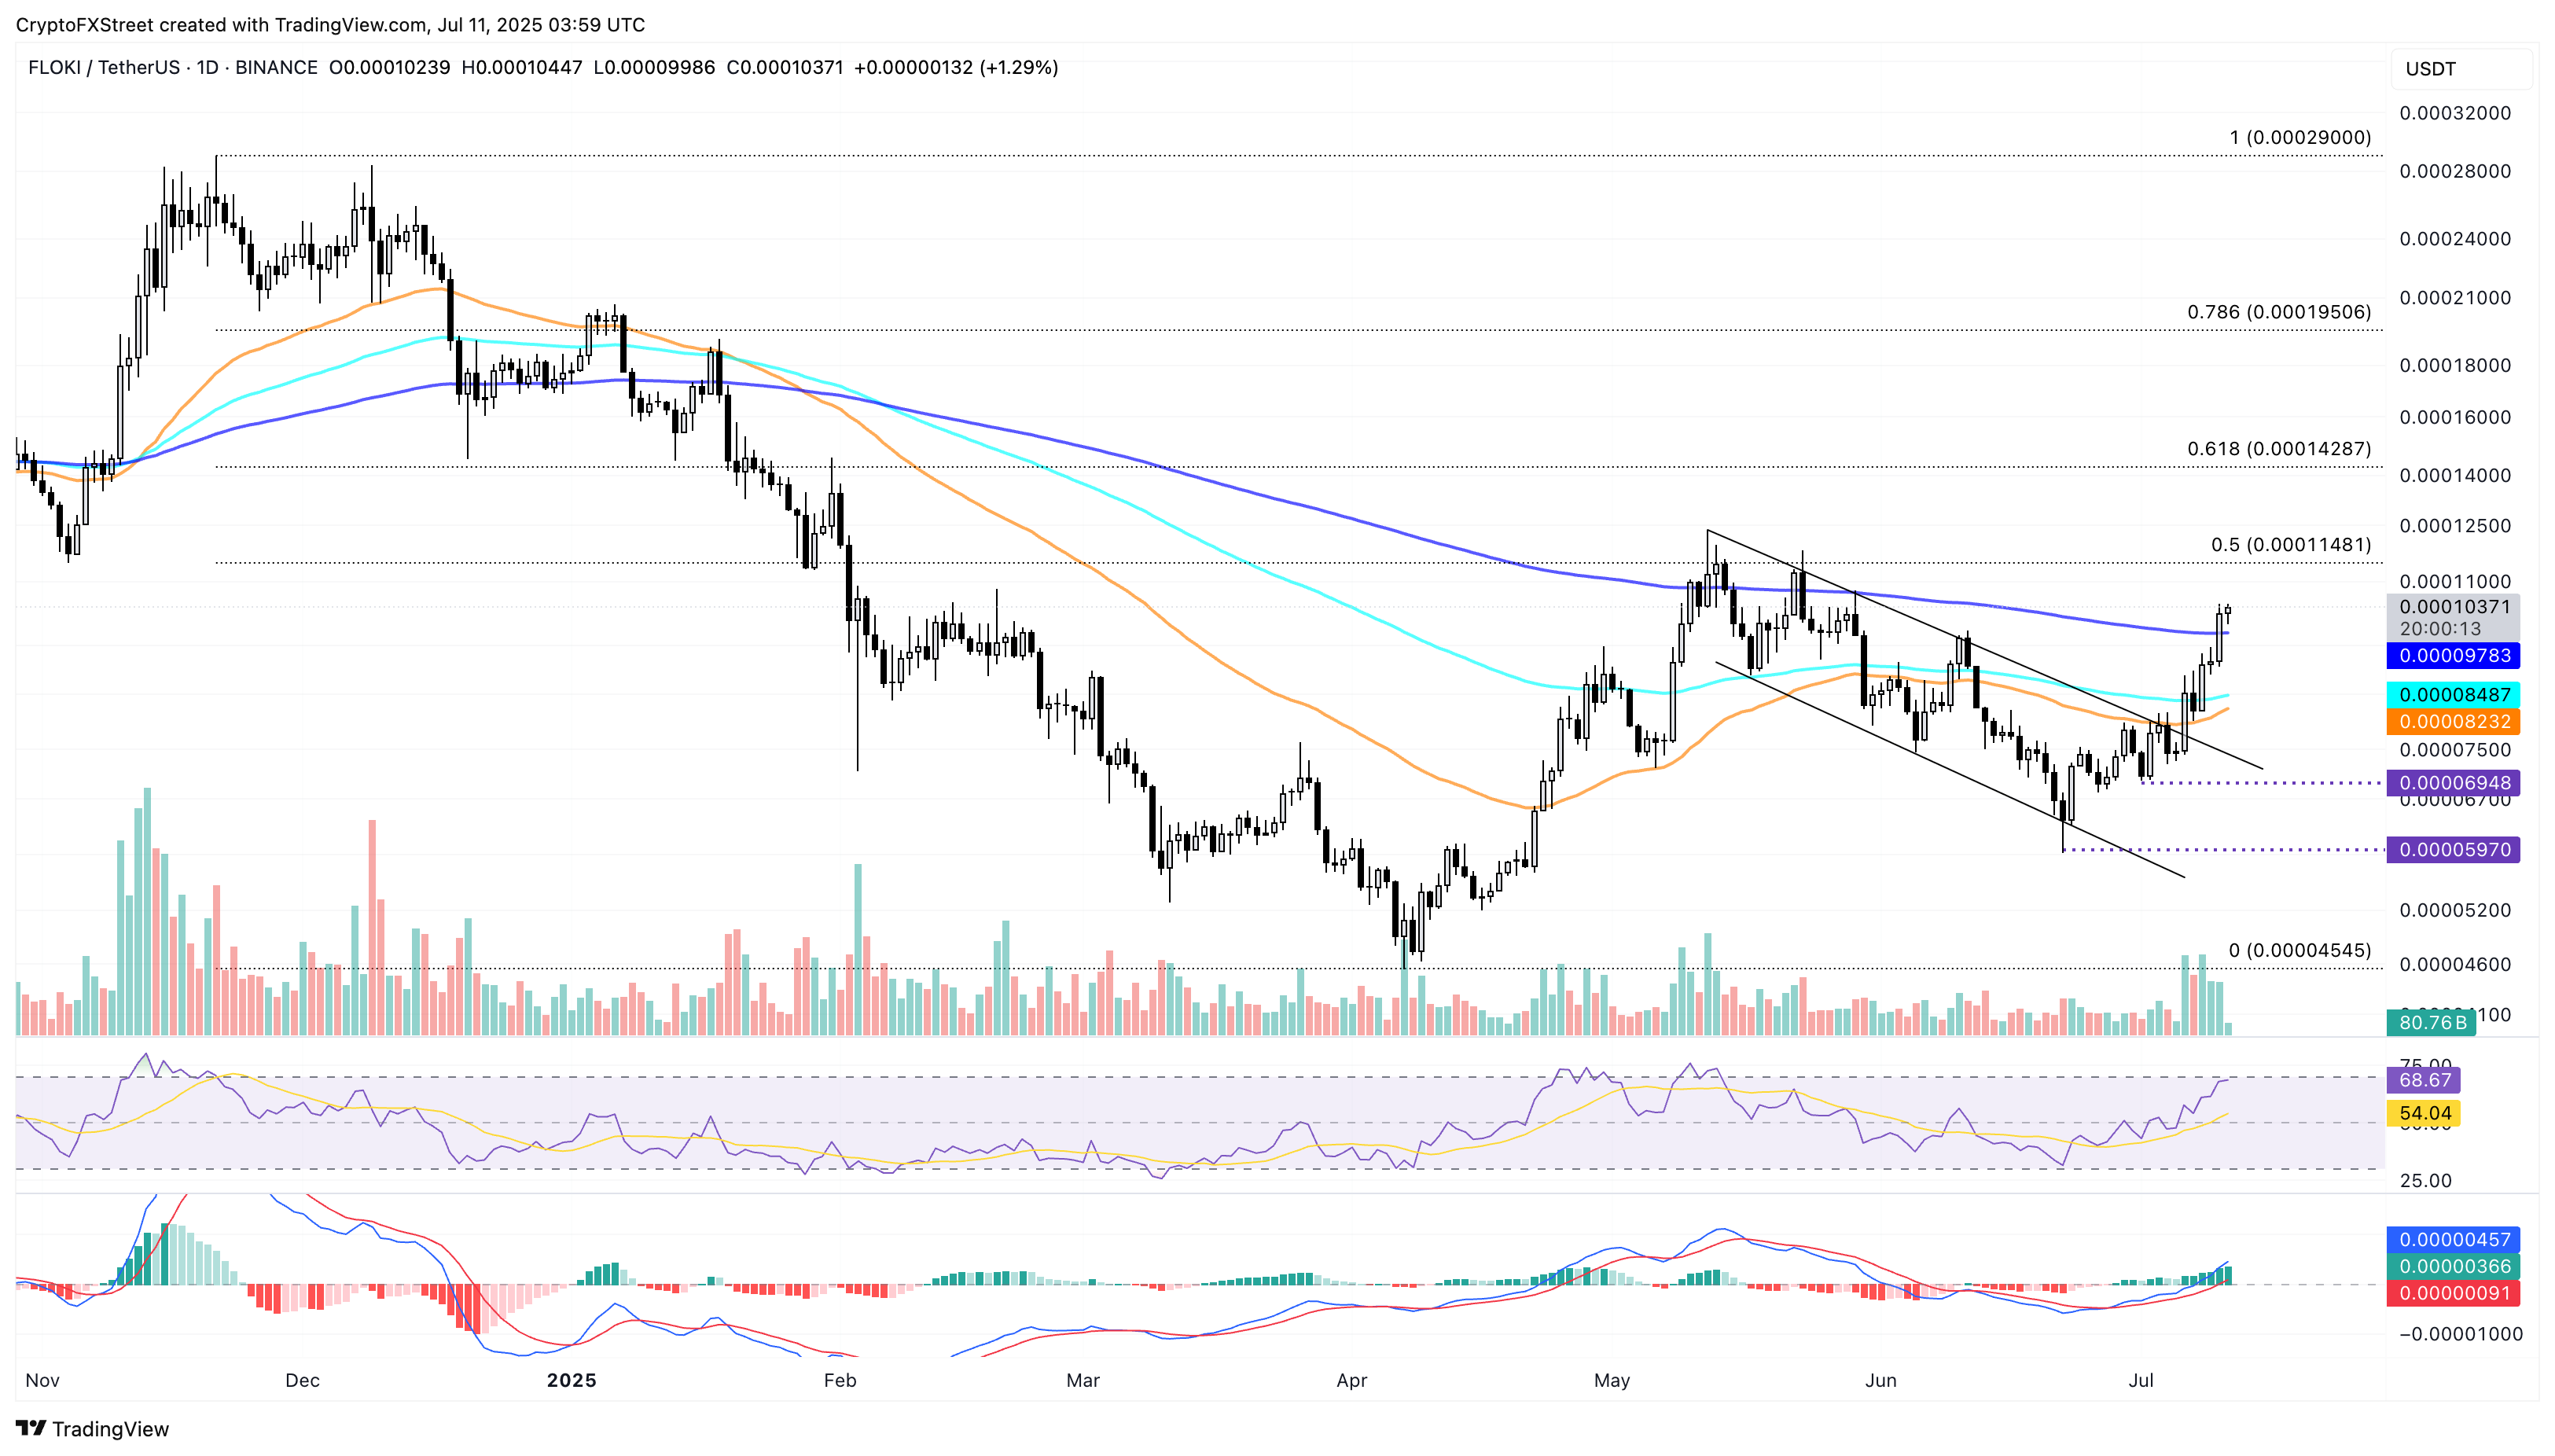
FLOKI/USDT daily price chart.
On the downside, if FLOKI fails to hold above the 200-day EMA, it could test the 100-day EMA at $0.0000848.

FXStreet
Higit sa isang milyong user ang umaasa sa FXStreet para sa real-time market data, charting tools, expert insights, at Forex news. Ang komprehensibong economic calendar at educational webinars nito ay tumutulong sa mga trader na manatiling may alam at gumawa ng kalkuladong mga desisyon. Sinusuportahan ang FXStreet ng humigit-kumulang 60 propesyonal sa pagitan ng Barcelona HQ at iba’t ibang rehiyon sa buong mundo.
Read More


