
Cardano Price Forecast: ADA builds recovery momentum as sentiment improves
Ni John Isige
Petsa ng Pag-publish: 4 Dec 2025 | Petsa ng Pag-edit: 4 Dec 2025


Sikat na Artikulo

Cardano (ADA) is extending its recovery for the second consecutive day, trading at around $0.4400 at the time of writing on Thursday. If this recovery leg from Monday's $0.3707 level steadies in the coming days, Cardano bulls could push toward a bullish December.
- Cardano rises above $0.4400 as bulls look to extend gains in December.
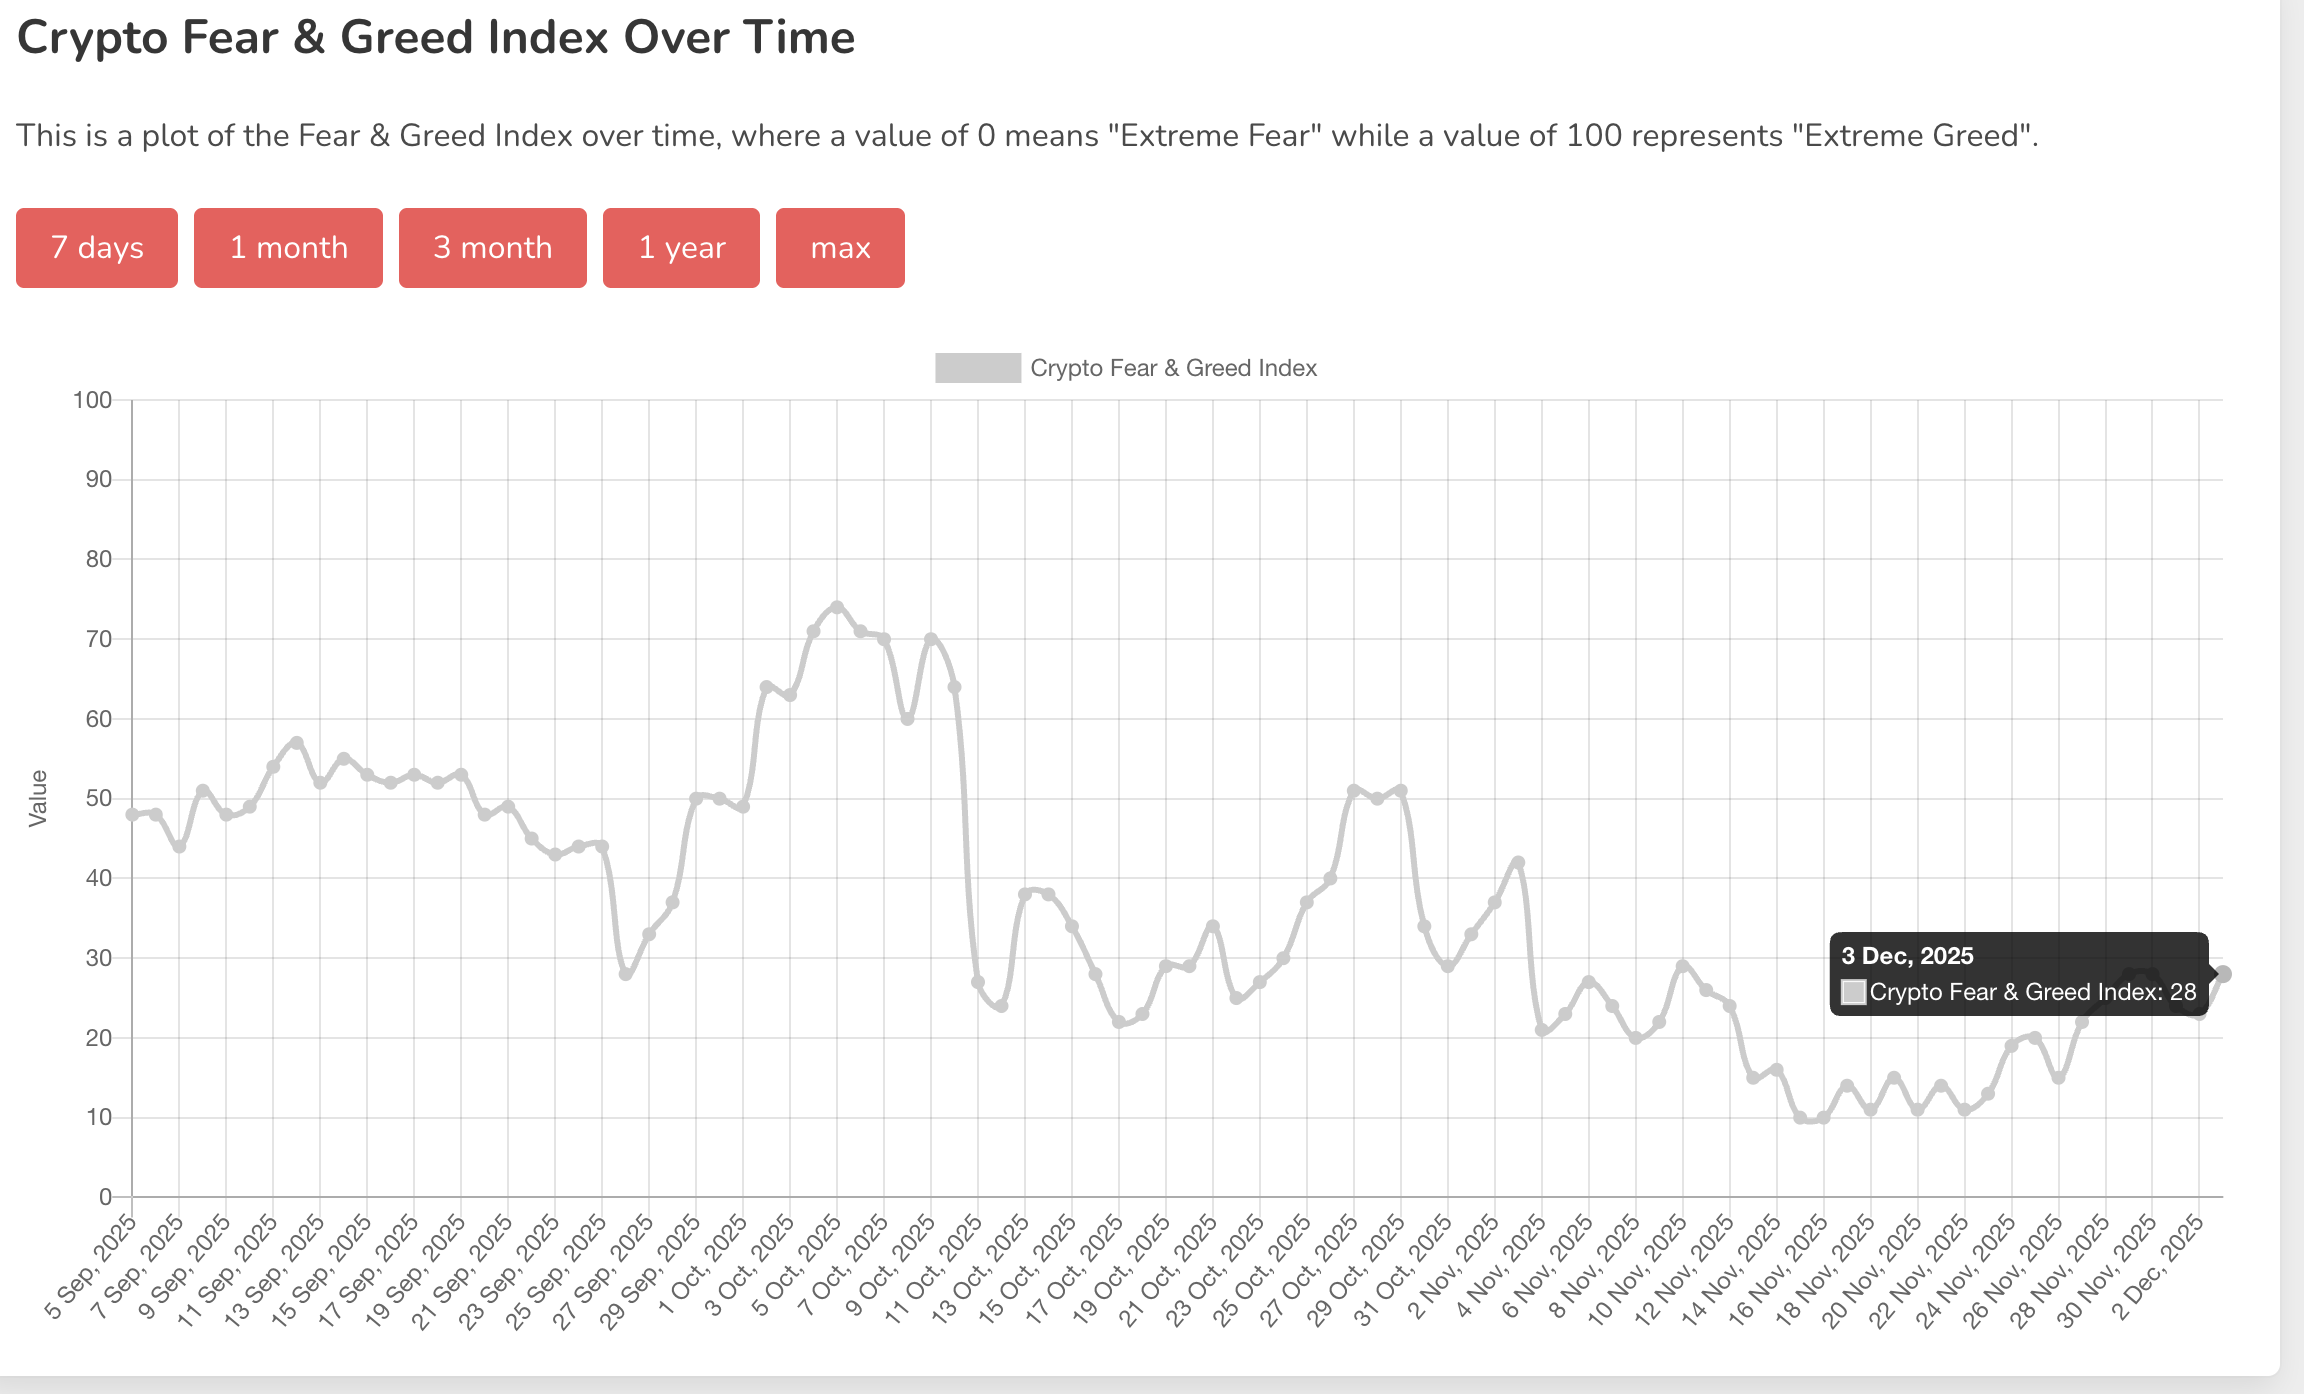
- Sentiment surrounding ADA improves in tandem with the Crypto Fear & Greed Index.
- A MACD buy signal reinforces the bullish grip, but an RSI still in a bearish region could hold Cardano back.
Cardano (ADA) is extending its recovery for the second consecutive day, trading at around $0.4400 at the time of writing on Thursday. If this recovery leg from Monday's $0.3707 level steadies in the coming days, Cardano bulls could push toward a bullish December.
Cardano aims to extend bullish momentum
Sentiment surrounding Cardano has been improving over the last few days, reinforcing its short-term bullish outlook. Total positive sentiment stands at 58, up from 40 on November 27 and 30 on November 23.
A steady increase in this metric would expand risk appetite toward Cardano and boost its recovery potential.
 [16-1764772682884-1764772682884.34.25, 03 Dec, 2025].png)
Meanwhile, the Crypto Fear & Greed Index stands at 26 as of Thursday, suggesting the market is in fear mode, with sell-offs persistent and investors worried.
Still, the same fear sentiment could imply a buying opportunity, encouraging investors to buy when prices are falling or low. The opposite of fear is greed mode, which often signals that the asset or market is due for a correction.
Technical outlook: Can ADA sustain its rebound?
The ADA/USD pair is trading above $0.4400 at the time of writing on Thursday. The smart contracts token is also well below the declining 50-day Exponential Moving Average (EMA) at $0.5324, the 100-day EMA at $0.6170, and the 200-day EMA at $0.6735, preserving a bearish bias and keeping rebounds contained.
A daily close back above the 50-day EMA would ease pressure. Furthermore, the Moving Average Convergence Divergence (MACD) histogram bars have turned green on the daily chart and are expanding above the zero line, indicating the blue MACD line stands above the red signal line, with improving momentum.

Still, the Relative Strength Index (RSI) sits at 44, below the 50 midline on the same daily chart, suggesting upside remains tentative. The descending trend line from $1.3249 continues to cap the market, with resistance seen at $0.8855. Parabolic SAR prints above the price near $0.5234, reinforcing the downside tone.
A close above the 50-day EMA at $0.5355 could open a recovery toward the 100-day EMA at $0.6170, while failure to clear the SAR would keep rallies short-lived and leave bears in control.
Cryptocurrency metrics FAQs
The developer or creator of each cryptocurrency decides on the total number of tokens that can be minted or issued. Only a certain number of these assets can be minted by mining, staking or other mechanisms. This is defined by the algorithm of the underlying blockchain technology. On the other hand, circulating supply can also be decreased via actions such as burning tokens, or mistakenly sending assets to addresses of other incompatible blockchains.
Market capitalization is the result of multiplying the circulating supply of a certain asset by the asset’s current market value.
Trading volume refers to the total number of tokens for a specific asset that has been transacted or exchanged between buyers and sellers within set trading hours, for example, 24 hours. It is used to gauge market sentiment, this metric combines all volumes on centralized exchanges and decentralized exchanges. Increasing trading volume often denotes the demand for a certain asset as more people are buying and selling the cryptocurrency.
Funding rates are a concept designed to encourage traders to take positions and ensure perpetual contract prices match spot markets. It defines a mechanism by exchanges to ensure that future prices and index prices periodic payments regularly converge. When the funding rate is positive, the price of the perpetual contract is higher than the mark price. This means traders who are bullish and have opened long positions pay traders who are in short positions. On the other hand, a negative funding rate means perpetual prices are below the mark price, and hence traders with short positions pay traders who have opened long positions.
(The technical analysis of this story was written with the help of an AI tool)

Higit sa isang milyong user ang umaasa sa FXStreet para sa real-time market data, charting tools, expert insights, at Forex news. Ang komprehensibong economic calendar at educational webinars nito ay tumutulong sa mga trader na manatiling may alam at gumawa ng kalkuladong mga desisyon. Sinusuportahan ang FXStreet ng humigit-kumulang 60 propesyonal sa pagitan ng Barcelona HQ at iba’t ibang rehiyon sa buong mundo.
Magbasa pa


