
Trade The World
Chainlink Price Forecast: LINK eyes recovery as whales accumulate amid fading bearish momentum
Ni Manish Chhetri
Petsa ng Pag-publish: 22 Oct 2025 | Petsa ng Pag-edit: 22 Oct 2025


POPULAR ARTICLES

Chainlink (LINK) price steadies around $17.66 at the time of writing on Wednesday after facing rejection from the key resistance zone the previous day. On-chain data paints a bullish outlook as certain whale wallets are accumulating LINK tokens.
- Chainlink hovers around $17.66 on Wednesday after facing rejection from the key resistance zone the previous day.
- On-chain data shows that certain whale wallets are accumulating LINK during recent price dips.
- The technical outlook points to a potential rebound as momentum indicators suggest bearish pressure is easing.
Chainlink (LINK) price steadies around $17.66 at the time of writing on Wednesday after facing rejection from the key resistance zone the previous day. On-chain data paints a bullish outlook as certain whale wallets are accumulating LINK tokens. Moreover, the technical analysis suggests a recovery as momentum indicators suggest easing bearish pressure.
Chainlink on-chain and derivatives data suggest a recovery ahead
Santiment’s Supply Distribution data supports a bullish outlook for Chainlink, as certain whales are buying LINK at recent price dips.
The metric indicates that whales holding between 100,000 and 1 million LINK tokens (red line) and 10 million and 100 million LINK tokens (blue line) have accumulated a total of 12.21 million LINK tokens from Friday to Wednesday. During the same period, wallets holding between 1 million and 10 million LINK tokens (yellow line) have shed 11.87 million tokens.
This shows that the second cohort of whales could have fallen prey to the capitulation event. In contrast, the first set of wallets seized the opportunity and accumulated Chainlink at a discount.
 [09-1761110696483-1761110696497.49.28, 22 Oct, 2025].png)
Chainlink supply distribution chart. Source: Santiment
CryptoQuant’s chart below shows that Chainlink’s Futures Average Order Size has large average order sizes, suggesting increased participation from whale investors, which further supports the bullish view.
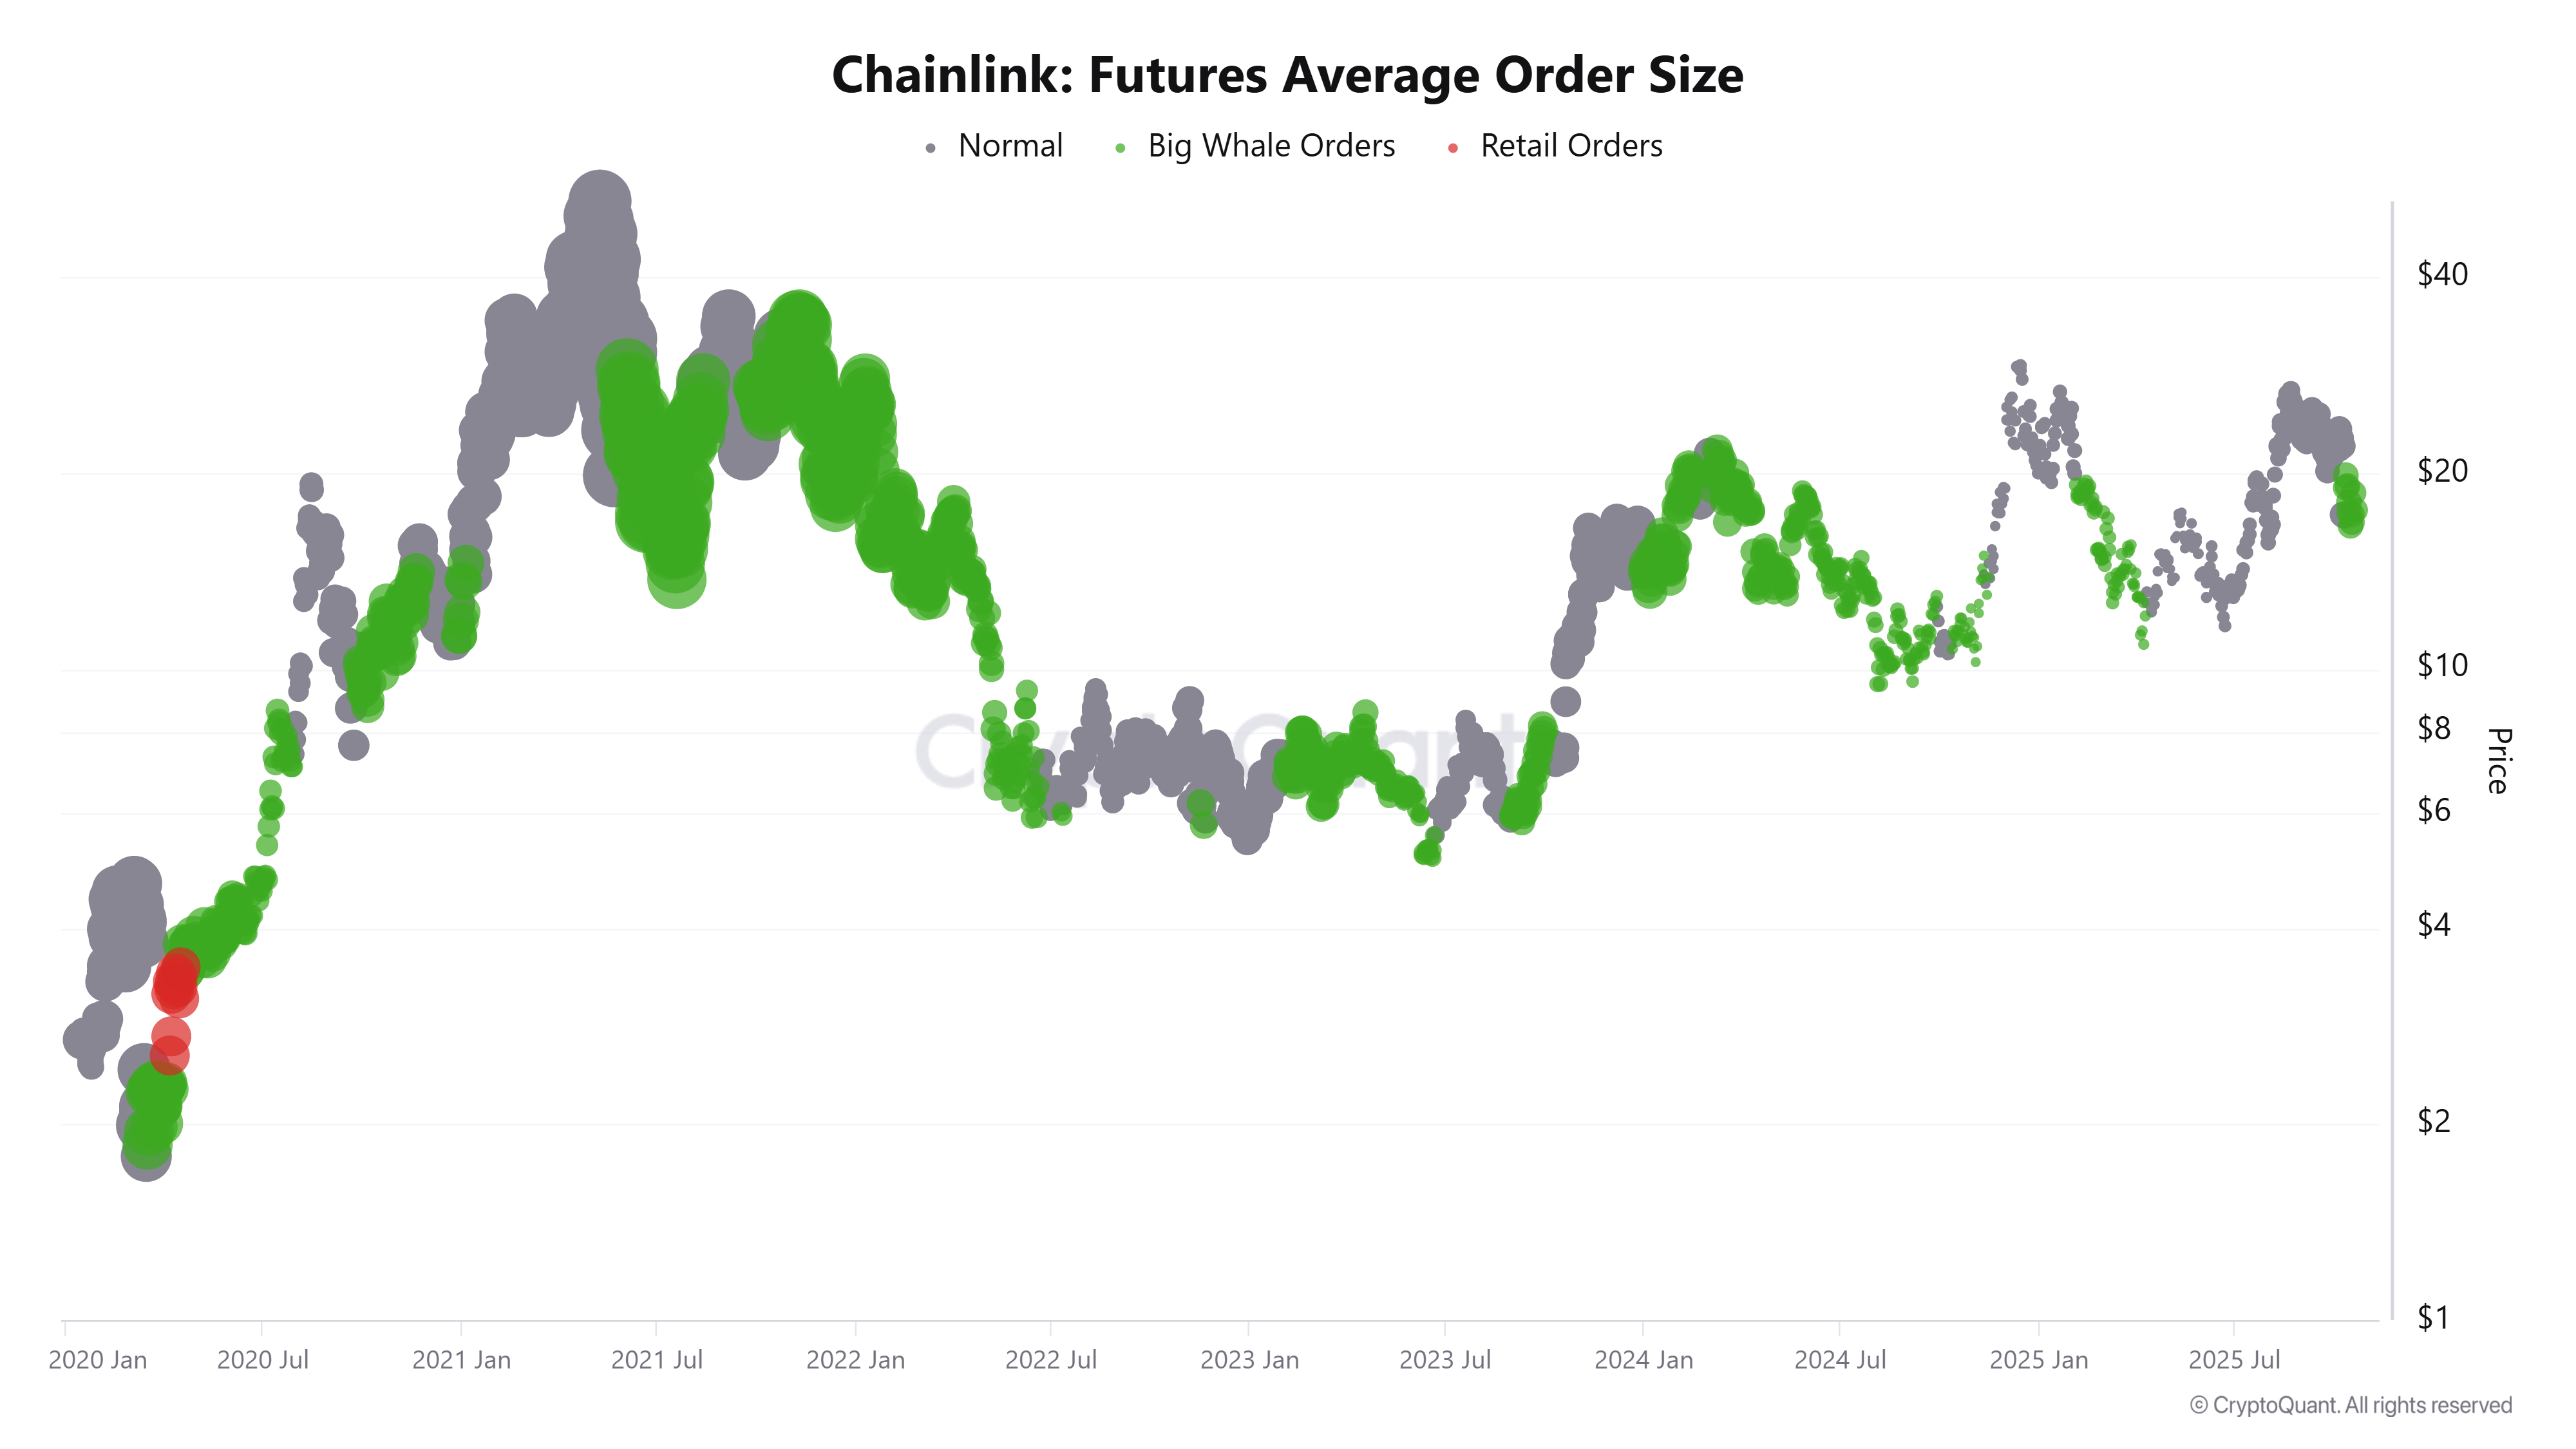
LINK Futures Average Order Size chart. Source: CryptoQuant
On the derivatives side, Coinglass’s long-to-short ratio for LINK reads 1.11 on Wednesday, the highest level over a month. The ratio above one suggests that more traders are betting on the Chainlink price to rally.
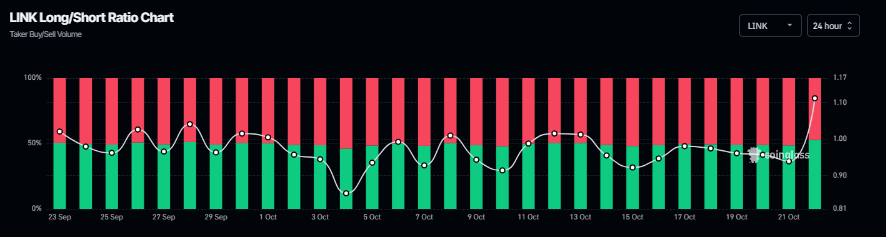
Chainlink long-to-short ratio chart. Source: Coinglass
Chainlink’s growing industry adoption
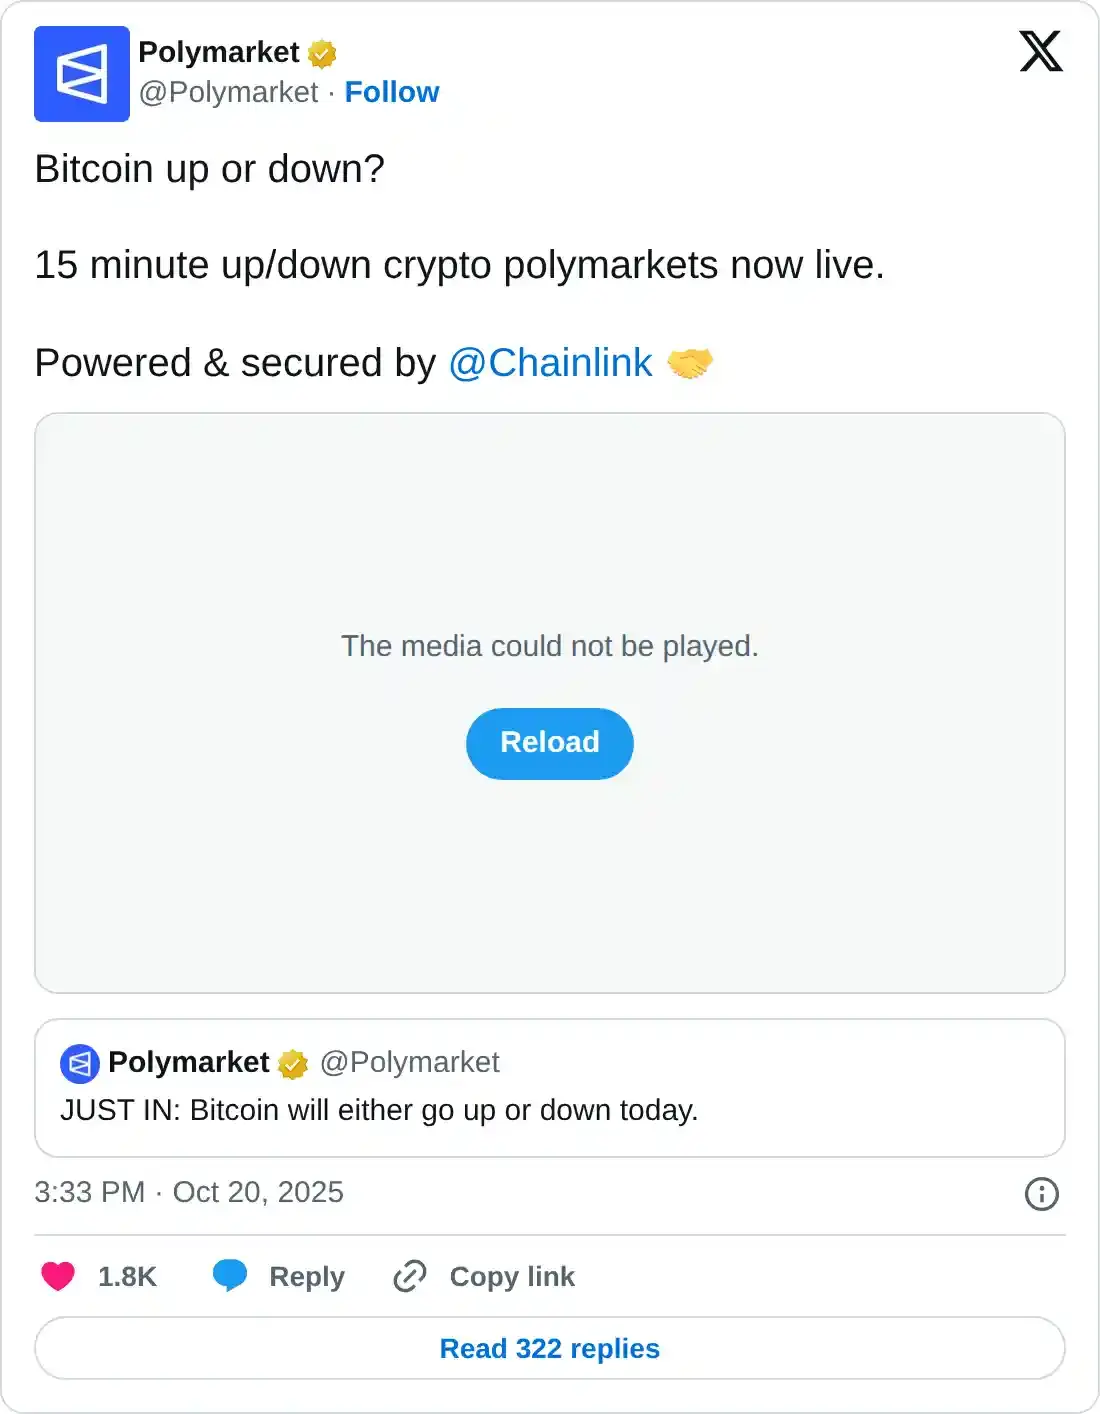
Chainlink announced on Monday that Polymarket launched 15-minute up/down crypto prediction markets on the platform.
Additionally, on Tuesday, Treehouse, a decentralized fixed income platform with over $375 million in Total Value Locked (TVL), has adopted Chainlink CCIP and made tETH and TREE Cross-Chain Tokens (CCTs). Users can now transfer tETH across Arbitrum, Base, Ethereum, and TAC and TREE across BNB Chain and Ethereum.
During the same period, ElizaOS, a platform for building AI agents, has adopted Chainlink’s CCT standard to enable its token, ElizaOS, to be natively transferable across chains via CCIP, expanding its reach throughout the multi-chain ecosystem.
These growing developments and partnerships underscore Chainlink’s enhanced real-world utility, increased institutional credibility, and broader adoption, which support a bullish outlook for its native token in the long term.
Chainlink Price Forecast: LINK shows early signs of fading bearish momentum
Chainlink price found support around the 50% retracement level at 15.82 on Friday and recovered over 12% in the next three days. However, LINK declined slightly after facing rejection from the 200-day EMA at $18.97 on Tuesday. At the time of writing on Wednesday, it hovers at around $17.71.
If LINK recovers and closes above the 200-day EMA at $18.97, it could extend the rally toward the next daily resistance at $23.81.
The Relative Strength Index (RSI) on the daily chart reads 41, pointing upward toward the neutral level of 50, indicating early signs of fading bearish momentum. For the recovery rally to be sustained, the RSI must move above the neutral level. The Moving Average Convergence Divergence (MACD) lines are about to flip a bullish crossover, indicating signs of fading bearish momentum.
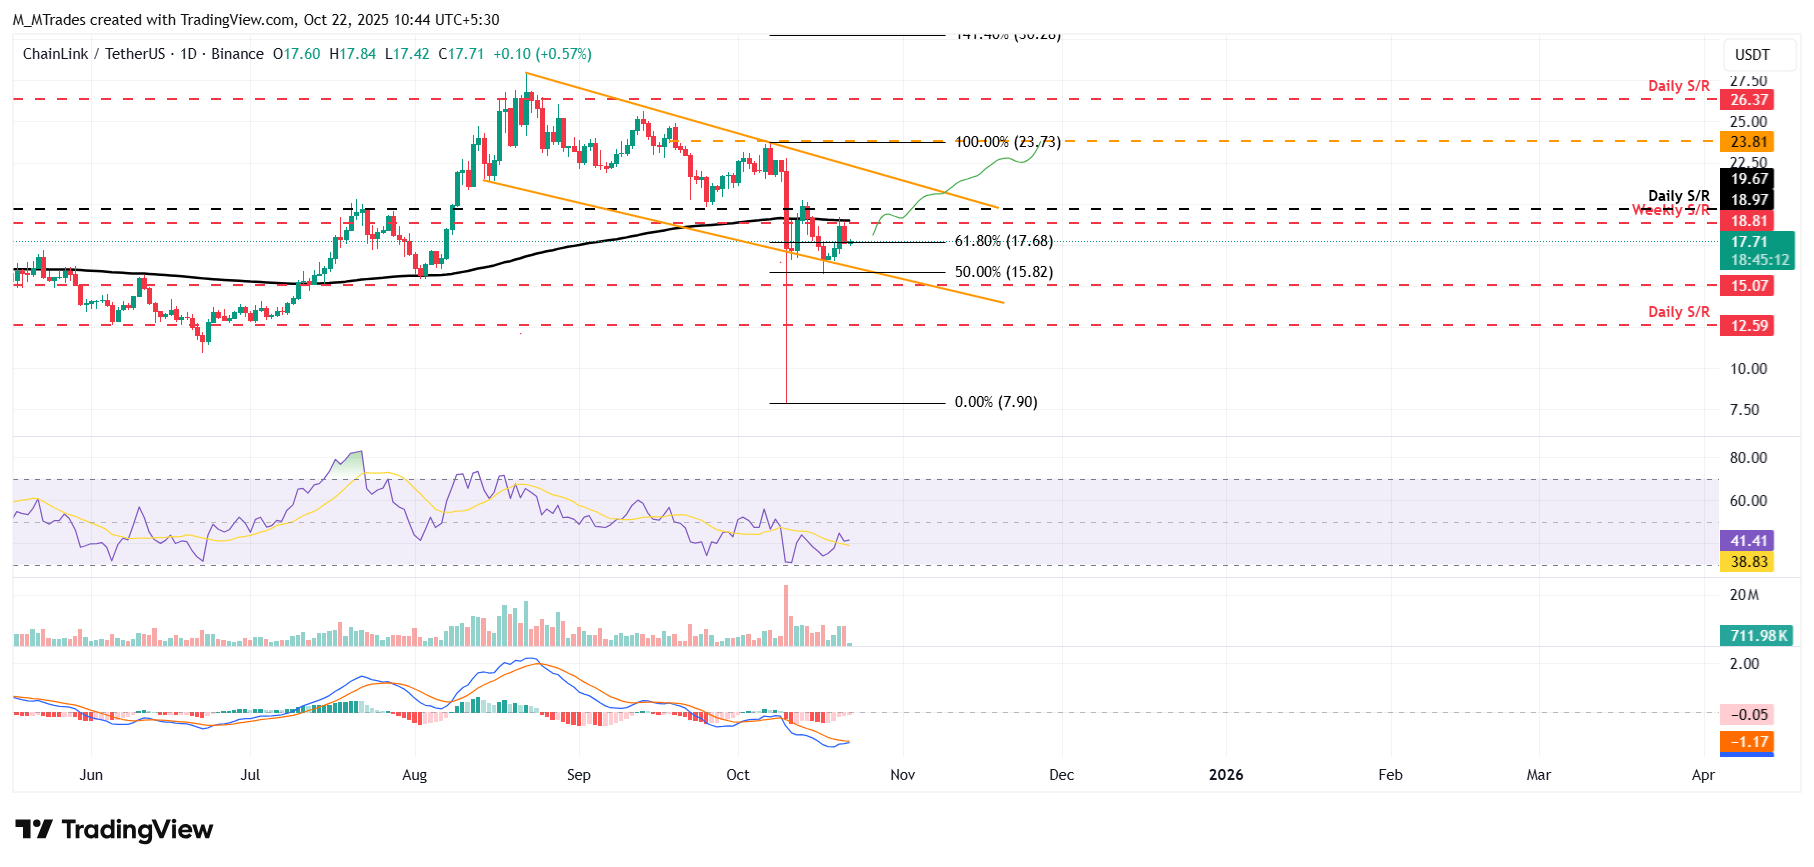
LINK/USDT daily chart
On the other hand, if LINK faces a correction, it could extend the decline toward the next support level at $15.82.

FXStreet
Higit sa isang milyong user ang umaasa sa FXStreet para sa real-time market data, charting tools, expert insights, at Forex news. Ang komprehensibong economic calendar at educational webinars nito ay tumutulong sa mga trader na manatiling may alam at gumawa ng kalkuladong mga desisyon. Sinusuportahan ang FXStreet ng humigit-kumulang 60 propesyonal sa pagitan ng Barcelona HQ at iba’t ibang rehiyon sa buong mundo.
Read More


