
Trade The World
Crypto Gainers: MemeCore leads market rebound as Four and Ethena sustain bullish momentum
Ni Vishal Dixit
Petsa ng Pag-publish: 4 Sep 2025 | Petsa ng Pag-edit: 4 Sep 2025


POPULAR ARTICLES

The cryptocurrency market is on the front foot on Thursday, with MemeCore (M) recording a double-digit rise in the last 24 hours, followed by the Four (FORM), which was previously known as BinaryX, and Ethena (ENA) recovery.
- MemeCore leads the market recovery with bulls holding above $1.
- Four extends the uptrend for the fourth consecutive day, exhibiting a V-shaped reversal.
- Ethena extends the recovery period, with bulls anticipating a breakout rally to $0.8555.
The cryptocurrency market is on the front foot on Thursday, with MemeCore (M) recording a double-digit rise in the last 24 hours, followed by the Four (FORM), which was previously known as BinaryX, and Ethena (ENA) recovery. Rising interest in the altcoins indicates a shift in money flow from top cryptos to other altcoins. The technical outlook of the altcoins suggests a bullish tilt as the uptrend picks up pace.
MemeCore holds above $1, targeting a new record high
MemeCore edges higher by 4% at press time on Thursday, extending the uptrend for the sixth day. The meme coin has shed minor gains after marking a record high of $1.14 on Wednesday.
Still, MemeCore holds dominance over the $1.00 psychological level and challenges the $1.07 resistance, marked by the R1 pivot resistance on the 4-hour chart. To extend the rally towards the R2 pivot resistance level at $1.47, the M token should mark a decisive close above the $1.07 level.
Adding to the optimism, the CoinGlass data reflected that MemeCore's Open Interest showed a 43% rise in the last 24 hours, reaching a record high of $99.4 million. The trading volume of the meme coin at above $1 billion for three consecutive days, indicating increased interest.
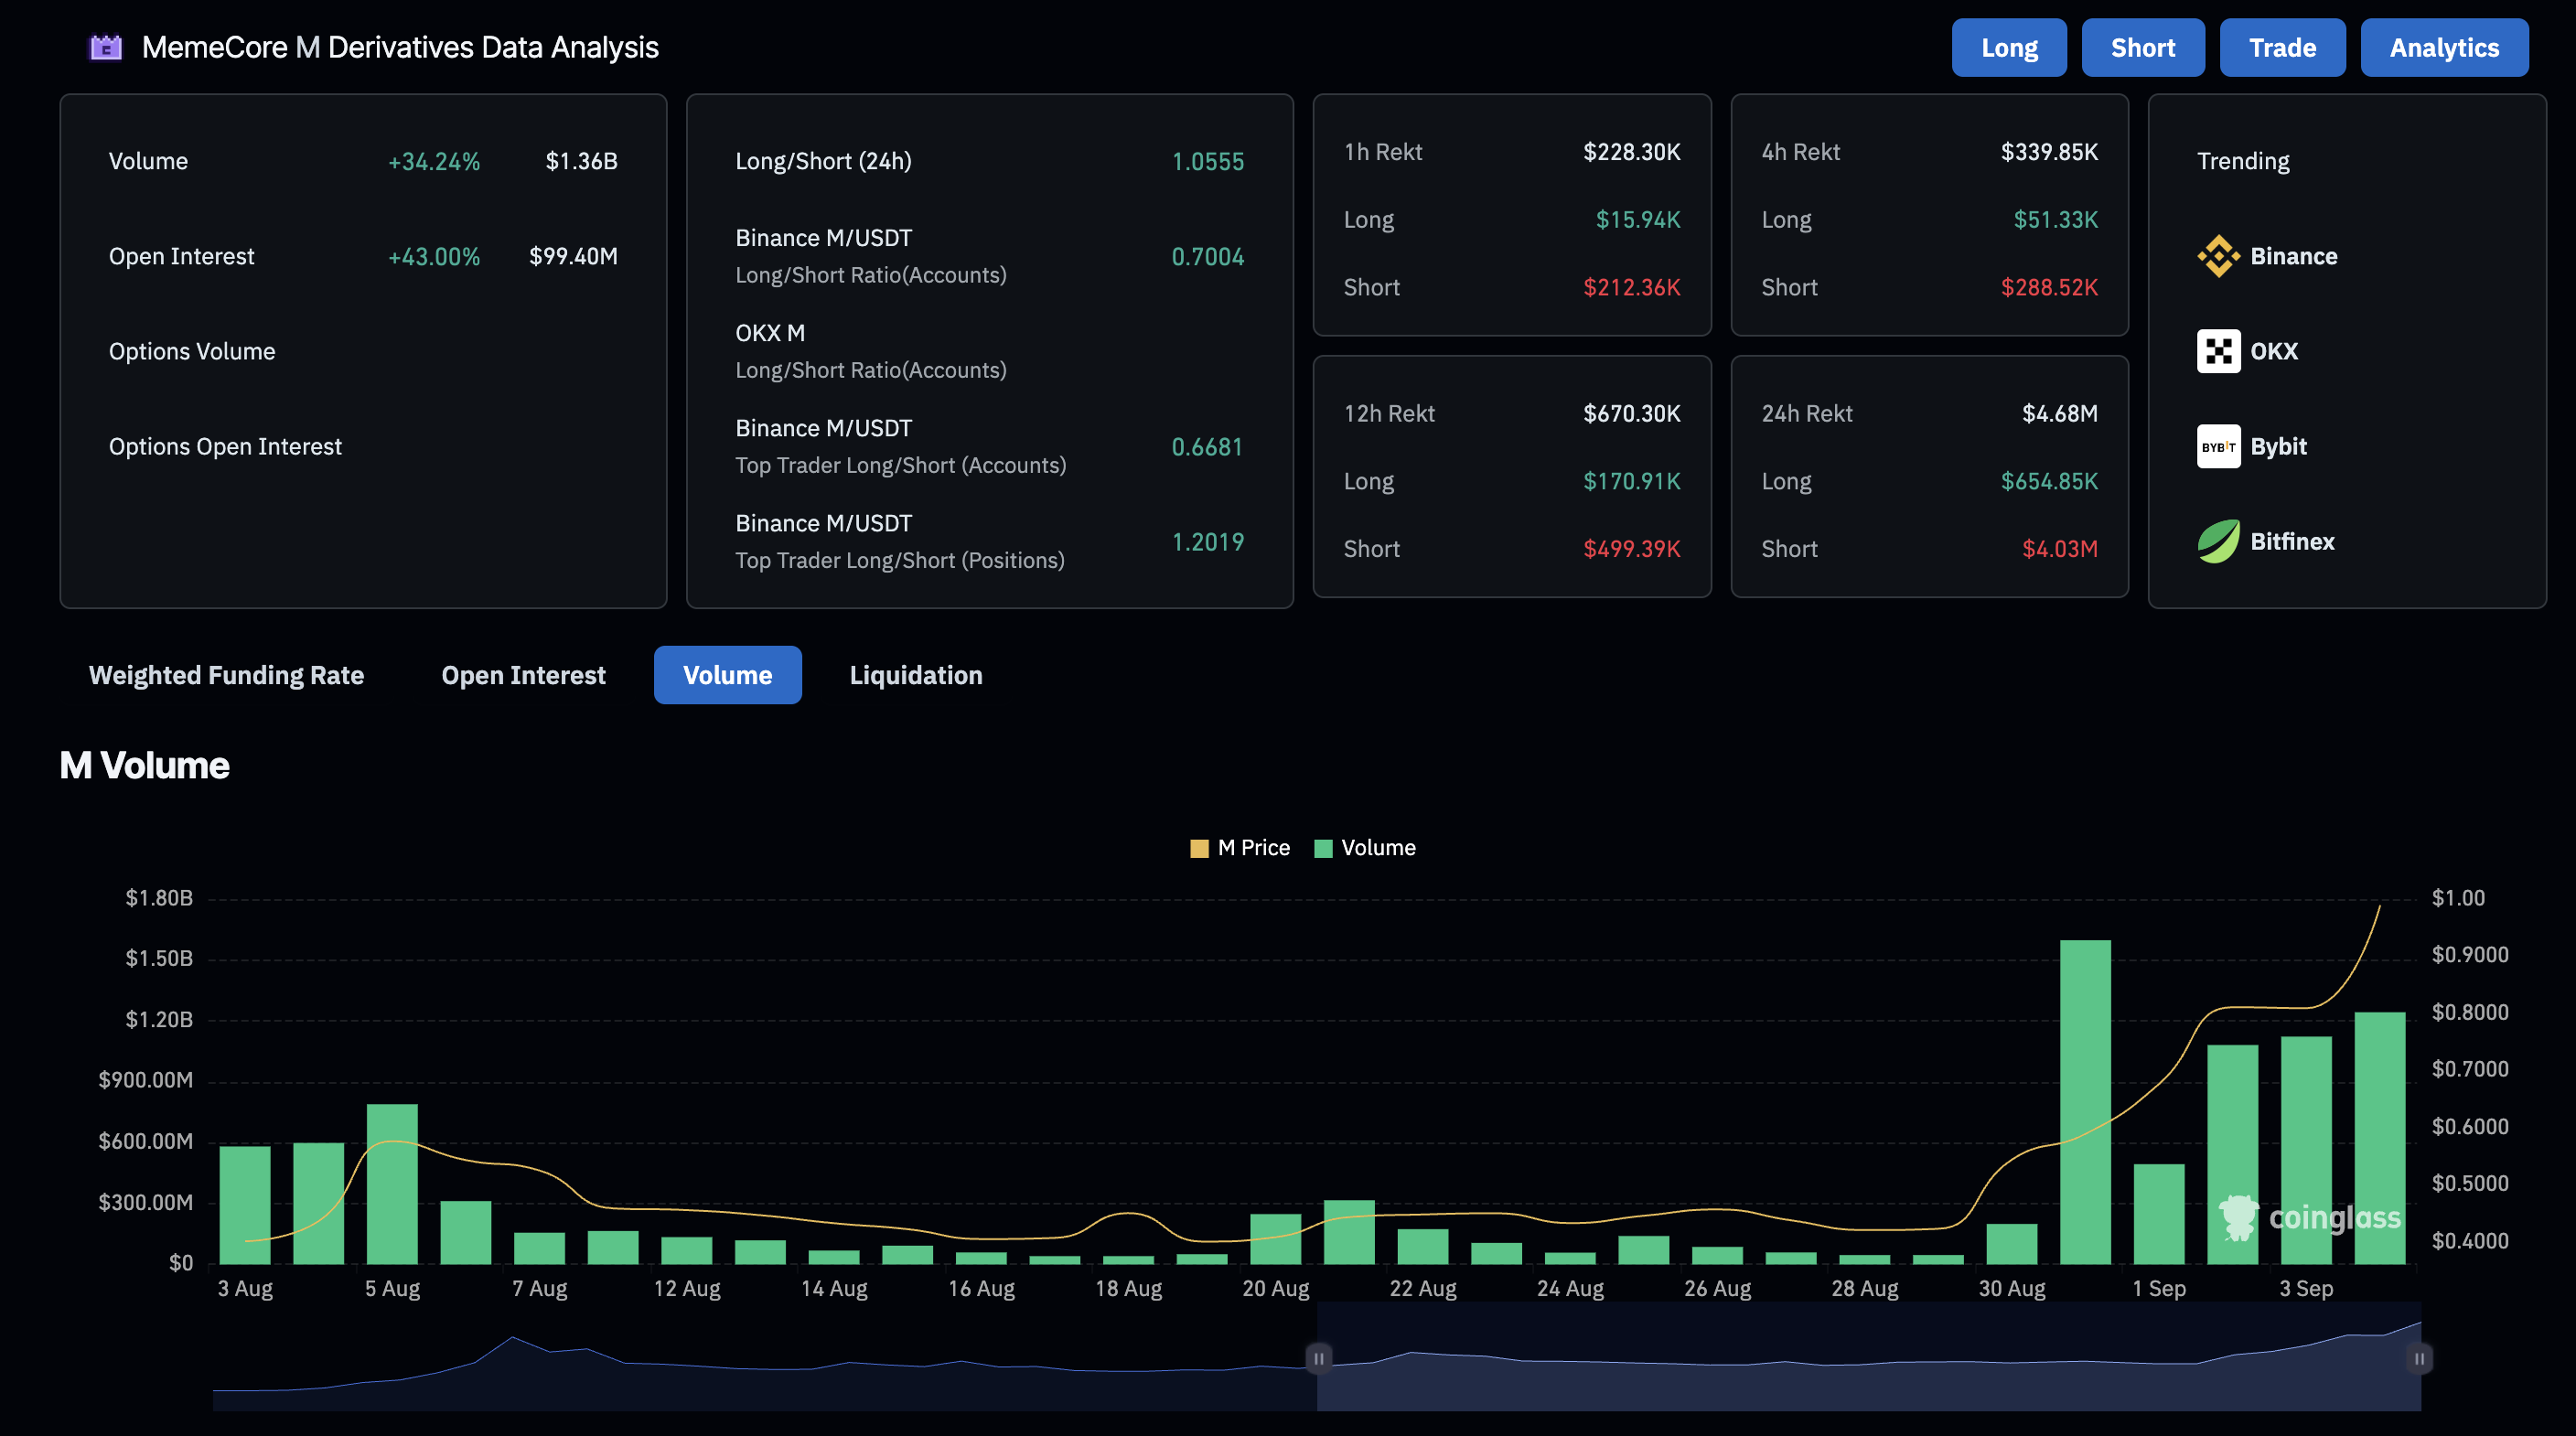
MemeCore derivatives. Source: CoinGlass
The momentum indicators on the 4-hour chart suggest elevated buying pressure as the Moving Average Convergence Divergence (MACD) and its signal line extend the uptrend. Additionally, the Relative Strength Index (RSI) at 77 hovers above the overbought boundary, pointing upwards, signaling heightened bullish momentum.
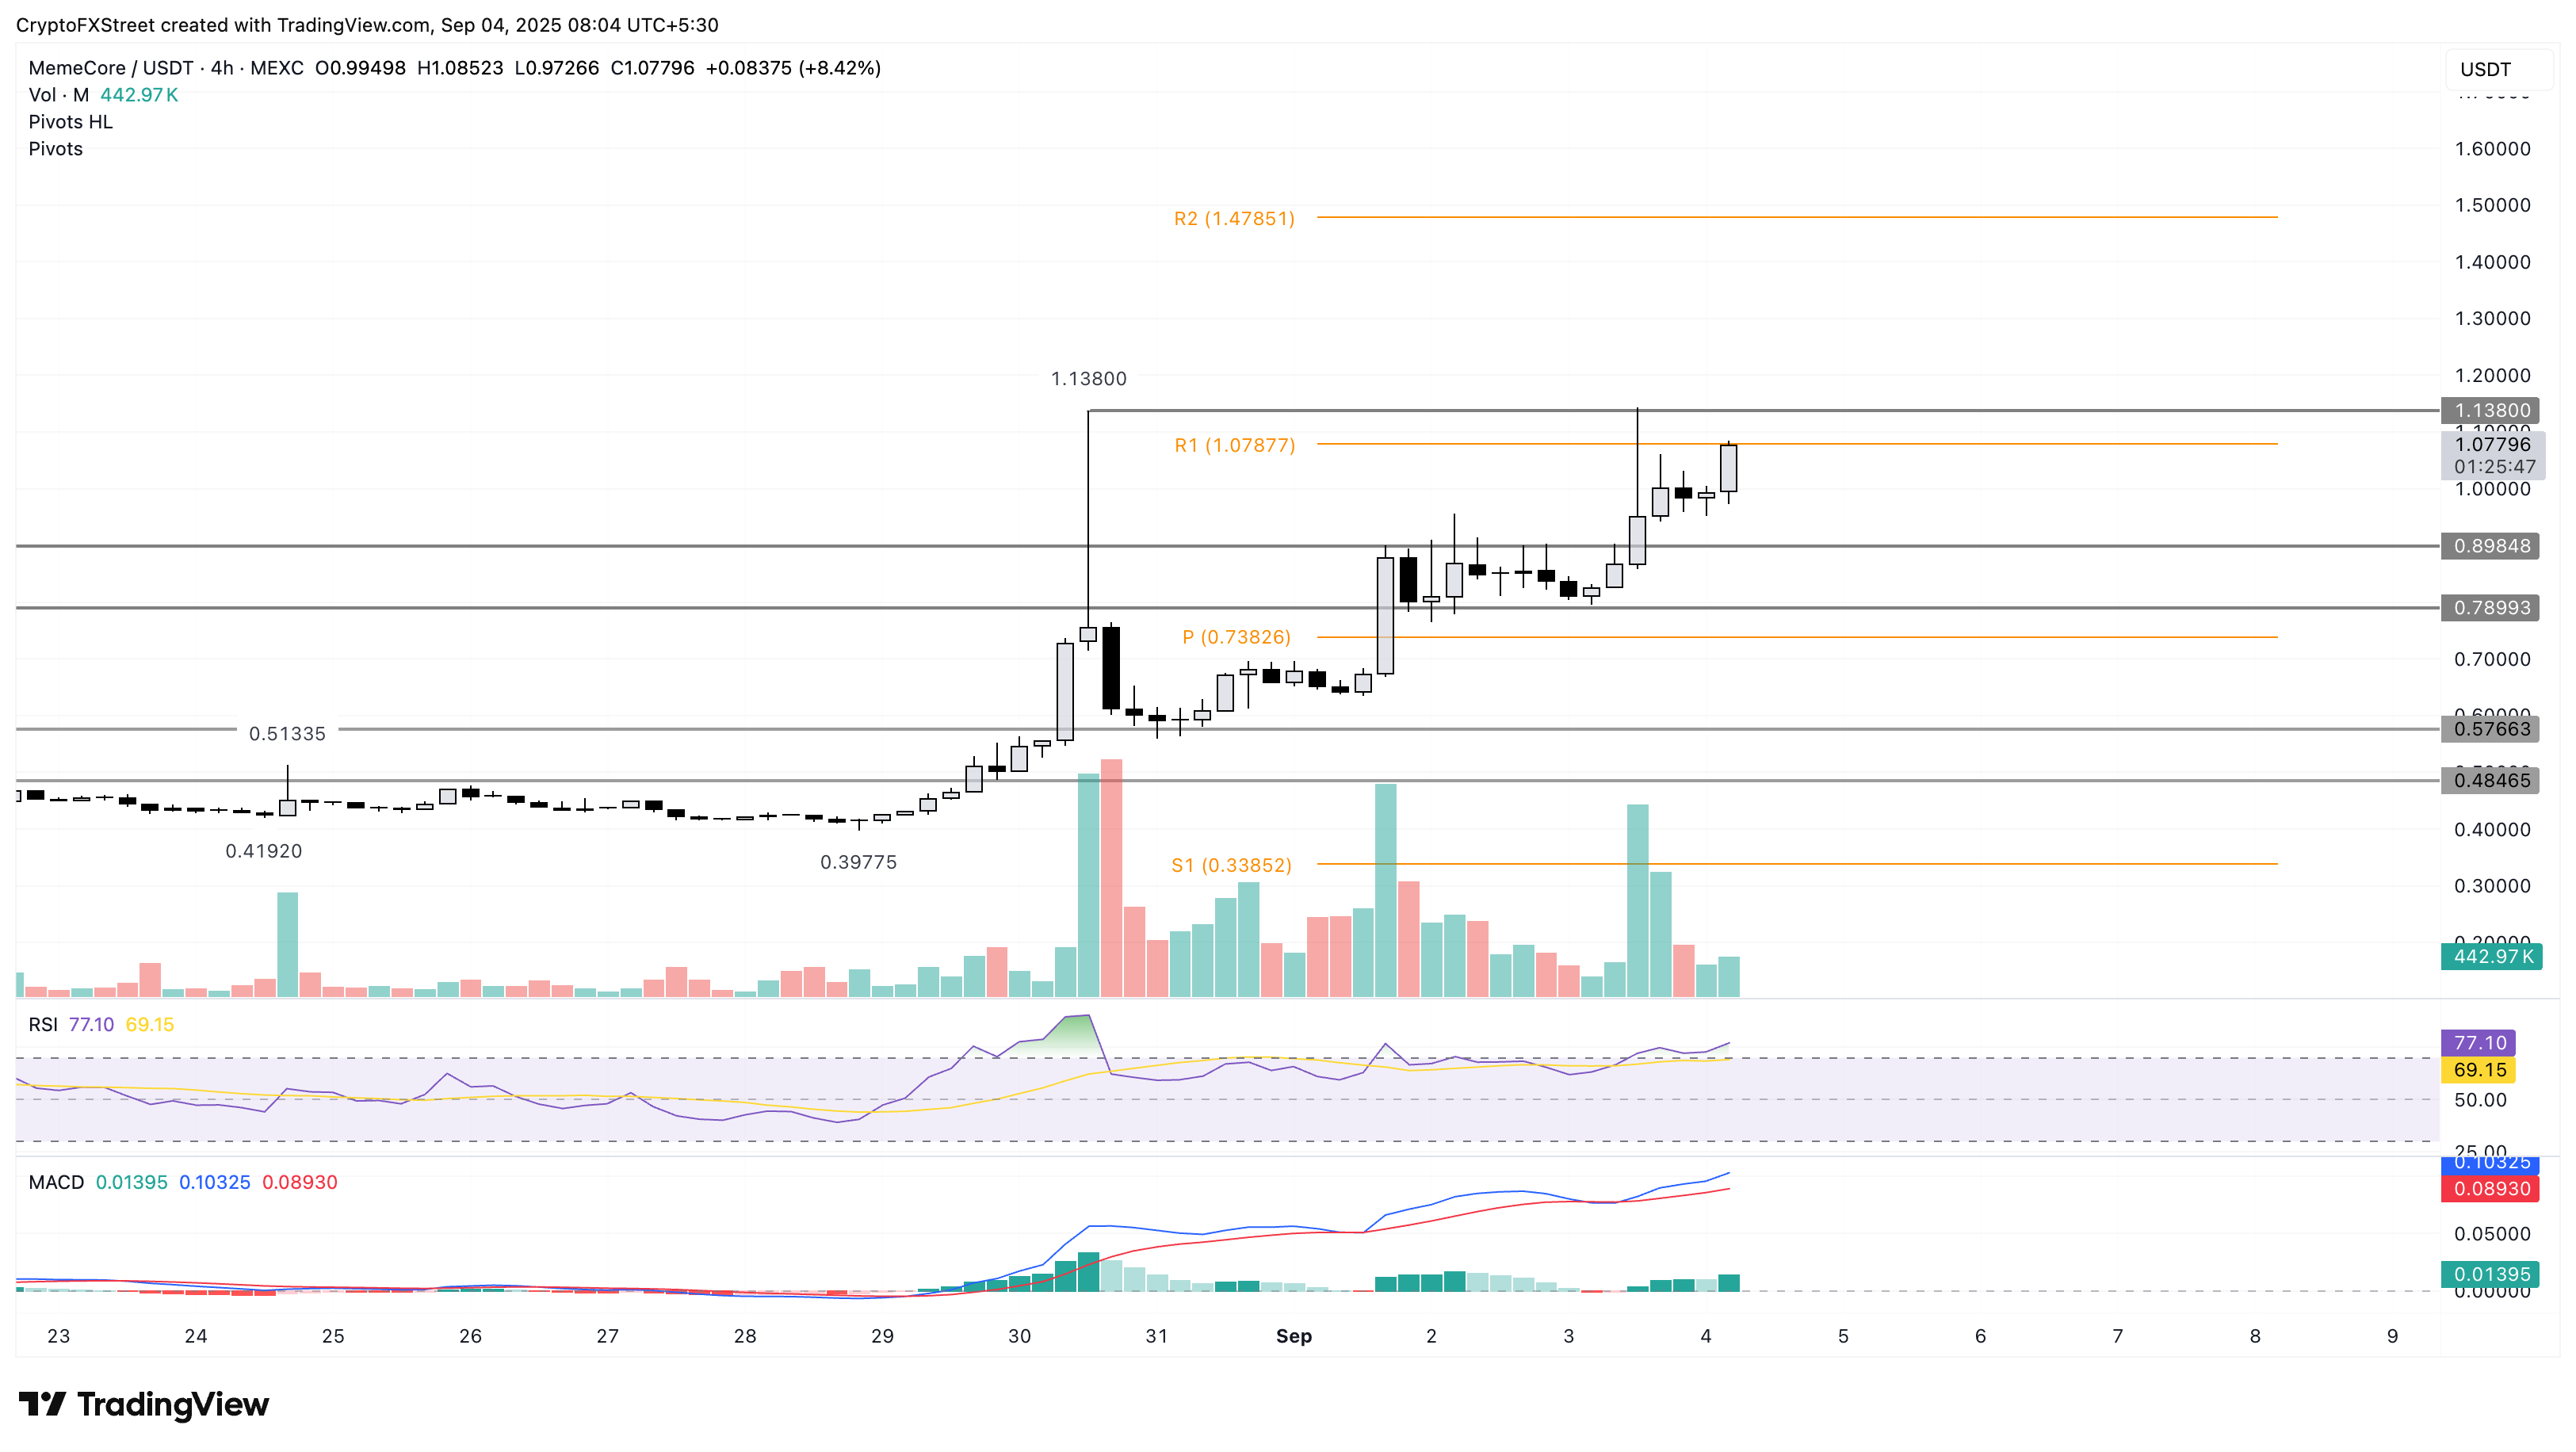
M/USDT daily price chart.
Looking down, a potential drop below the $1.00 level could test the $0.89 support level, which acted as a short-term resistance earlier this week.
Four recovery rally targets the $4 level
Four trades above the $3.50 level, extending the uptrend for the fourth consecutive day with a 2% rise, at the time of writing on Thursday. The GameFi token exhibits a V-shaped recovery run after the 18% drop on Sunday.
A clean push above $3.75 to recover from Sunday’s loss could extend the rally to $4.00 round figure.
The RSI at 53 on the daily chart has crossed above the midpoint line, indicating an increase in buying pressure. Additionally, the MACD line converges with its signal line, reflecting a bullish shift in trend momentum.
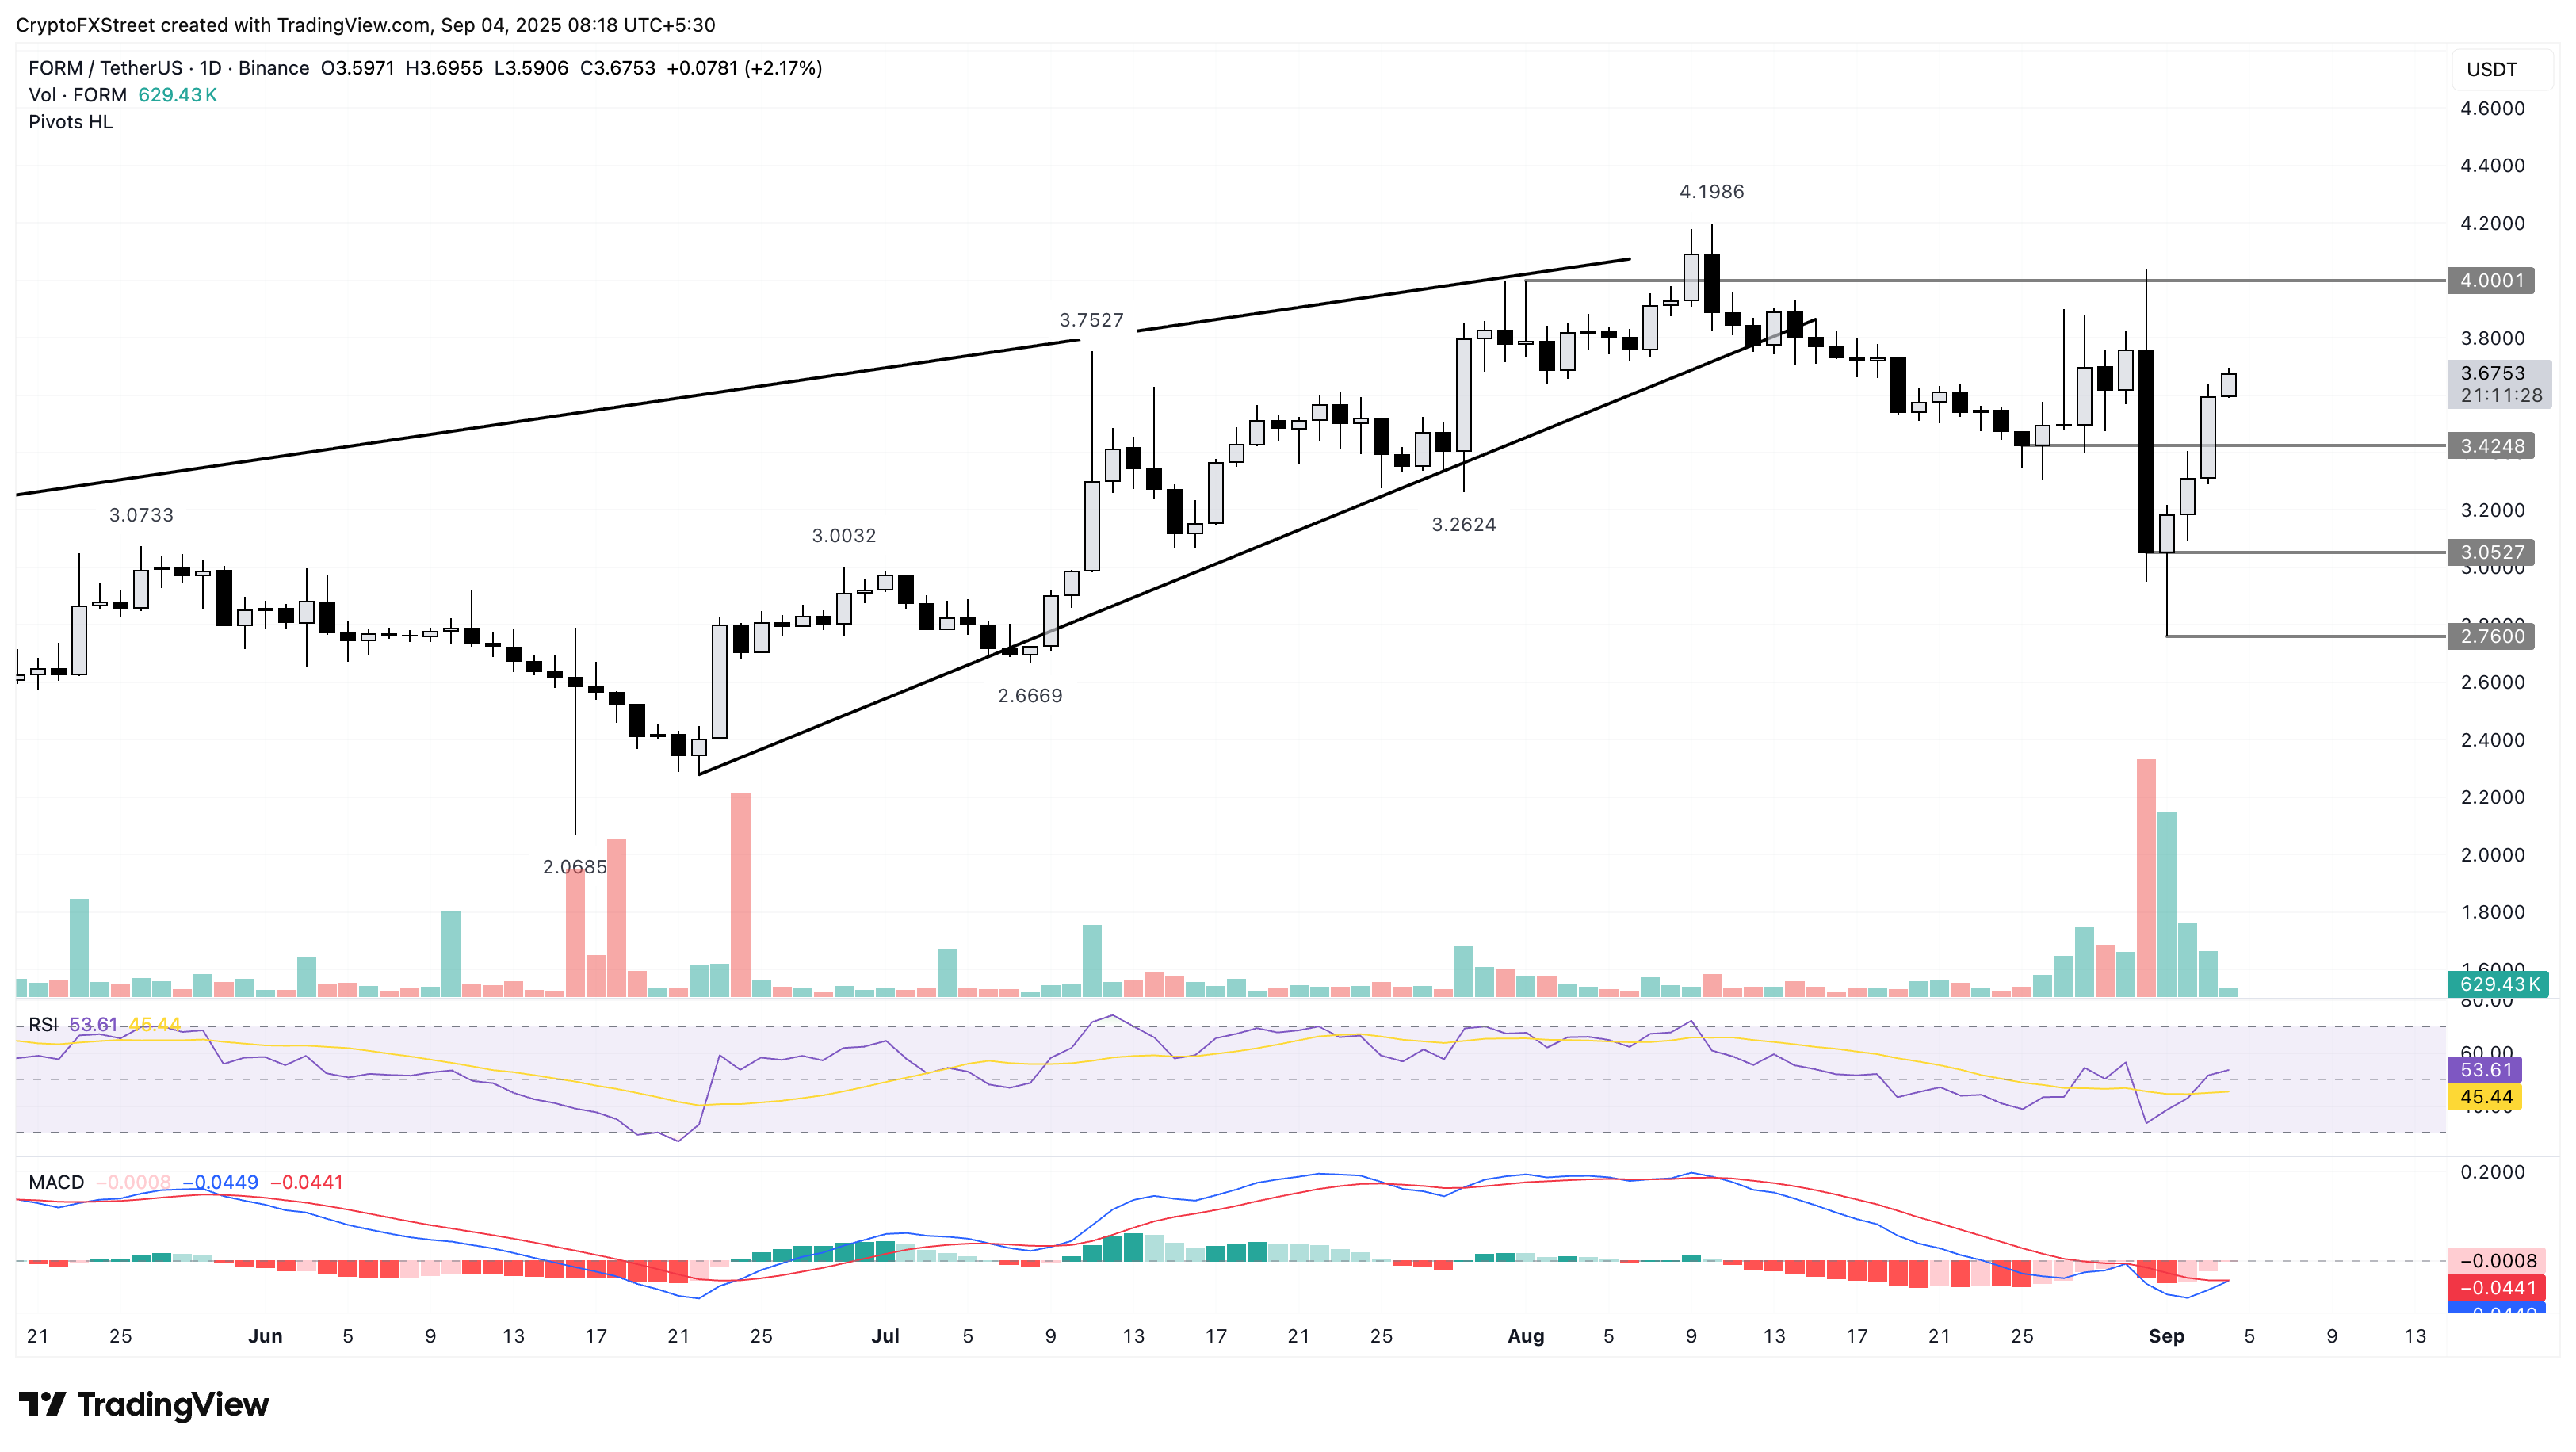
FORM/USDT daily price chart.
On the flip side, a potential flip before recovering Sunday’s loss could result in a retest of the $3.42 level, marked by the August 25 close.
Ethena struggles to uphold the bullish trend
Ethena edges lower by 2% at press time on Thursday, after the 6% rise from the previous day. The synthetic dollar token dampens the two-day recovery as bulls struggle to hold ground above the $0.7000 level.
If the bearish reversal extends, it could target the $0.6911 level, which previously acted as a resistance on Wednesday on the 4-hour chart.
Adding mixed signals, CoinGlass data indicates that the ENA Open Interest gained over 8% in the last 24 hours, reaching $1.43 billion. However, the volumes are on a declining trend with lower spikes since last month. This indicates a slow buildup among traders, as optimism remains lukewarm.
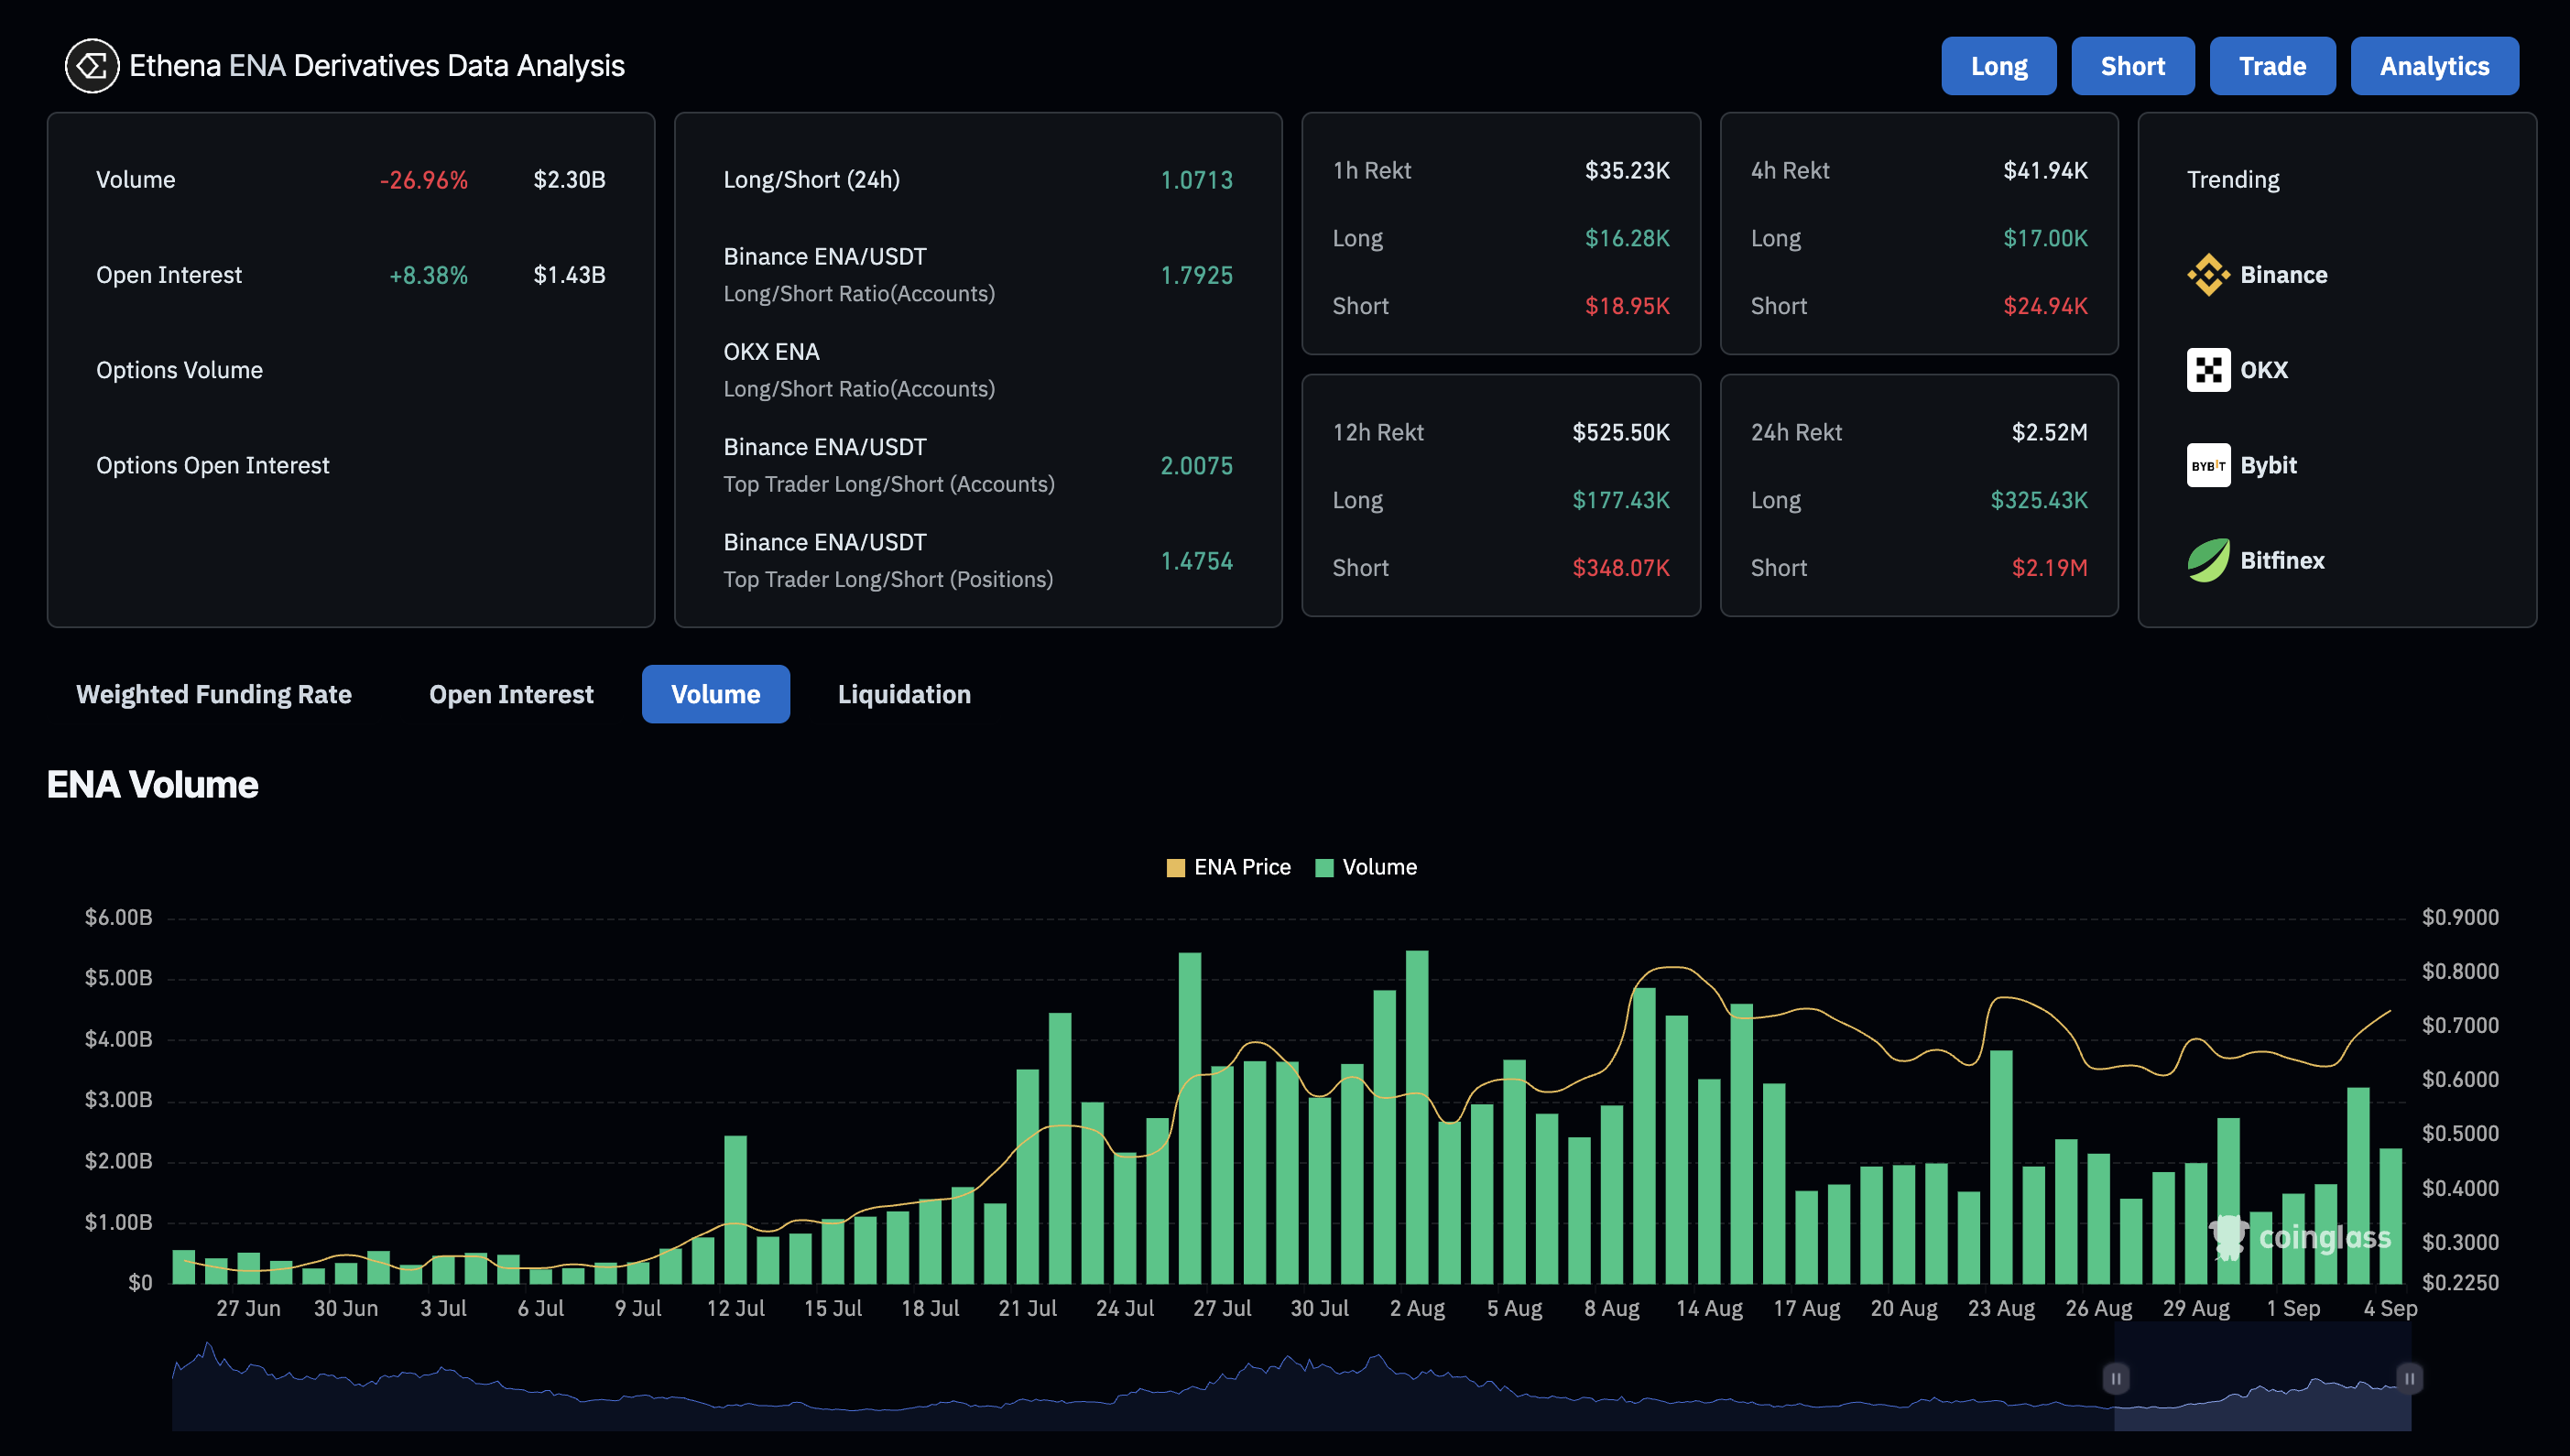
Ethena derivatives. Source: CoinGlass
The RSI on the same chart at 56 holds at neutral levels, pointing downwards, indicating an underlying weakness in buying pressure. If the RSI drops below the halfway line, the correction spree in Ethena could extend.
Still, the convergence in the MACD and signal lines indicates a significant decline in bearish momentum. A potential green histogram bar resurfacing above the zero line would mark a bullish turnaround, which would flash a buy signal for a sidelined investor.
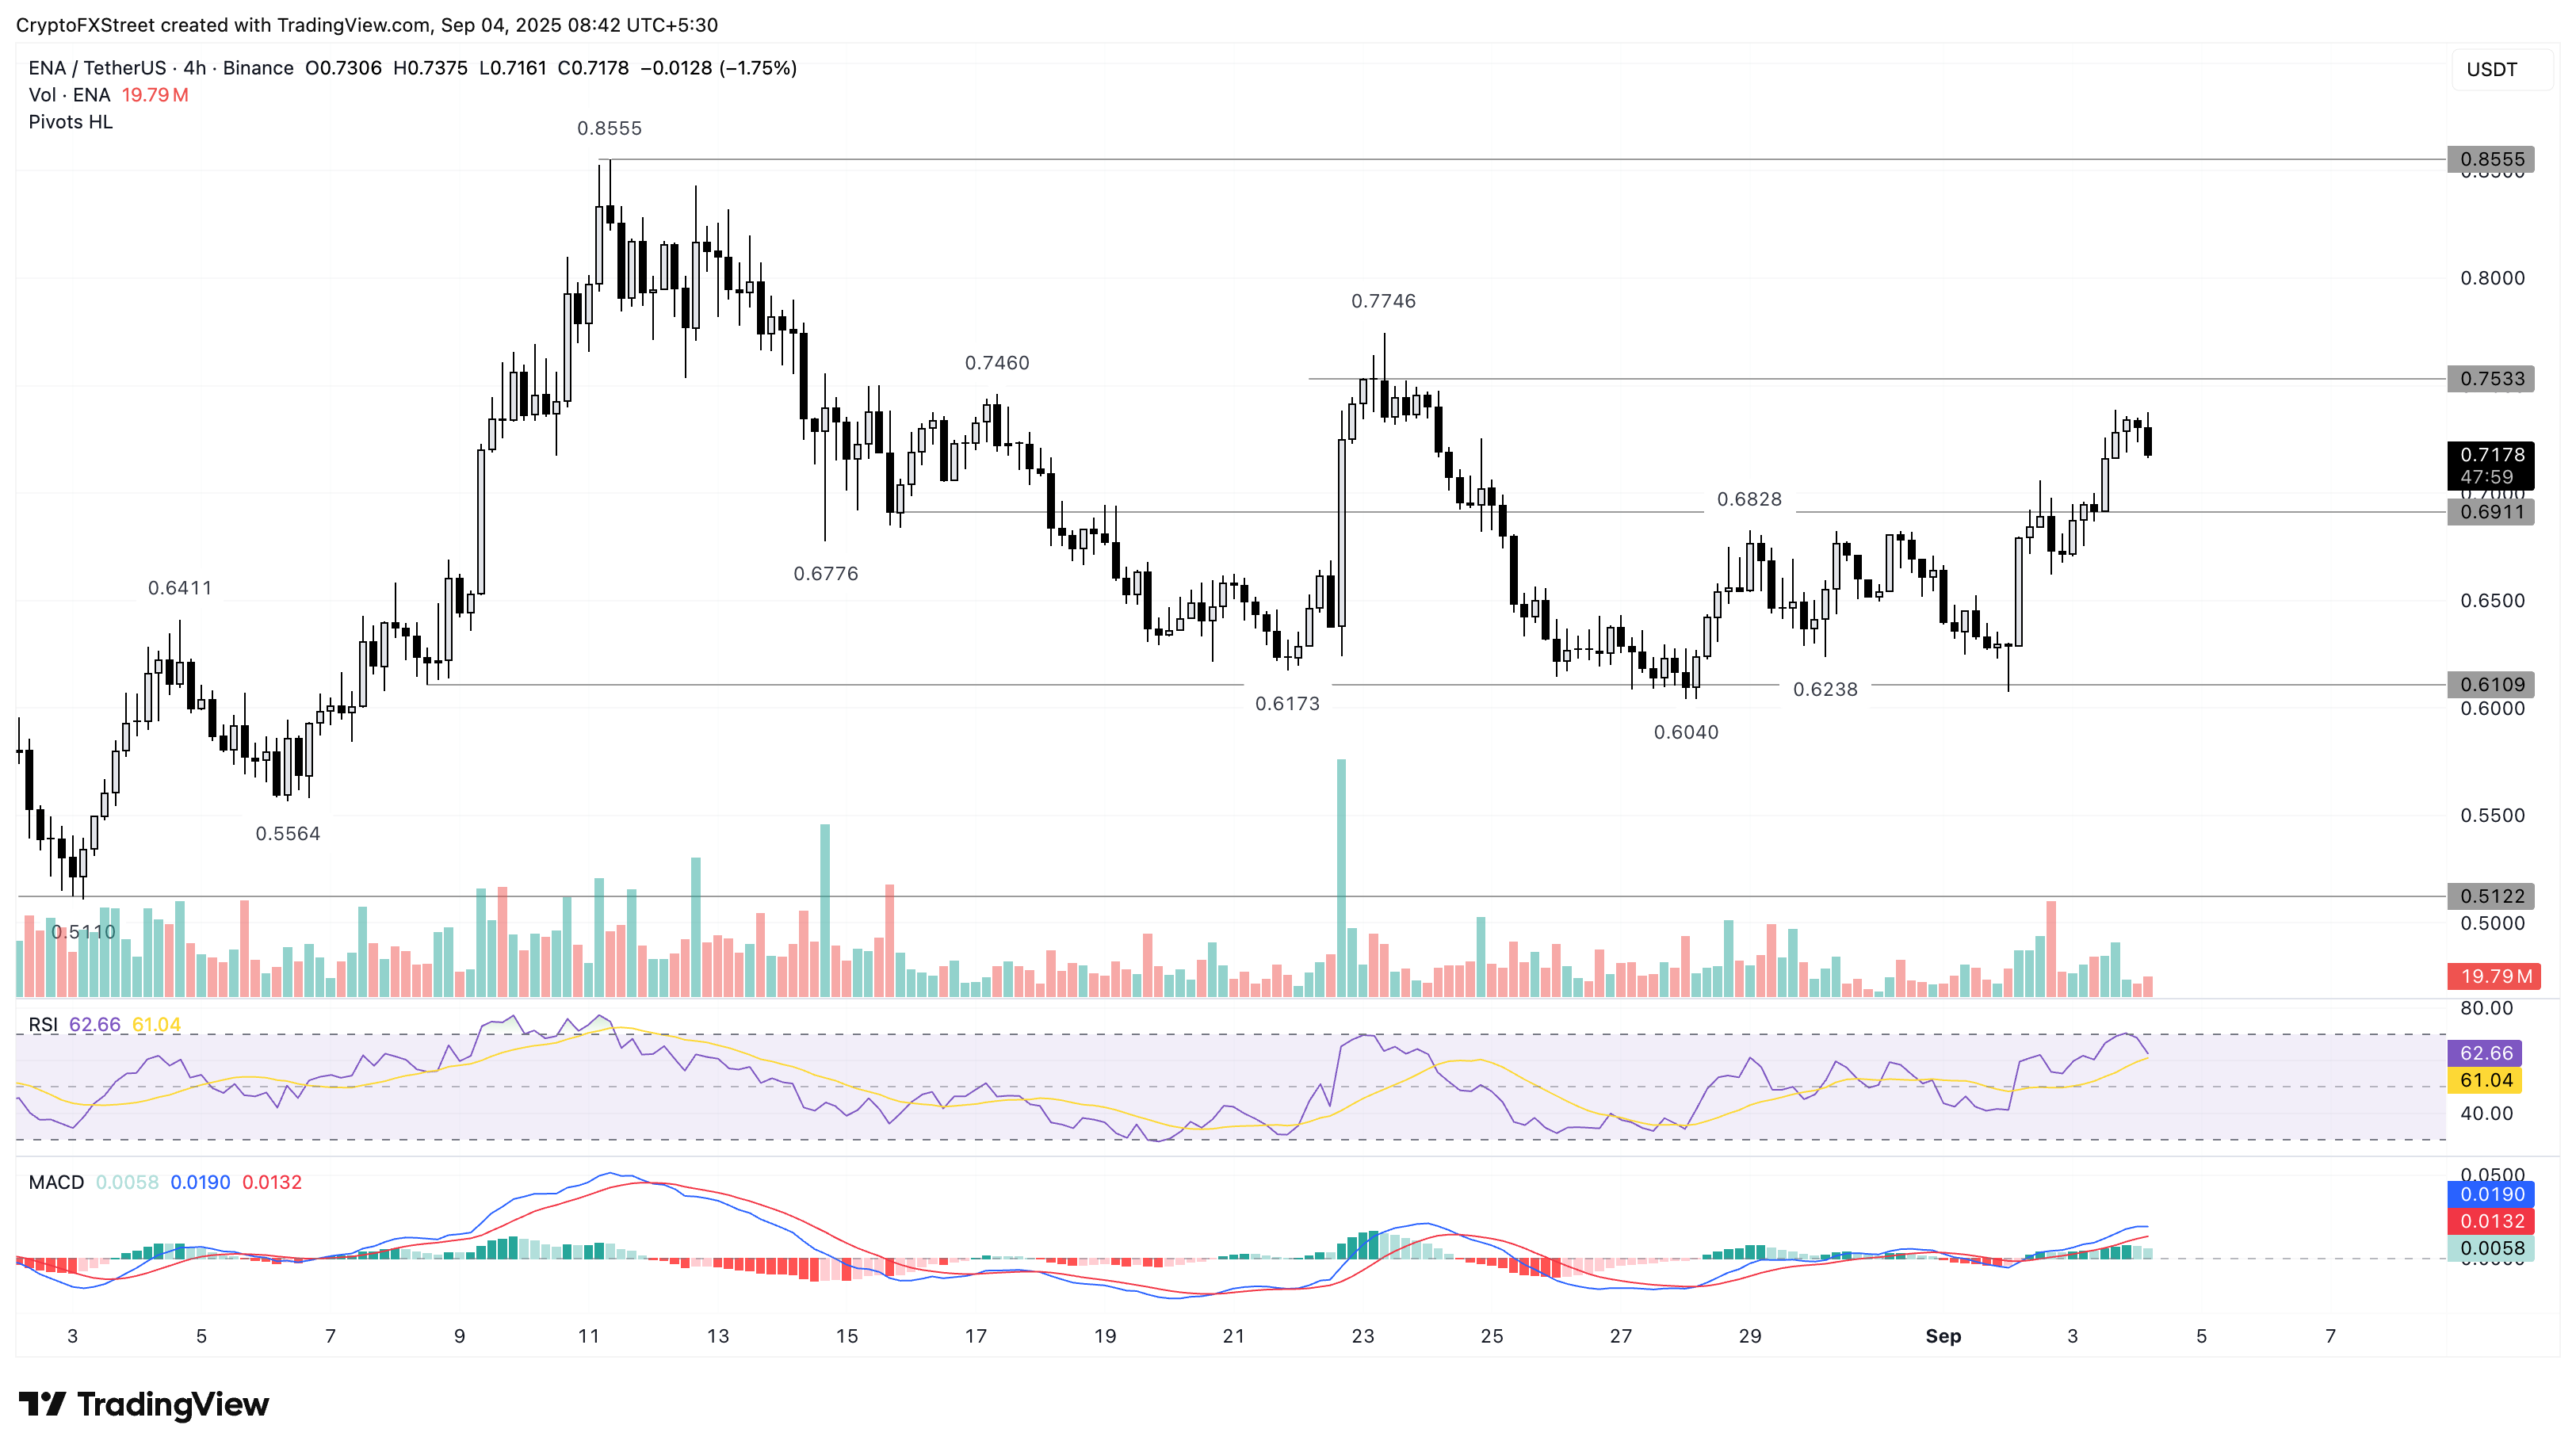
ENA/USDT daily price chart.
Looking up, a potential upswing in ENA could target the $0.8555 level if buyers could reclaim the $0.7533 resistance, last tested on August 23.

FXStreet
Higit sa isang milyong user ang umaasa sa FXStreet para sa real-time market data, charting tools, expert insights, at Forex news. Ang komprehensibong economic calendar at educational webinars nito ay tumutulong sa mga trader na manatiling may alam at gumawa ng kalkuladong mga desisyon. Sinusuportahan ang FXStreet ng humigit-kumulang 60 propesyonal sa pagitan ng Barcelona HQ at iba’t ibang rehiyon sa buong mundo.
Read More


