
Trade The World
Dogecoin Price Forecast: DOGE rebounds as Bitwise ETF could launch in 20 days
Ni Vishal Dixit
Petsa ng Pag-publish: 7 Nov 2025 | Petsa ng Pag-edit: 7 Nov 2025


POPULAR ARTICLES

Dogecoin (DOGE) trades above $0.1600 at the time of writing on Friday, stabilizing after a rough start to the week. Eric Balchunas, a Bloomberg ETF analyst, shared that the Bitwise Dogecoin spot Exchange Traded Fund (ETF) could launch 20 days after the 8(a) form filed on Thursday.
- Dogecoin stabilizes at a key support level, preparing for a potential double-bottom reversal.
- Bitwise Dogecoin spot ETF could launch after 20 days if the US SEC does not intervene.
- Large wallet investors expand their DOGE holdings as MVRV data signals a potential bottom formation.
Dogecoin (DOGE) trades above $0.1600 at the time of writing on Friday, stabilizing after a rough start to the week. Eric Balchunas, a Bloomberg ETF analyst, shared that the Bitwise Dogecoin spot Exchange Traded Fund (ETF) could launch 20 days after the 8(a) form filed on Thursday.
Amidst the ETF anticipation, on-chain data signals a potential bottom and increased exposure from large wallet investors.
Dogecoin ETF could come into effect this month
Eric Balchunas shared that Bitwise updated its Dogecoin spot ETF application by filing the 8(a) provision of the Securities Act of 1933 on Thursday, which is an automatic effectiveness application. This application would legitimize and bring the ETF into effect if there is no intervention from the US Securities and Exchange Commission (SEC).
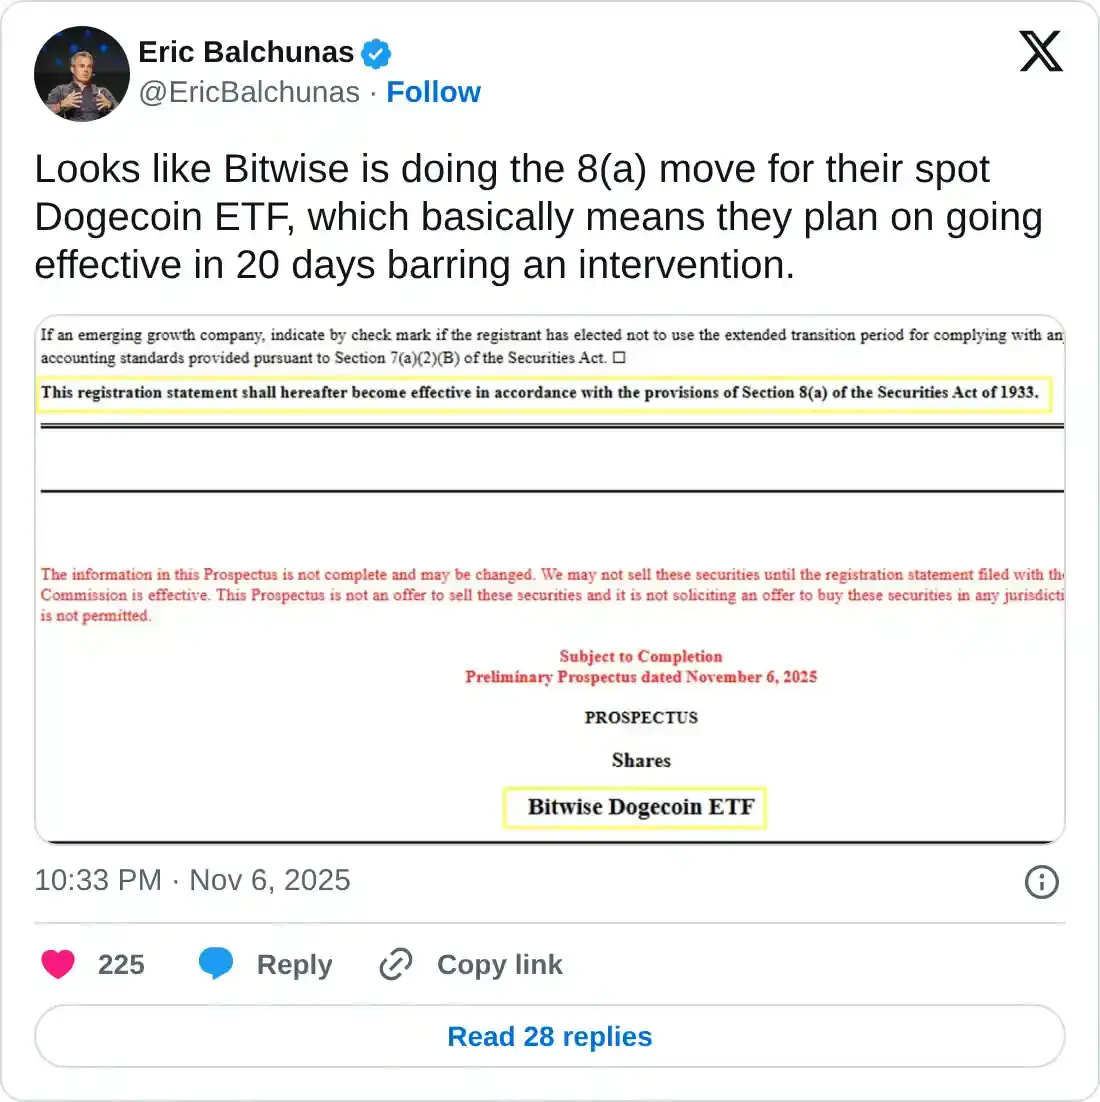
If the ongoing US government shutdown lasts for the next 20 days, the DOGE ETF could come into effect, and potential institutional inflows into the largest meme coin could boost retail demand. Based on the history of sharp moves driven by market speculations and hype, an ETF launch could uplift DOGE prices.
On-chain data signals reversal possibility, support from large investors
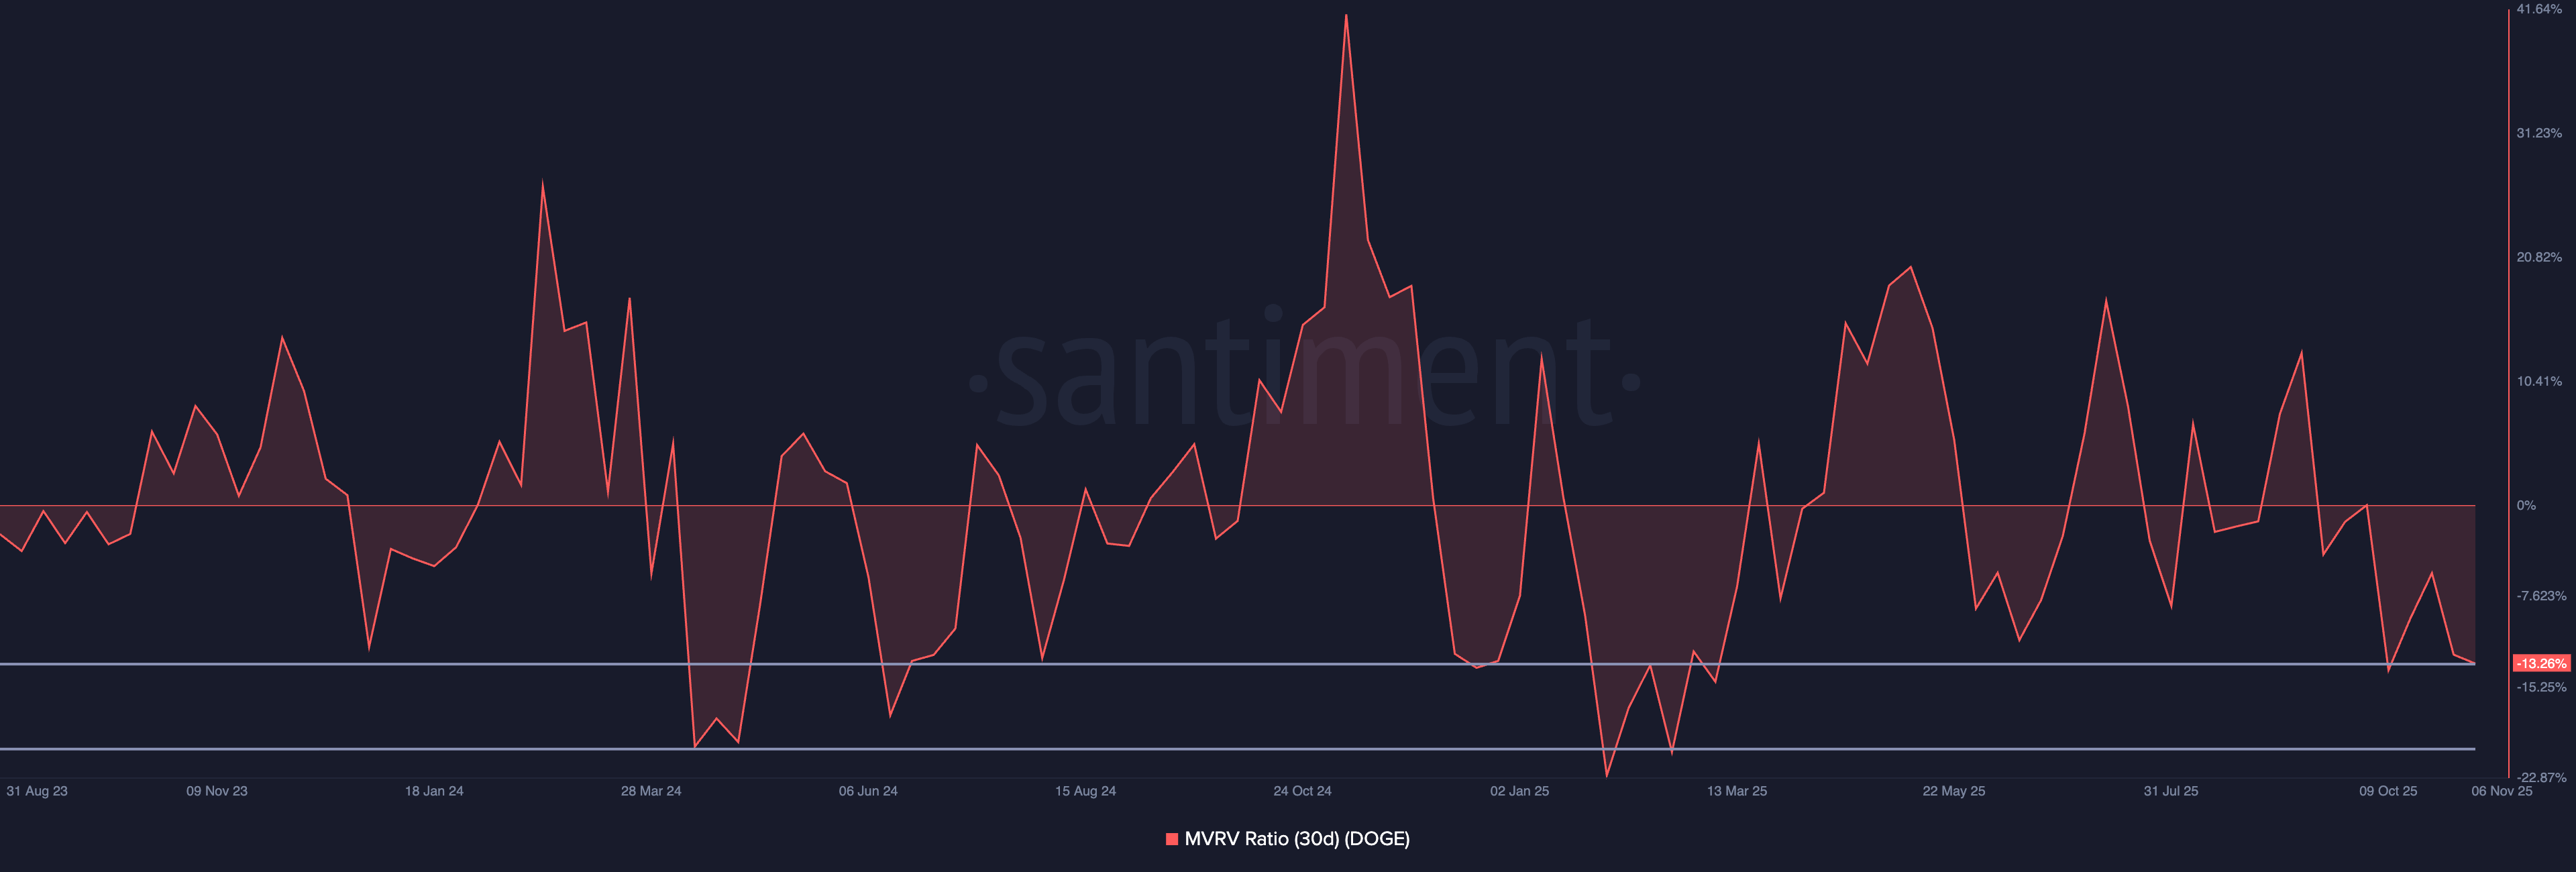
Market Value to Realized Value (MVRV) refers to the ratio of the current price and the price of every token acquired, which helps calculate the unrealized profit/loss. This also helps identify an asset as overbought or oversold, alongside cycle tops and bottoms.
In Dogecoin’s case, the 30-day MVRV data on the 7-day interval stands at -13.26%, indicating that the coins bought in the last 30 days are at an unrealized loss. Still, compared to the previous downcycle bottoms, including those in early October and late December 2024, DOGE is sufficiently oversold to bounce back potentially.
However, a further decline in the MVRV ratio could test the -20% values for earlier this year.
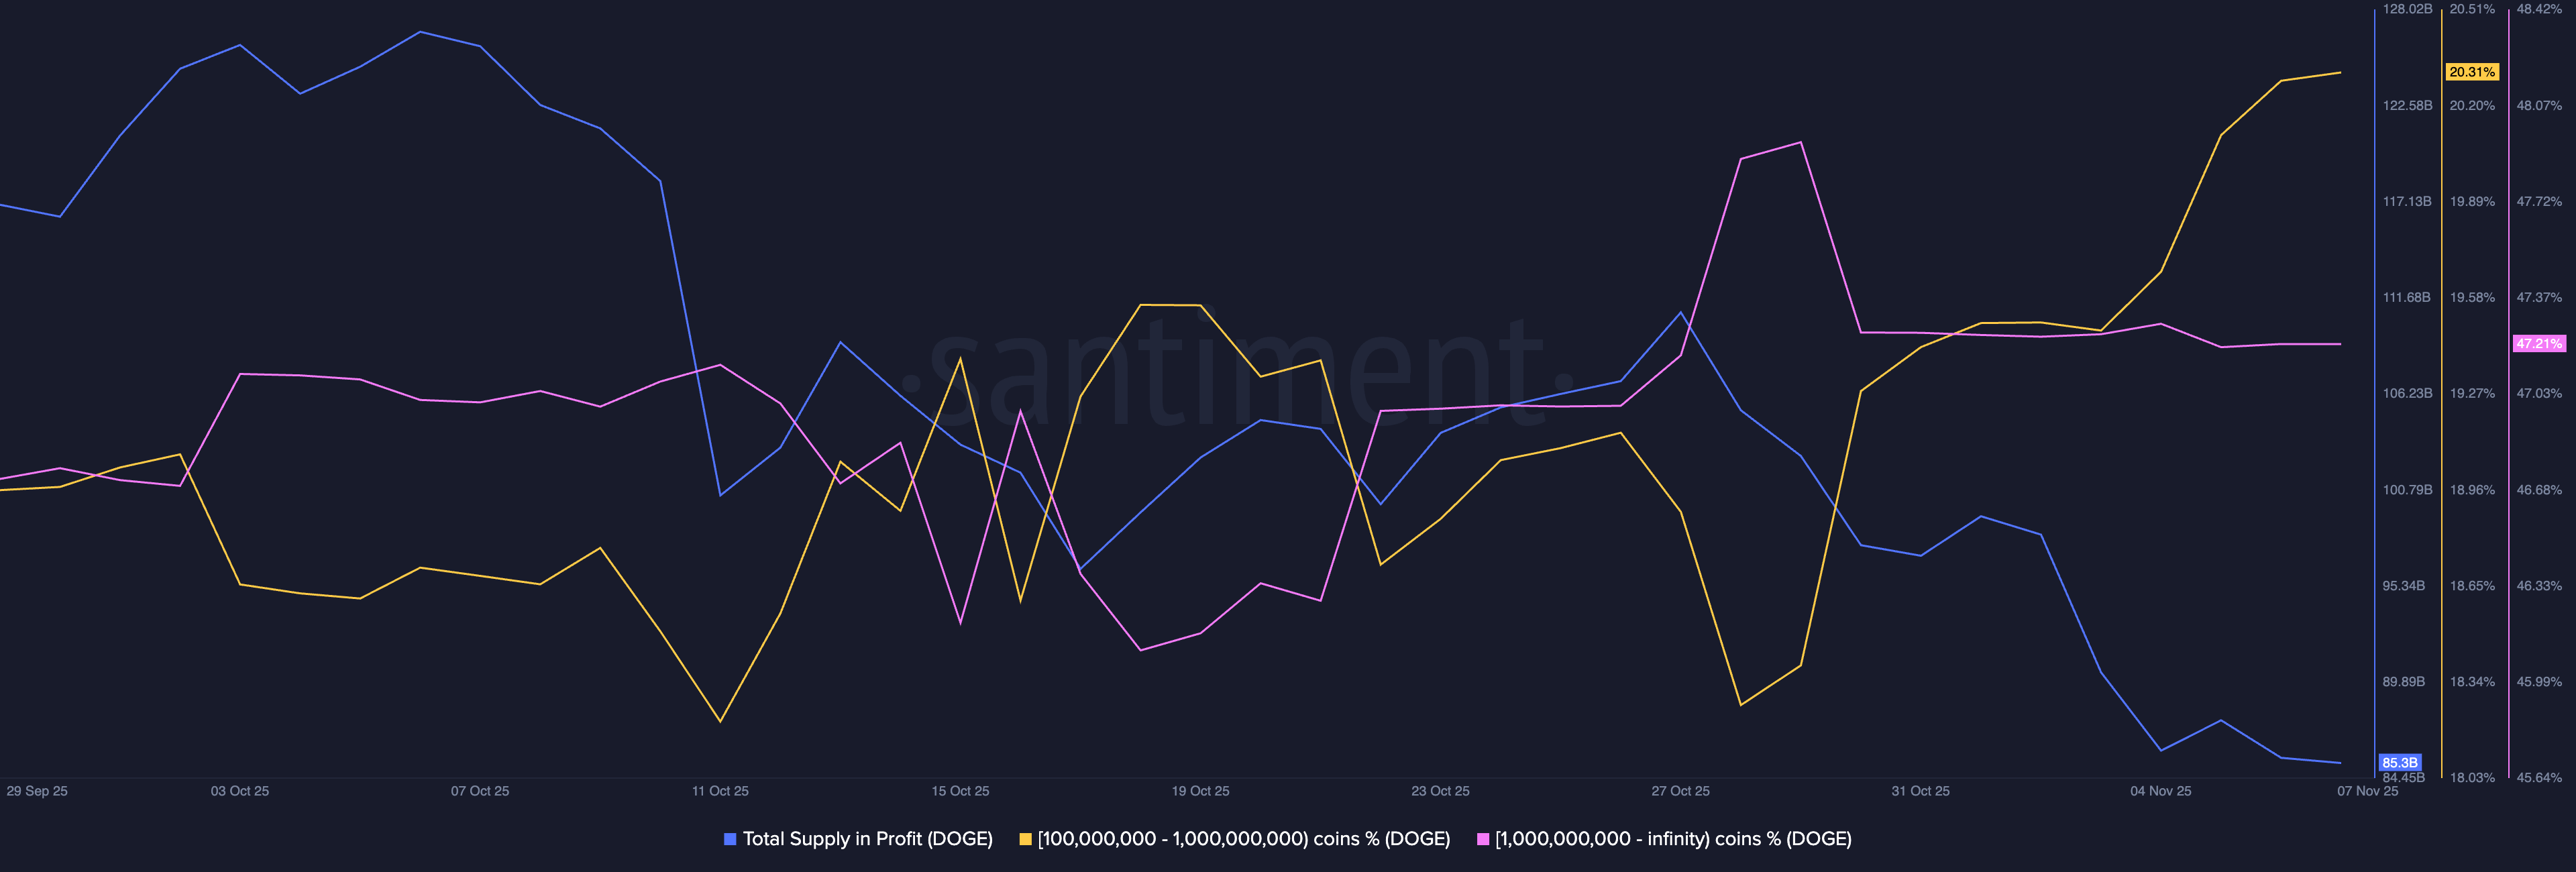
Amid the possibility of a potential bottom and the anticipation of the ETF, large wallet investors with holdings of 100 million to 1 billion DOGE have increased their stake to 20.31% of the total on-chain supply, from 19.5% on November 1. Meanwhile, cohorts with over 1 billion DOGE remain muted, holding a stake of over 47% of the on-chain supply.
Technical outlook: Will Dogecoin exhibit a breakout rally?
Dogecoin takes a sideways shift near the $0.15704 support, marked by the June 27 low, after Tuesday’s 3% decline. The meme coin is forming a double-bottom pattern with a neckline at Wednesday’s high of $0.16886 on the 4-hour price chart.
A decisive close above the neckline would confirm the pattern breakout and a bullish reversal, potentially targeting the support-turned-resistance at $0.17816. On further upside, the 200-period EMA at $0.19755 could serve as a key resistance level for DOGE.
Corroborating the breakout chances, the Relative Strength Index (RSI) at 44 rises towards the halfway line, indicating softer selling pressure. Furthermore, the uptrend in RSI compared to the sideways trend in DOGE prices signals a bullish divergence, suggesting a strong bounce-back possibility.
At the same time, the Moving Average Convergence Divergence (MACD) holds a steady rise with the signal line, indicating a consistent increase in buying pressure.
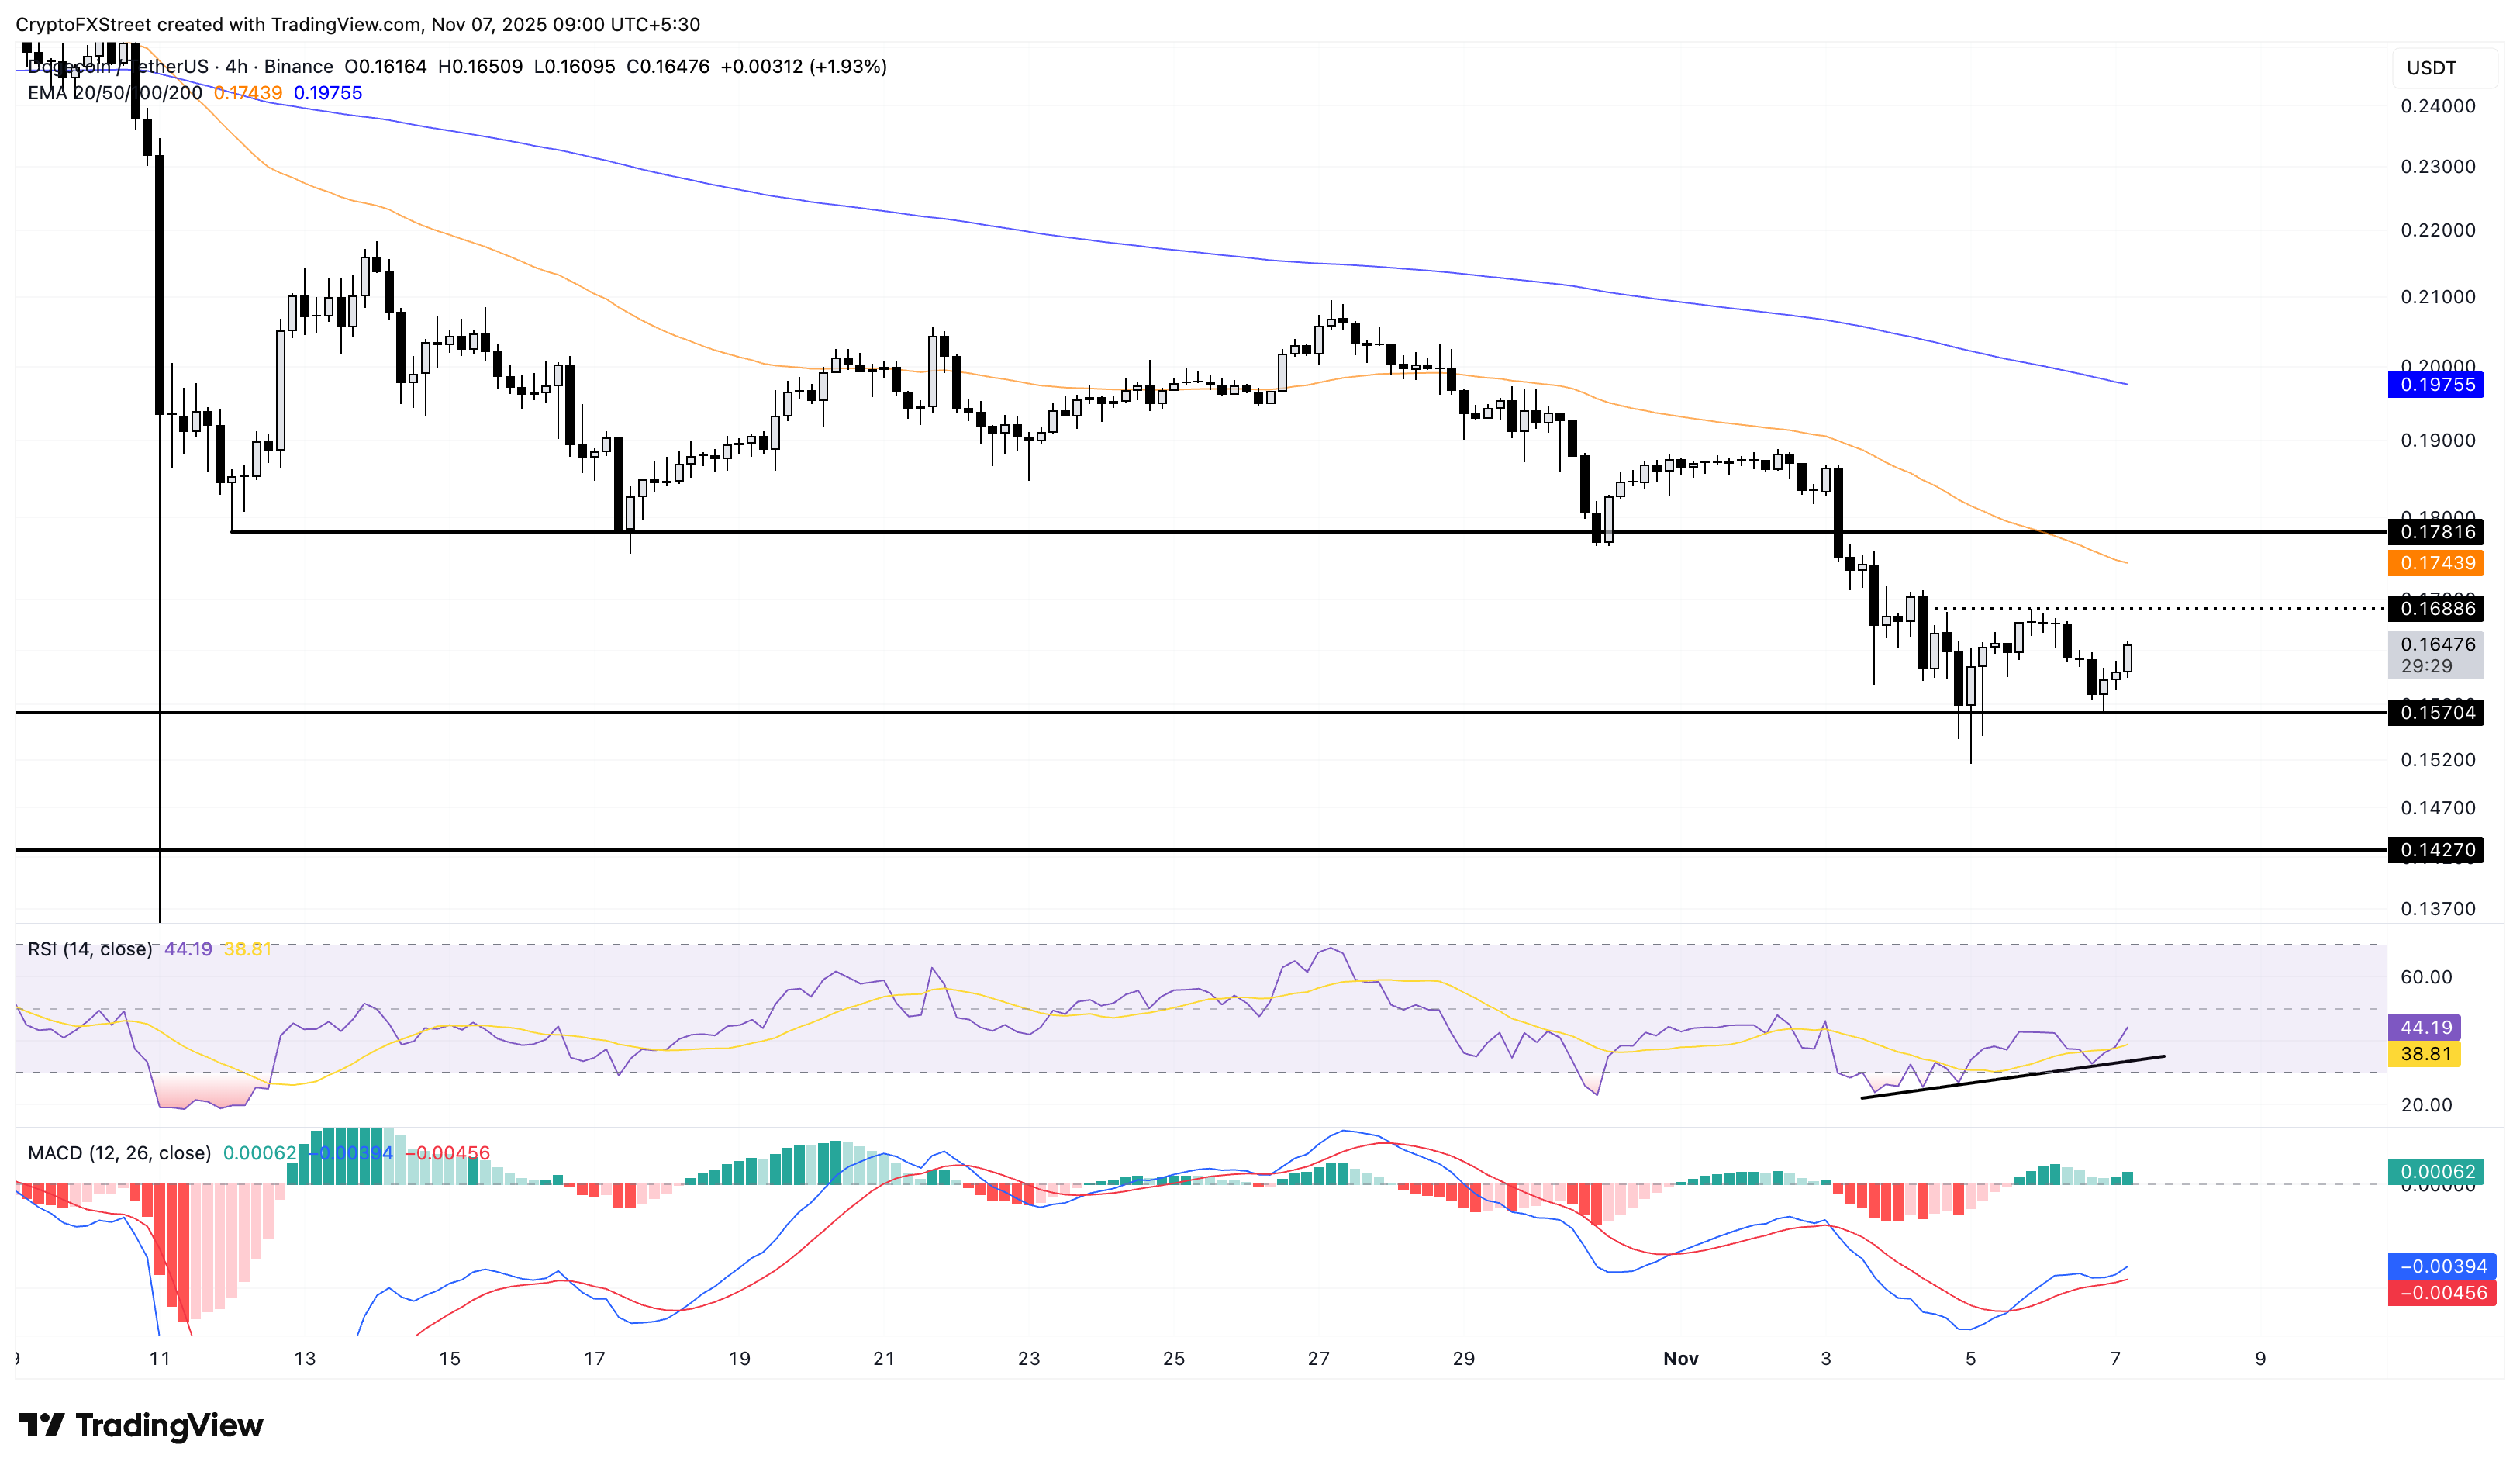
If DOGE slips below $0.15704, it would invalidate the reversal pattern and potentially extend the decline to the June 22 low at $0.14270.

FXStreet
Higit sa isang milyong user ang umaasa sa FXStreet para sa real-time market data, charting tools, expert insights, at Forex news. Ang komprehensibong economic calendar at educational webinars nito ay tumutulong sa mga trader na manatiling may alam at gumawa ng kalkuladong mga desisyon. Sinusuportahan ang FXStreet ng humigit-kumulang 60 propesyonal sa pagitan ng Barcelona HQ at iba’t ibang rehiyon sa buong mundo.
Read More


