
Trade The World
EUR/JPY Price Forecast: Hovers around 172.00 with bullish RSI above 50
Ni Akhtar Faruqui
Petsa ng Pag-publish: 7 Aug 2025 | Petsa ng Pag-edit: 7 Aug 2025


POPULAR ARTICLES

EUR/JPY holds ground after registering gains in the previous two consecutive sessions, trading around 171.90 during the European hours on Wednesday. The technical analysis of the daily chart suggests the ongoing neutral market bias as the currency cross remains within the rectangular pattern.
- EUR/JPY may explore on the upside around 173.90, the highest since July 2024.
- The 14-day RSI is positioned above 50, indicating a bullish bias is active.
- The initial support appears at the nine-day EMA of 171.52.
EUR/JPY holds ground after registering gains in the previous two consecutive sessions, trading around 171.90 during the European hours on Wednesday. The technical analysis of the daily chart suggests the ongoing neutral market bias as the currency cross remains within the rectangular pattern.
The 14-day Relative Strength Index (RSI) is positioned above the 50 mark, suggesting that the bullish bias may prevail. Additionally, the short-term price momentum is stronger as the EUR/JPY cross has moved above the nine-day Exponential Moving Average (EMA).
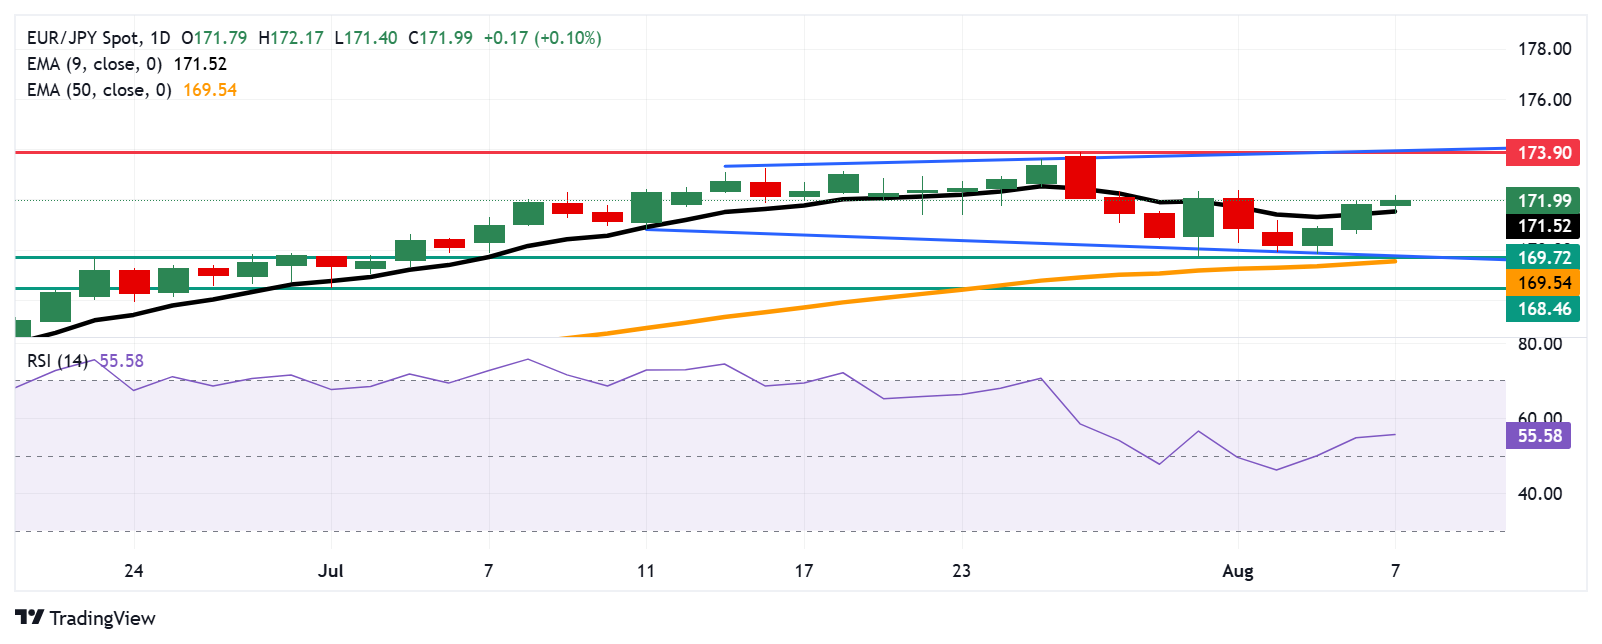
On the upside, the EUR/JPY cross may explore the region around 173.90, the highest since July 2024, recorded on July 28, 2025, aligned with the upper boundary of the rectangle around the psychological level of 174.00.
The EUR/JPY cross may find primary support at the nine-day EMA of 171.52. A break below this level would weaken the short-term price momentum and put downward pressure on the currency cross to navigate the region around the five-week low at 169.72, which was recorded on July 31, aligned with the rectangle’s lower boundary. Further support appears at the 50-day EMA at 169.54, followed by the two-month low at 168.46, recorded on July 1.
EUR/JPY: Daily Chart
Euro PRICE Today
The table below shows the percentage change of Euro (EUR) against listed major currencies today. Euro was the strongest against the US Dollar.
| USD | EUR | GBP | JPY | CAD | AUD | NZD | CHF | |
|---|---|---|---|---|---|---|---|---|
| USD | -0.20% | -0.10% | -0.07% | -0.06% | -0.40% | -0.37% | 0.00% | |
| EUR | 0.20% | 0.08% | 0.14% | 0.13% | -0.21% | -0.23% | 0.18% | |
| GBP | 0.10% | -0.08% | 0.08% | 0.06% | -0.28% | -0.31% | 0.12% | |
| JPY | 0.07% | -0.14% | -0.08% | 0.01% | -0.29% | -0.34% | 0.13% | |
| CAD | 0.06% | -0.13% | -0.06% | -0.01% | -0.33% | -0.37% | 0.08% | |
| AUD | 0.40% | 0.21% | 0.28% | 0.29% | 0.33% | -0.02% | 0.42% | |
| NZD | 0.37% | 0.23% | 0.31% | 0.34% | 0.37% | 0.02% | 0.45% | |
| CHF | -0.00% | -0.18% | -0.12% | -0.13% | -0.08% | -0.42% | -0.45% |
The heat map shows percentage changes of major currencies against each other. The base currency is picked from the left column, while the quote currency is picked from the top row. For example, if you pick the Euro from the left column and move along the horizontal line to the US Dollar, the percentage change displayed in the box will represent EUR (base)/USD (quote).

FXStreet
Higit sa isang milyong user ang umaasa sa FXStreet para sa real-time market data, charting tools, expert insights, at Forex news. Ang komprehensibong economic calendar at educational webinars nito ay tumutulong sa mga trader na manatiling may alam at gumawa ng kalkuladong mga desisyon. Sinusuportahan ang FXStreet ng humigit-kumulang 60 propesyonal sa pagitan ng Barcelona HQ at iba’t ibang rehiyon sa buong mundo.
Read More


