
Trade The World
EUR/JPY Price Forecast: Rebounds from 172.50 support near 50-day EMA
Ni Akhtar Faruqui
Petsa ng Pag-publish: 2 Oct 2025 | Petsa ng Pag-edit: 2 Oct 2025


POPULAR ARTICLES

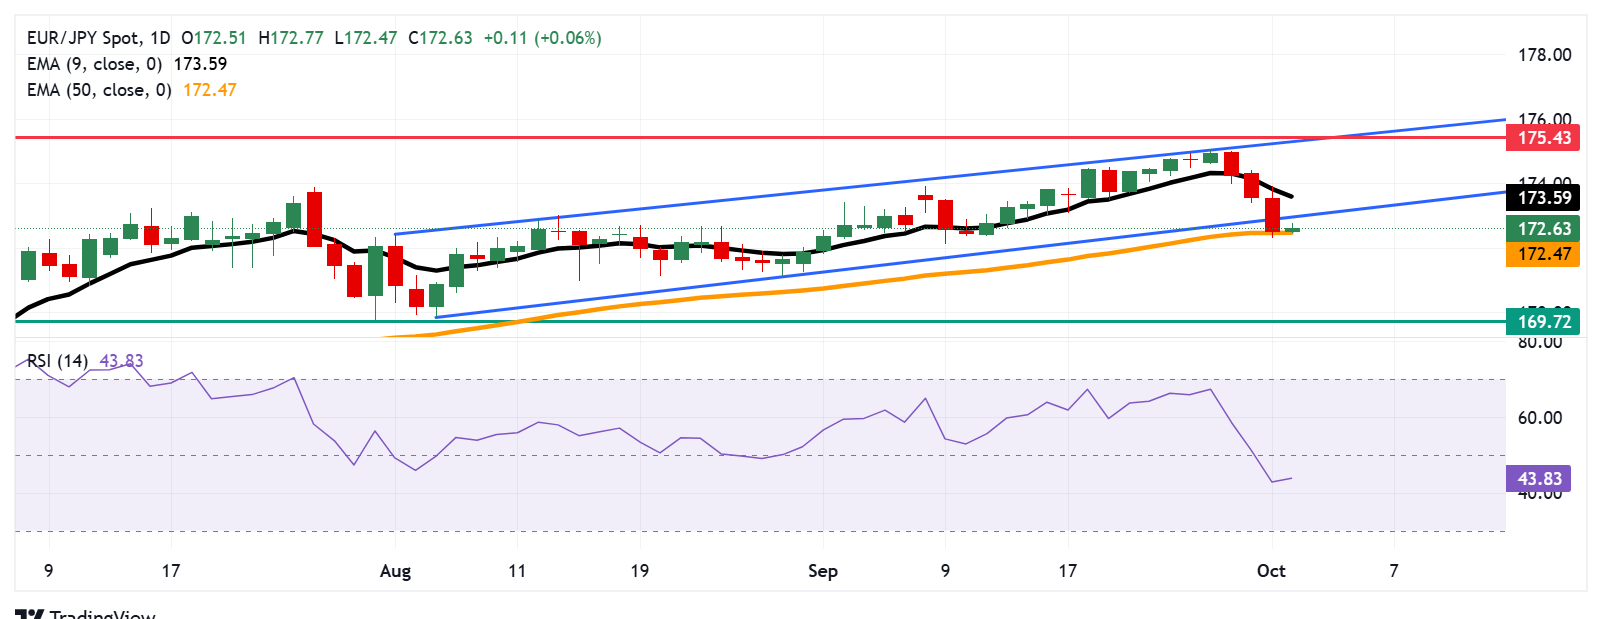
EUR/JPY halts its three-day losing streak, trading around 172.60 during the Asian hours on Thursday. The technical analysis of the daily chart indicates a shift from bullish to bearish bias as the currency cross is positioned slightly below the ascending channel pattern.
- EUR/JPY may find its primary support at the 50-day EMA at 172.47.
- The 14-day Relative Strength Index stays below 50, reinforcing the bearish outlook.
- A rebound back into the ascending channel would restore the bullish bias.
EUR/JPY halts its three-day losing streak, trading around 172.60 during the Asian hours on Thursday. The technical analysis of the daily chart indicates a shift from bullish to bearish bias as the currency cross is positioned slightly below the ascending channel pattern. However, a rebound back into the channel would suggest a false breakout, and the broader upward trend remains intact.
However, the 14-day Relative Strength Index (RSI) remains below the 50 mark, suggesting that bearish bias is strengthening. Additionally, the short-term price momentum is weaker as the EUR/JPY cross is positioned below the nine-day Exponential Moving Average (EMA).
On the downside, the immediate support lies at the 50-day EMA at 172.47. A break below this level would dampen the medium-term price momentum and prompt the EUR/JPY cross to navigate the region around the three-month low of 169.72, which was recorded on July 31.
A rebound into the ascending channel would revive the bullish bias and lead the EUR/JPY cross to test the nine-day EMA of 173.59. Further advances would improve the short-term price momentum and support the currency cross to explore the region around the upper boundary of the ascending channel at 175.30, followed by the all-time high of 175.43, reached in July 2024.
EUR/JPY: Daily Chart
Euro Price Today
The table below shows the percentage change of Euro (EUR) against listed major currencies today. Euro was the strongest against the Canadian Dollar.
| USD | EUR | GBP | JPY | CAD | AUD | NZD | CHF | |
|---|---|---|---|---|---|---|---|---|
| USD | -0.04% | 0.00% | 0.04% | 0.07% | -0.04% | -0.28% | -0.05% | |
| EUR | 0.04% | 0.03% | 0.09% | 0.09% | -0.02% | -0.14% | -0.03% | |
| GBP | -0.00% | -0.03% | 0.08% | 0.03% | -0.01% | -0.15% | -0.05% | |
| JPY | -0.04% | -0.09% | -0.08% | 0.00% | -0.09% | -0.44% | -0.07% | |
| CAD | -0.07% | -0.09% | -0.03% | -0.01% | -0.11% | -0.20% | -0.12% | |
| AUD | 0.04% | 0.02% | 0.01% | 0.09% | 0.11% | -0.19% | -0.02% | |
| NZD | 0.28% | 0.14% | 0.15% | 0.44% | 0.20% | 0.19% | 0.26% | |
| CHF | 0.05% | 0.03% | 0.05% | 0.07% | 0.12% | 0.02% | -0.26% |
The heat map shows percentage changes of major currencies against each other. The base currency is picked from the left column, while the quote currency is picked from the top row. For example, if you pick the Euro from the left column and move along the horizontal line to the US Dollar, the percentage change displayed in the box will represent EUR (base)/USD (quote).

FXStreet
Higit sa isang milyong user ang umaasa sa FXStreet para sa real-time market data, charting tools, expert insights, at Forex news. Ang komprehensibong economic calendar at educational webinars nito ay tumutulong sa mga trader na manatiling may alam at gumawa ng kalkuladong mga desisyon. Sinusuportahan ang FXStreet ng humigit-kumulang 60 propesyonal sa pagitan ng Barcelona HQ at iba’t ibang rehiyon sa buong mundo.
Read More


