
Trade The World
EUR/JPY Price Forecast: Stays above 173.00 after rebounding from 50-day EMA
Ni Akhtar Faruqui
Petsa ng Pag-publish: 3 Oct 2025 | Petsa ng Pag-edit: 3 Oct 2025


POPULAR ARTICLES

EUR/JPY gains ground after a neutral day, trading around 173.10 during the Asian hours on Friday. The technical analysis of the daily chart indicates a revival of bullish bias as the currency cross rebounded toward the ascending channel pattern.
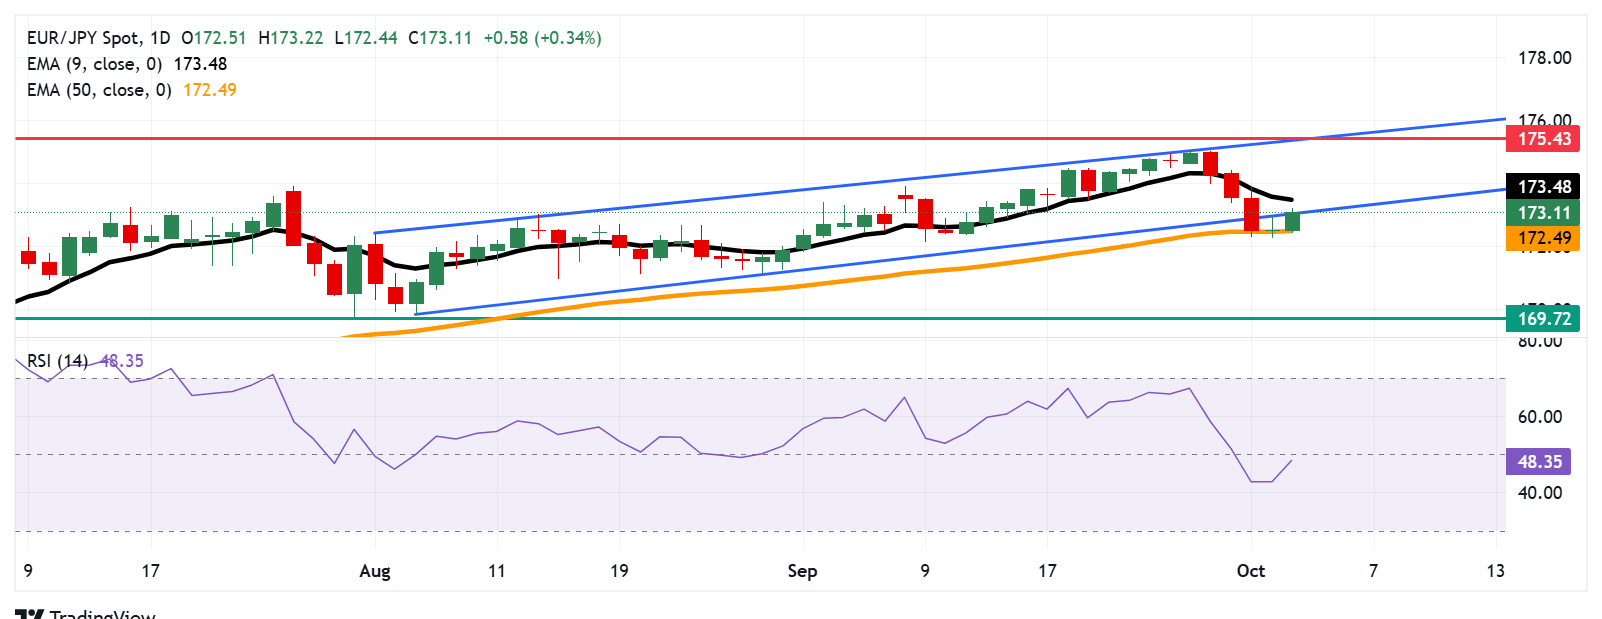
- EUR/JPY may target its initial support at the 50-day EMA at 172.49.
- The 14-day Relative Strength Index still stays below 50, indicating the bearish bias is active.
- The primary barrier appears at the nine-day EMA of 173.48.
EUR/JPY gains ground after a neutral day, trading around 173.10 during the Asian hours on Friday. The technical analysis of the daily chart indicates a revival of bullish bias as the currency cross rebounded toward the ascending channel pattern.
However, the 14-day Relative Strength Index (RSI) remains below the 50 mark, suggesting that bearish bias is still in play. Additionally, the short-term price momentum is weaker as the EUR/JPY cross is positioned below the nine-day Exponential Moving Average (EMA).
On the downside, the primary support appears at the 50-day EMA at 172.49. A break below this level would weaken the medium-term price momentum and put downward pressure on the EUR/JPY cross to navigate the region around the three-month low of 169.72, which was recorded on July 31.
A successful return into the ascending channel would revive the bullish bias and lead the EUR/JPY cross to test its initial barrier at the nine-day EMA of 173.48. Further advances would improve the short-term price momentum and support the currency cross to explore the area around the ascending channel’s upper boundary at 175.40, aligned with the all-time high of 175.43, reached in July 2024.
EUR/JPY: Daily Chart
Euro Price Today
The table below shows the percentage change of Euro (EUR) against listed major currencies today. Euro was the strongest against the Japanese Yen.
| USD | EUR | GBP | JPY | CAD | AUD | NZD | CHF | |
|---|---|---|---|---|---|---|---|---|
| USD | -0.08% | -0.09% | 0.28% | -0.01% | -0.05% | -0.05% | -0.04% | |
| EUR | 0.08% | 0.05% | 0.35% | 0.08% | 0.04% | 0.03% | 0.04% | |
| GBP | 0.09% | -0.05% | 0.34% | 0.01% | -0.01% | -0.02% | -0.01% | |
| JPY | -0.28% | -0.35% | -0.34% | -0.29% | -0.34% | -0.34% | -0.34% | |
| CAD | 0.01% | -0.08% | -0.01% | 0.29% | -0.02% | -0.04% | -0.02% | |
| AUD | 0.05% | -0.04% | 0.01% | 0.34% | 0.02% | -0.01% | -0.03% | |
| NZD | 0.05% | -0.03% | 0.02% | 0.34% | 0.04% | 0.01% | 0.01% | |
| CHF | 0.04% | -0.04% | 0.00% | 0.34% | 0.02% | 0.03% | -0.01% |
The heat map shows percentage changes of major currencies against each other. The base currency is picked from the left column, while the quote currency is picked from the top row. For example, if you pick the Euro from the left column and move along the horizontal line to the US Dollar, the percentage change displayed in the box will represent EUR (base)/USD (quote).

FXStreet
Higit sa isang milyong user ang umaasa sa FXStreet para sa real-time market data, charting tools, expert insights, at Forex news. Ang komprehensibong economic calendar at educational webinars nito ay tumutulong sa mga trader na manatiling may alam at gumawa ng kalkuladong mga desisyon. Sinusuportahan ang FXStreet ng humigit-kumulang 60 propesyonal sa pagitan ng Barcelona HQ at iba’t ibang rehiyon sa buong mundo.
Read More


