
Trade The World
Hyperliquid Price Forecast: HYPE bears in control of momentum
Ni Manish Chhetri
Petsa ng Pag-publish: 7 Oct 2025 | Petsa ng Pag-edit: 7 Oct 2025


POPULAR ARTICLES

Hyperliquid (HYPE) extends its decline for the fifth consecutive day, trading below $46 at the time of writing on Tuesday after facing rejection from a key resistance level. Derivatives data further support the bearish thesis, as short bets reach their highest level in over a month.
- Hyperliquid price extends decline on Tuesday after facing rejection from a previously broken trendline.
- Derivatives data paint a bearish outlook as HYPE traders' short bets reach the highest level in over a month.
- Technical analysis suggests a potential correction ahead as momentum indicators indicate a bearish trend.
Hyperliquid (HYPE) extends its decline for the fifth consecutive day, trading below $46 at the time of writing on Tuesday after facing rejection from a key resistance level. Derivatives data further support the bearish thesis, as short bets reach their highest level in over a month. Moreover, the technical outlook suggests a potential correction ahead, as momentum indicators display a downward trend.
HYPE derivatives data show bearish bias
Coinglass' long-to-short ratio reads 0.80 on Tuesday, marking the lowest level in over a month. A ratio below one indicates bearish sentiment in the market, as traders are betting that the asset price will decline.
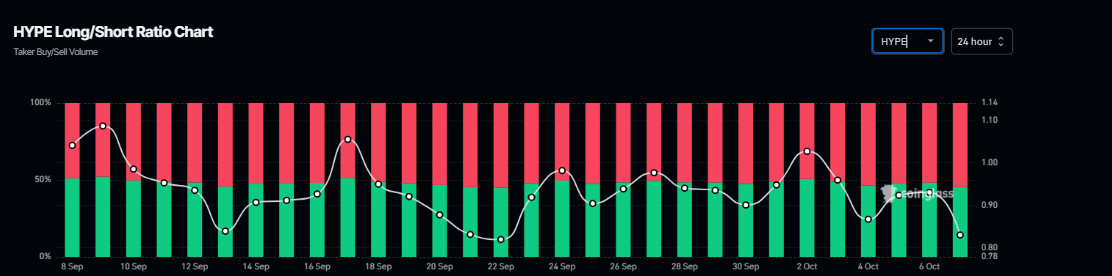
HYPE long-to-short ratio chart. Source: Coinglass
CryptoQuant’s chart below shows that Hyperliquid’s spot volume bubble map indicators suggest a spot market activity condition that is overheating, which could further fuel the price decline in HYPE.
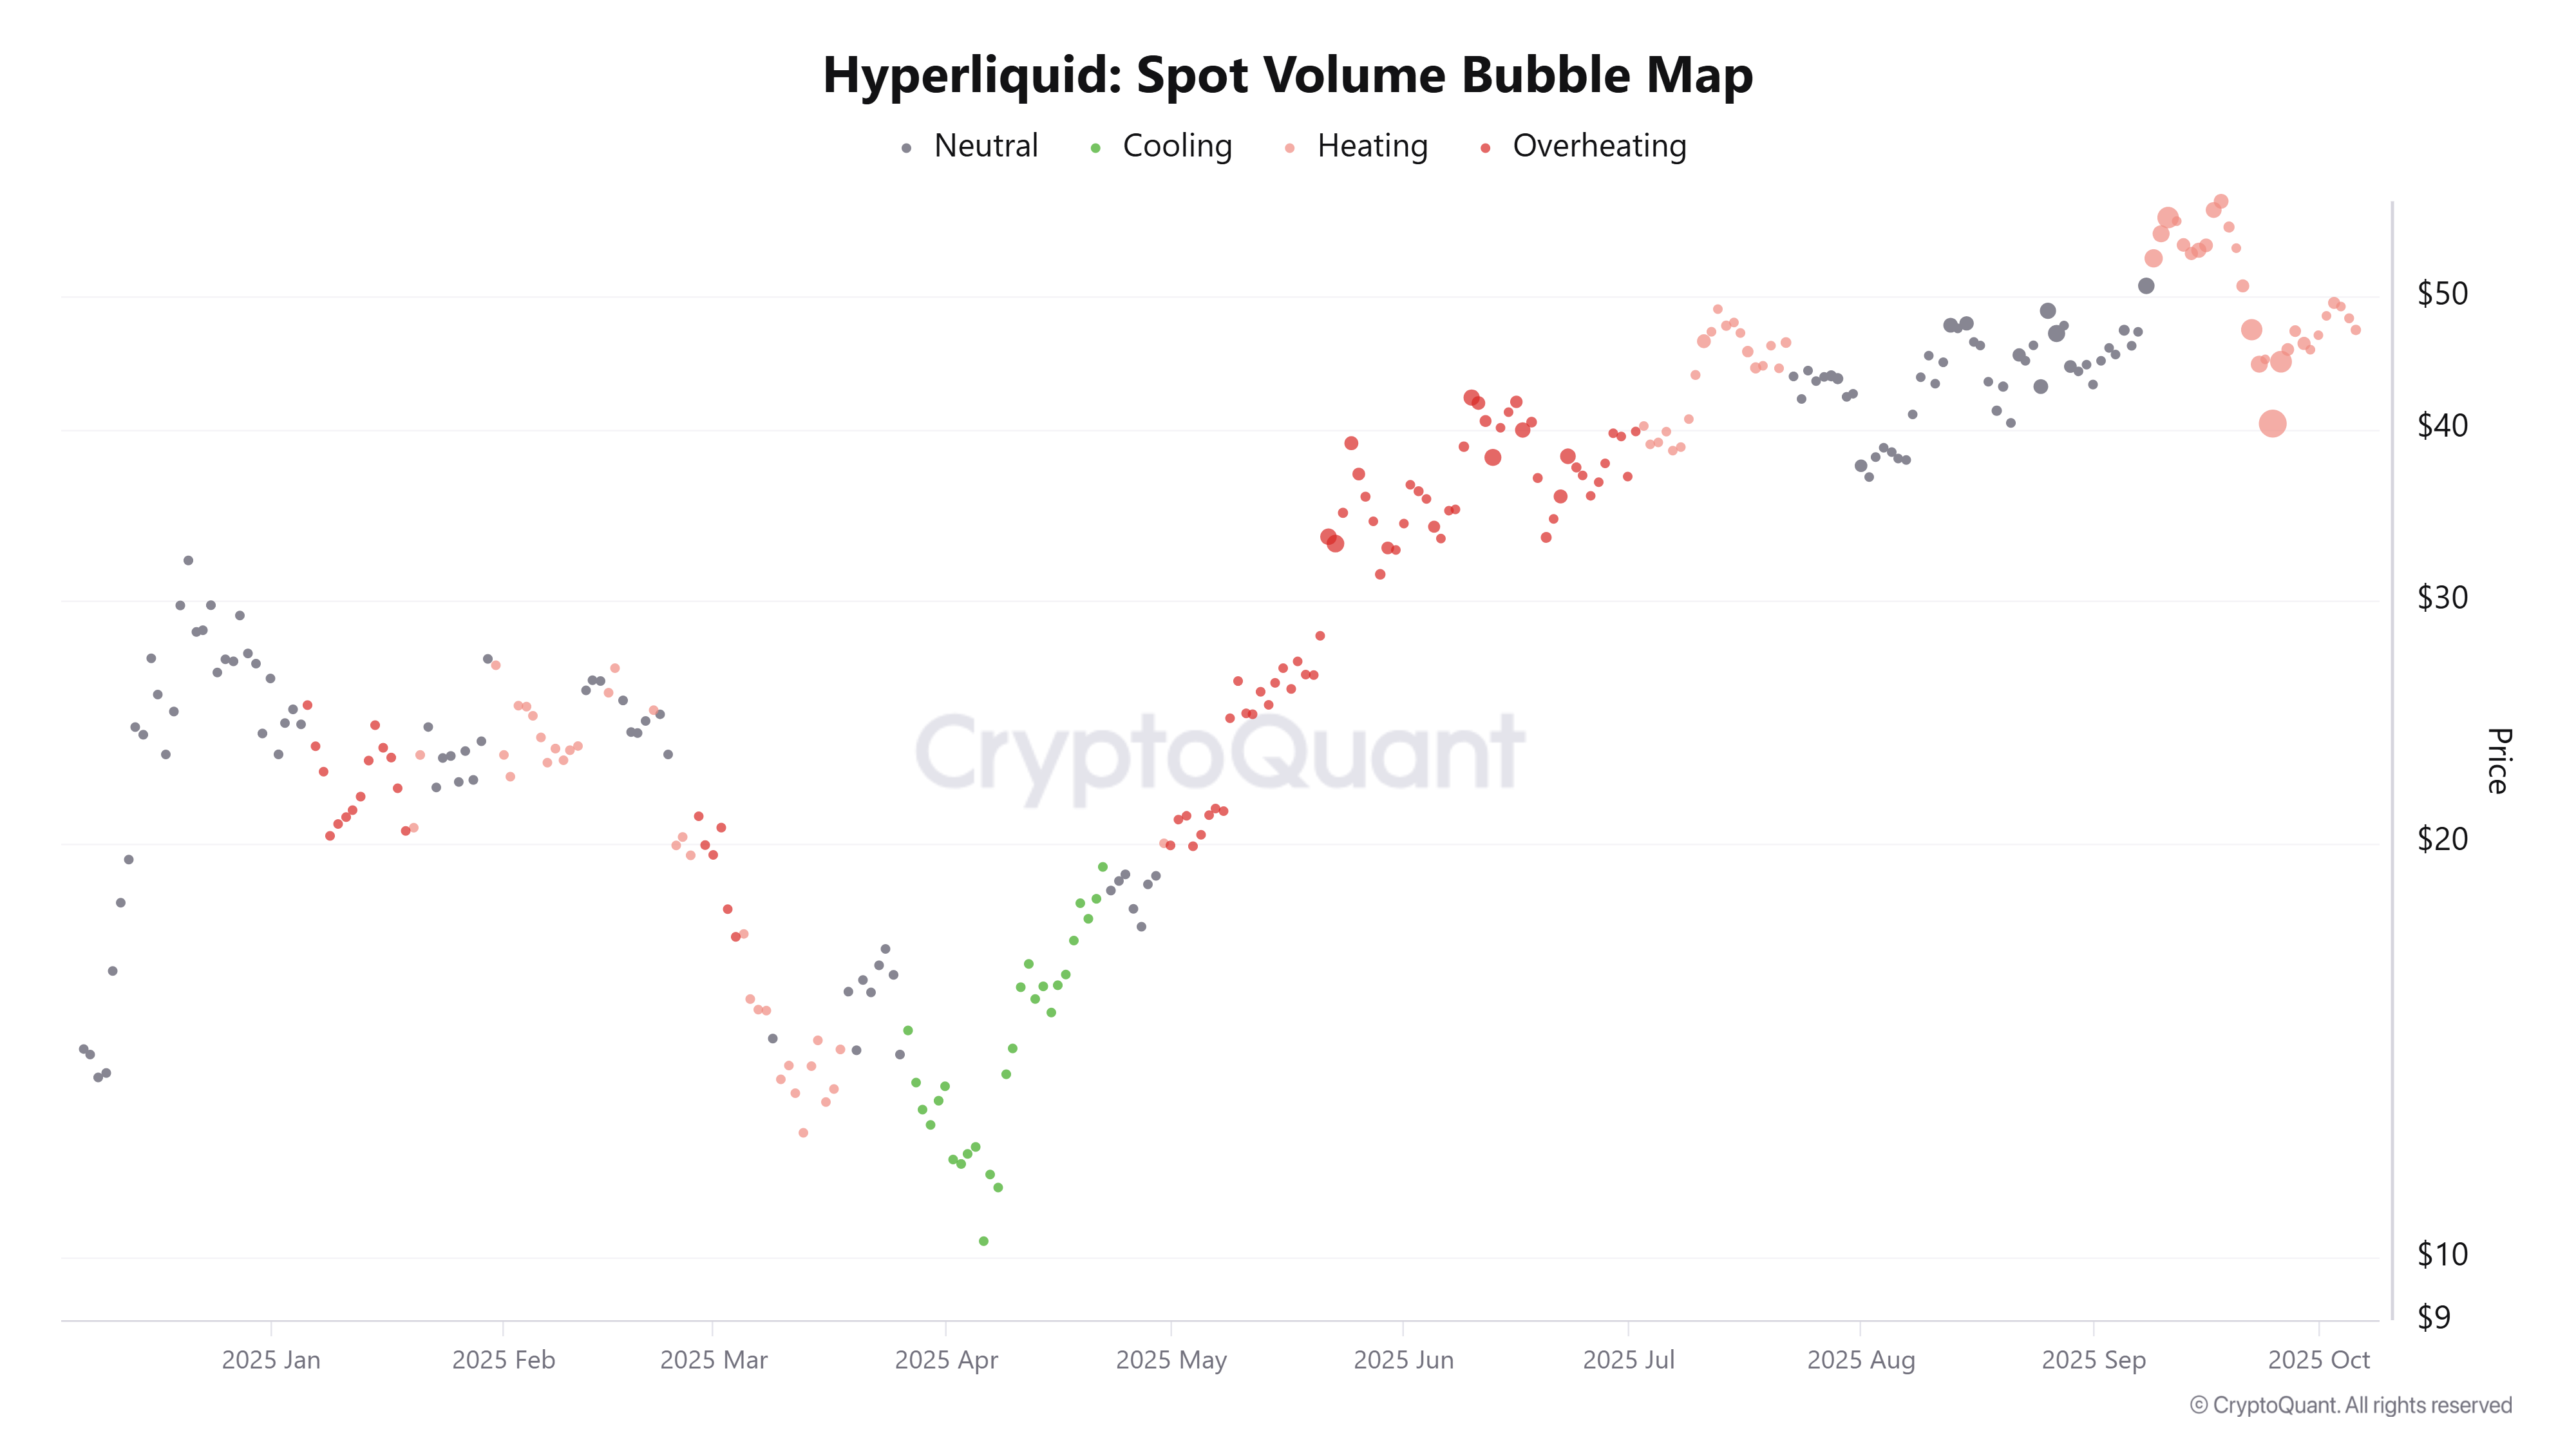
Hyperliquid spot volume bubble map chart. Source: CryptoQuant
Hyperliquid Price Forecast: HYPE bears aiming for levels below $40
Hyperliquid price faced rejection from a previously broken ascending trendline (drawn by connecting multiple lows since early April) on Friday and declined by nearly 7% by Monday. At the time of writing on Tuesday, HYPE continues to trade down at around $45.90.
If HYPE continues its downward trend, it could extend the decline toward the daily support at $39.11.
The Relative Strength Index (RSI) on the daily chart reads 45, extending the decline below its neutral level of 50 and indicating that bearish momentum is gaining traction. Moreover, the Moving Average Convergence Divergence (MACD) indicator is showing a bearish crossover on Tuesday, further supporting the bearish view.
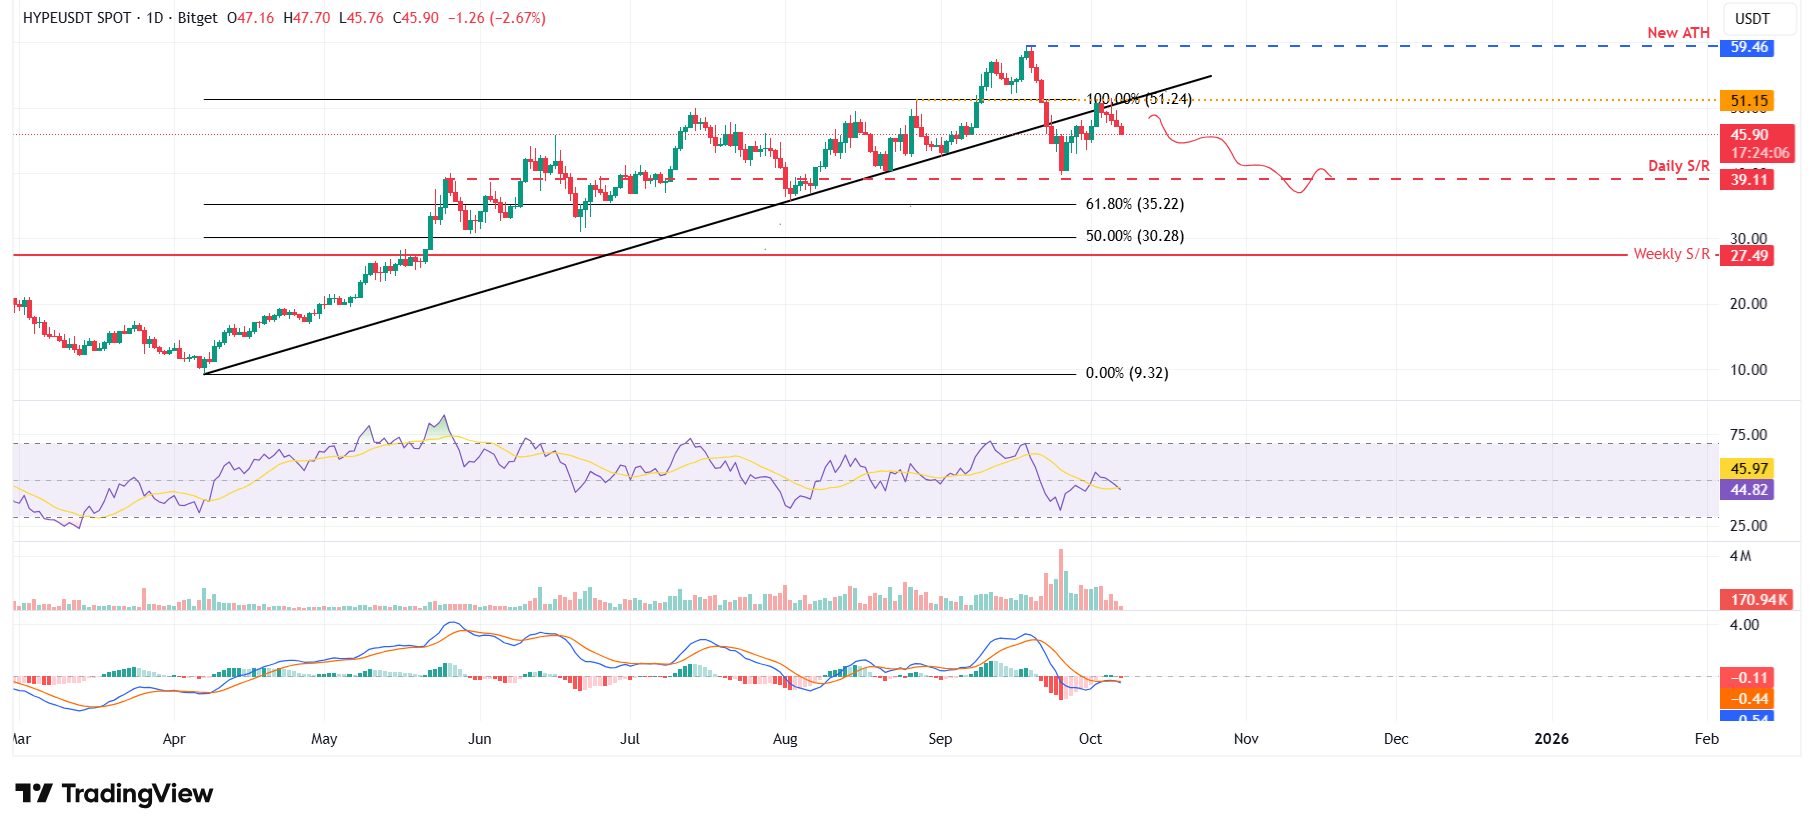
HYPE/USDT daily chart
However, if HYPE recovers, it could extend the recovery toward the daily resistance level at $51.15.

FXStreet
Higit sa isang milyong user ang umaasa sa FXStreet para sa real-time market data, charting tools, expert insights, at Forex news. Ang komprehensibong economic calendar at educational webinars nito ay tumutulong sa mga trader na manatiling may alam at gumawa ng kalkuladong mga desisyon. Sinusuportahan ang FXStreet ng humigit-kumulang 60 propesyonal sa pagitan ng Barcelona HQ at iba’t ibang rehiyon sa buong mundo.
Read More


