
Trade The World
Pi Network Price Forecast: PI token rally holds steady amid rising CEXs inflows
Ni Vishal Dixit
Petsa ng Pag-publish: 29 Oct 2025 | Petsa ng Pag-edit: 29 Oct 2025


POPULAR ARTICLES

Pi Network (PI) trades above $0.2600 at the time of writing on Wednesday, surfacing above the 50-day Exponential Moving Average at $0.2618 for a potential breakout.
- Pi Network recovers above the 50-day EMA, staging a potential breakout rally.
- The CEXs' wallets registered 6.28 million PI token inflows, indicating substantial deposits.
- Roughly 120 million PI tokens will be unlocked in November, potentially fueling selling pressure.
Pi Network (PI) trades above $0.2600 at the time of writing on Wednesday, surfacing above the 50-day Exponential Moving Average at $0.2618 for a potential breakout. The technical outlook is bullish, while the near 120 million PI tokens to be unlocked in November and rising inflows over Centralized Exchanges (CEXs) could provide headwinds.
CEXs' inflow, token unlocks add to supply risk
A surge in CEXs balance reserves signals an increase in potential supply pressure. PiScan data shows that the CEXs' wallet balance has increased by 6.28 million PI tokens over the last 24 hours, to 419.94 million PI. This inflow increases the risk of supply pressure after the recent mainnet migration of 2.69 million users, which enabled token transfers to CEXs.
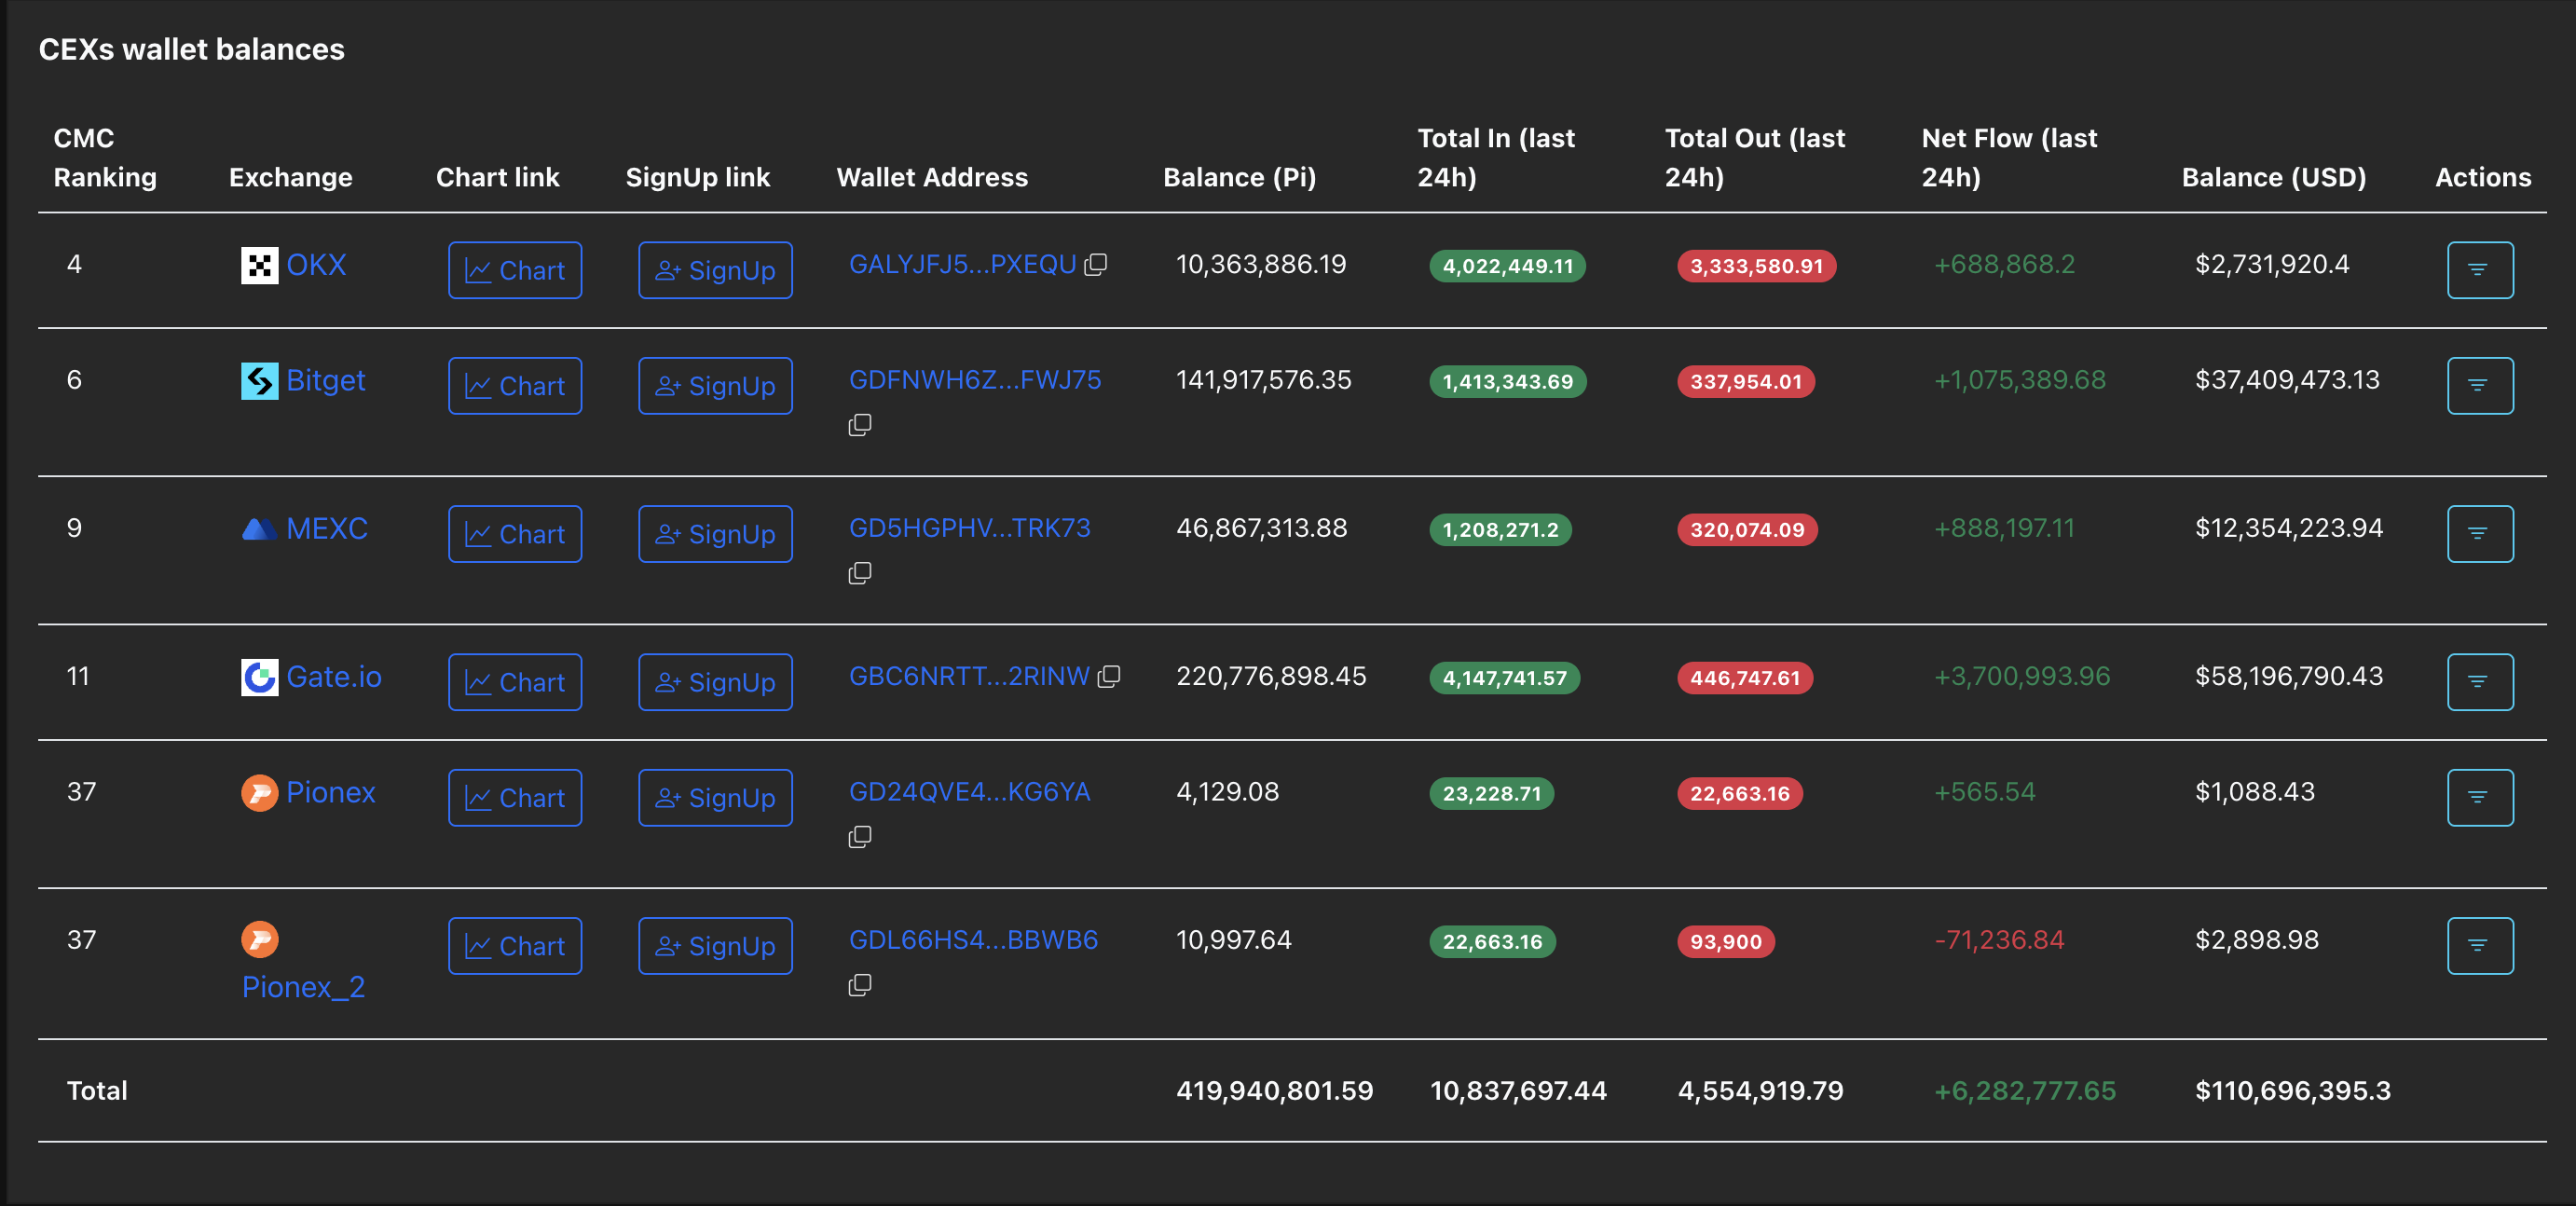
CEX's wallet balance. Source: PiScan
On the other hand, the PiScan token unlock schedule indicates that 119.93 million PI will be released in November. This unlock, coupled with rising inflows into CEXs, could intensify the headwinds facing the ongoing PI token recovery.
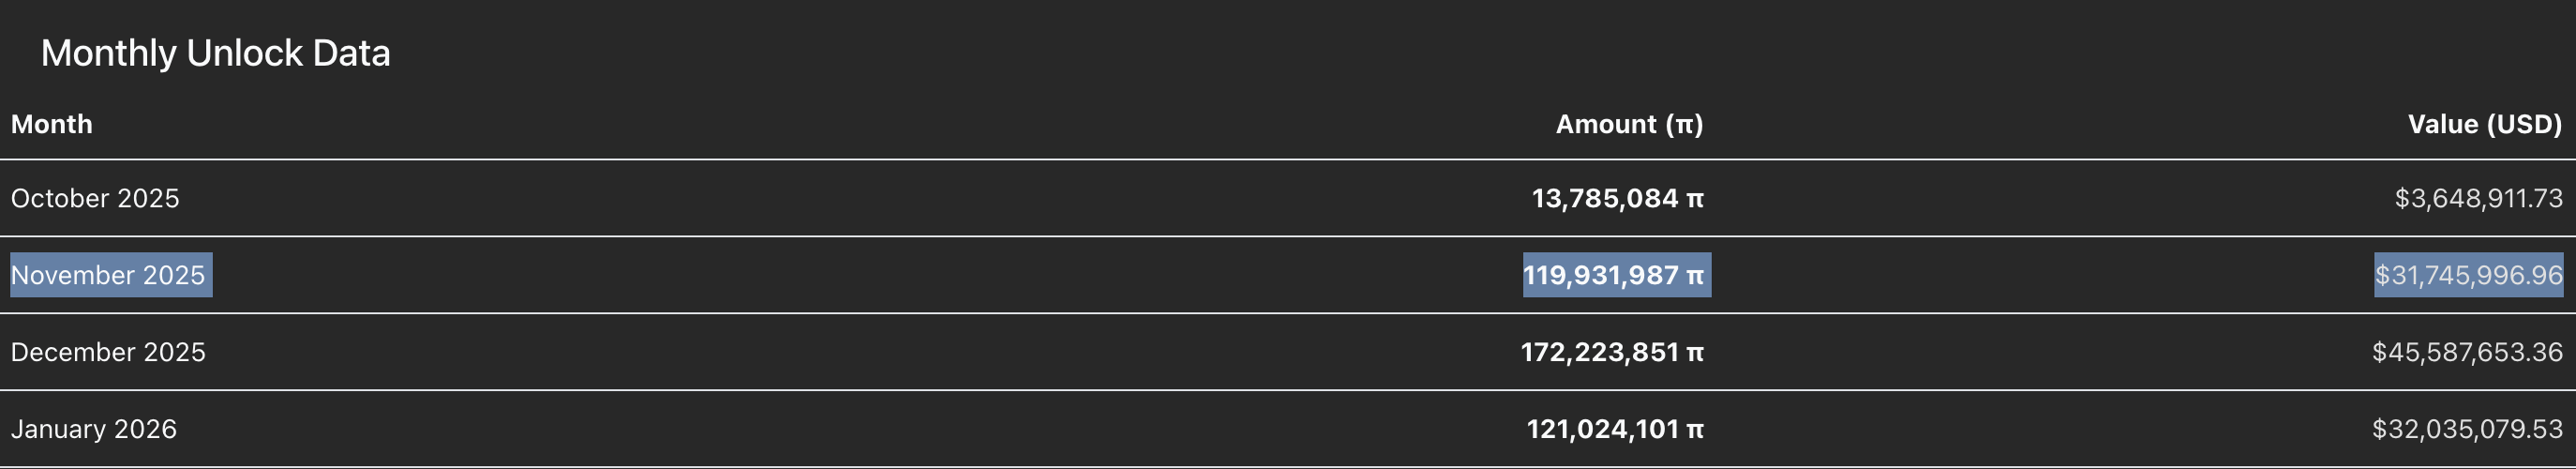
PI token unlock schedule. Source: PiScan
Pi Network eyes further gains above the 50-day EMA
Pi Network trades above the 50-day EMA at $0.2618, suggesting a potential breakout of the dynamic resistance that has held since May 21. A successful close above $0.2618 could extend the PI rally to $0.3220, marked by the August 1 low.
The momentum indicators on the daily chart signal a steady rise in buying pressure, as the Relative Strength Index (RSI) at 65 is inching toward the overbought zone. Additionally, the Moving Average Convergence Divergence (MACD) and the signal line rise towards the zero line, aiming to cross into the positive territory as bullish momentum increases.
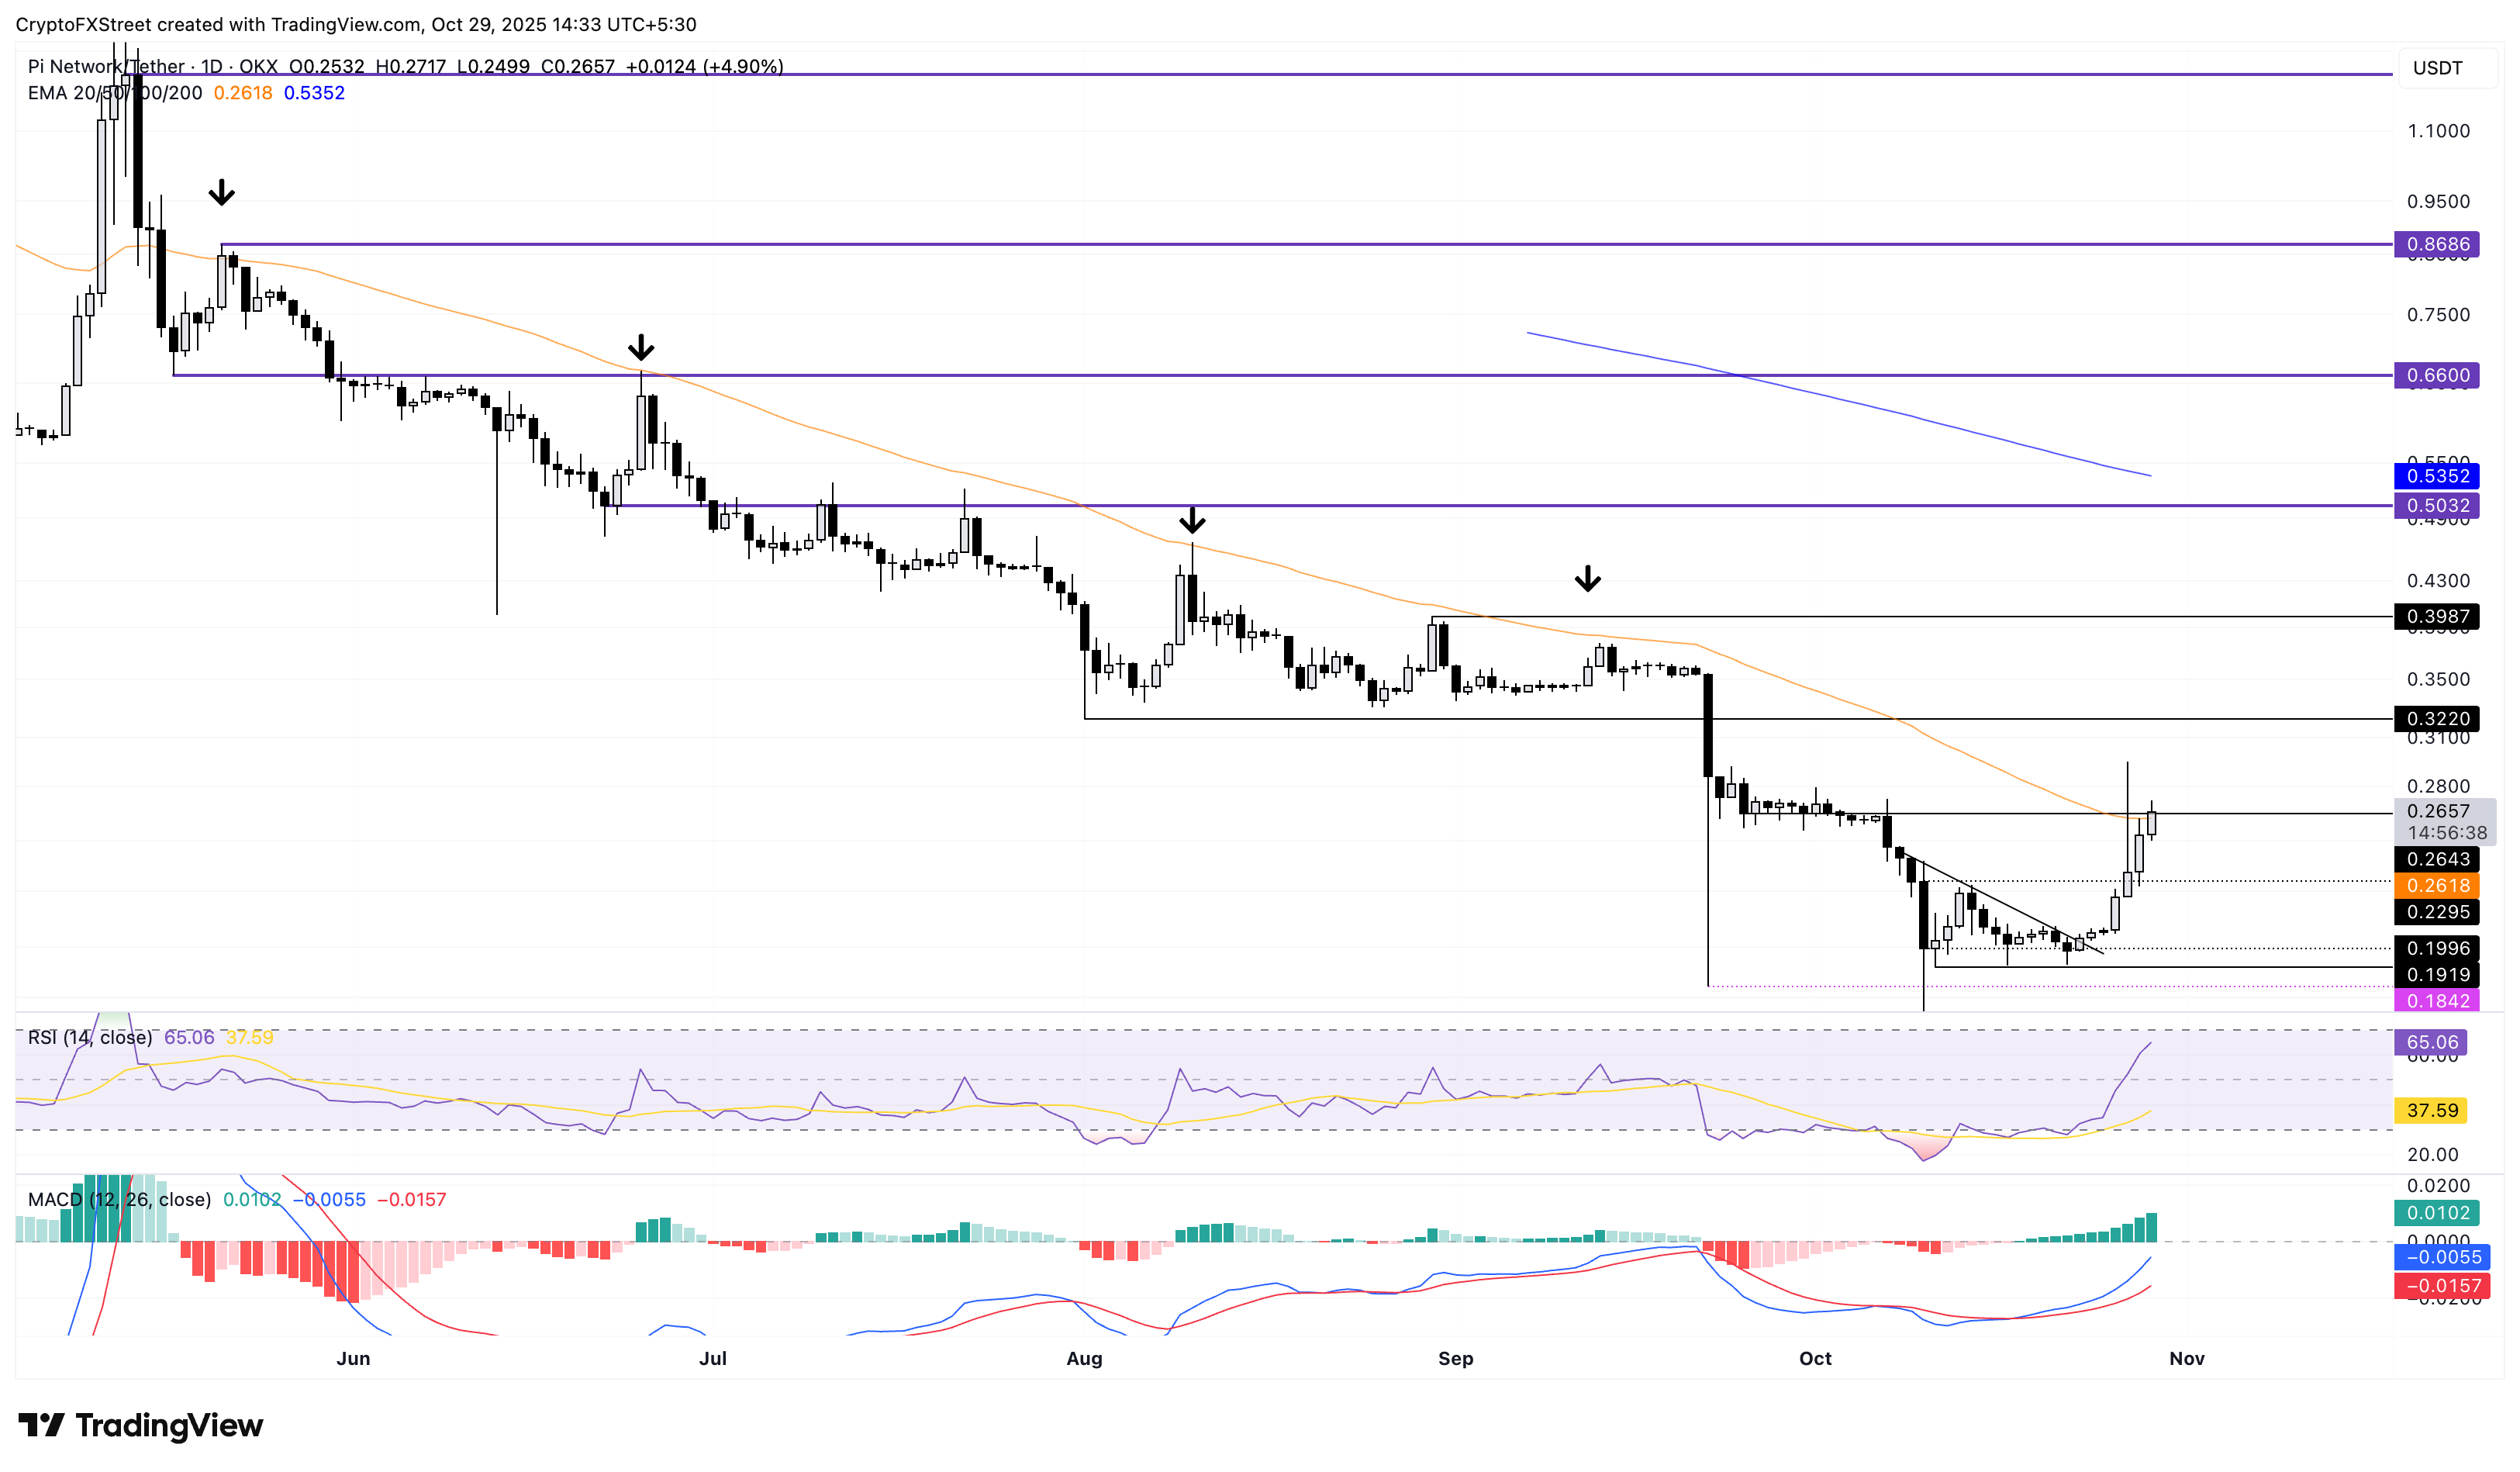
PI/USDT daily price chart.
On the flip side, a reversal from the 50-day EMA could retest the $0.1919 base, marked by the low of October 11.
Cryptocurrency prices FAQs
Token launches influence demand and adoption among market participants. Listings on crypto exchanges deepen the liquidity for an asset and add new participants to an asset’s network. This is typically bullish for a digital asset.
A hack is an event in which an attacker captures a large volume of the asset from a DeFi bridge or hot wallet of an exchange or any other crypto platform via exploits, bugs or other methods. The exploiter then transfers these tokens out of the exchange platforms to ultimately sell or swap the assets for other cryptocurrencies or stablecoins. Such events often involve an en masse panic triggering a sell-off in the affected assets.
Macroeconomic events like the US Federal Reserve’s decision on interest rates influence crypto assets mainly through the direct impact they have on the US Dollar. An increase in interest rate typically negatively influences Bitcoin and altcoin prices, and vice versa. If the US Dollar index declines, risk assets and associated leverage for trading gets cheaper, in turn driving crypto prices higher.
Halvings are typically considered bullish events as they slash the block reward in half for miners, constricting the supply of the asset. At consistent demand if the supply reduces, the asset’s price climbs.

FXStreet
Higit sa isang milyong user ang umaasa sa FXStreet para sa real-time market data, charting tools, expert insights, at Forex news. Ang komprehensibong economic calendar at educational webinars nito ay tumutulong sa mga trader na manatiling may alam at gumawa ng kalkuladong mga desisyon. Sinusuportahan ang FXStreet ng humigit-kumulang 60 propesyonal sa pagitan ng Barcelona HQ at iba’t ibang rehiyon sa buong mundo.
Read More


