
Trade The World
Silver Price Forecast: XAG/USD forms bearish multiple tope near $54.50 supply zone
Ni Haresh Menghani
Petsa ng Pag-publish: 28 Nov 2025 | Petsa ng Pag-edit: 28 Nov 2025


POPULAR ARTICLES

Silver (XAG/USD) struggles to capitalize on the Asian session move up and retreats from the $54.40-$54.45 region, or its highest level since October 17, touched earlier this Friday.
- Silver retreats after touching an over one-month peak during the Asian session on Friday.
- The technical setup favors bulls and warrants caution before confirming a near-term top.
- Corrective slides could be seen as buying opportunities and remain limited near $53.00.
Silver (XAG/USD) struggles to capitalize on the Asian session move up and retreats from the $54.40-$54.45 region, or its highest level since October 17, touched earlier this Friday. The white metal currently trades around mid-$53.00s, still up 0.20% for the day, and seems poised to register strong weekly gains.
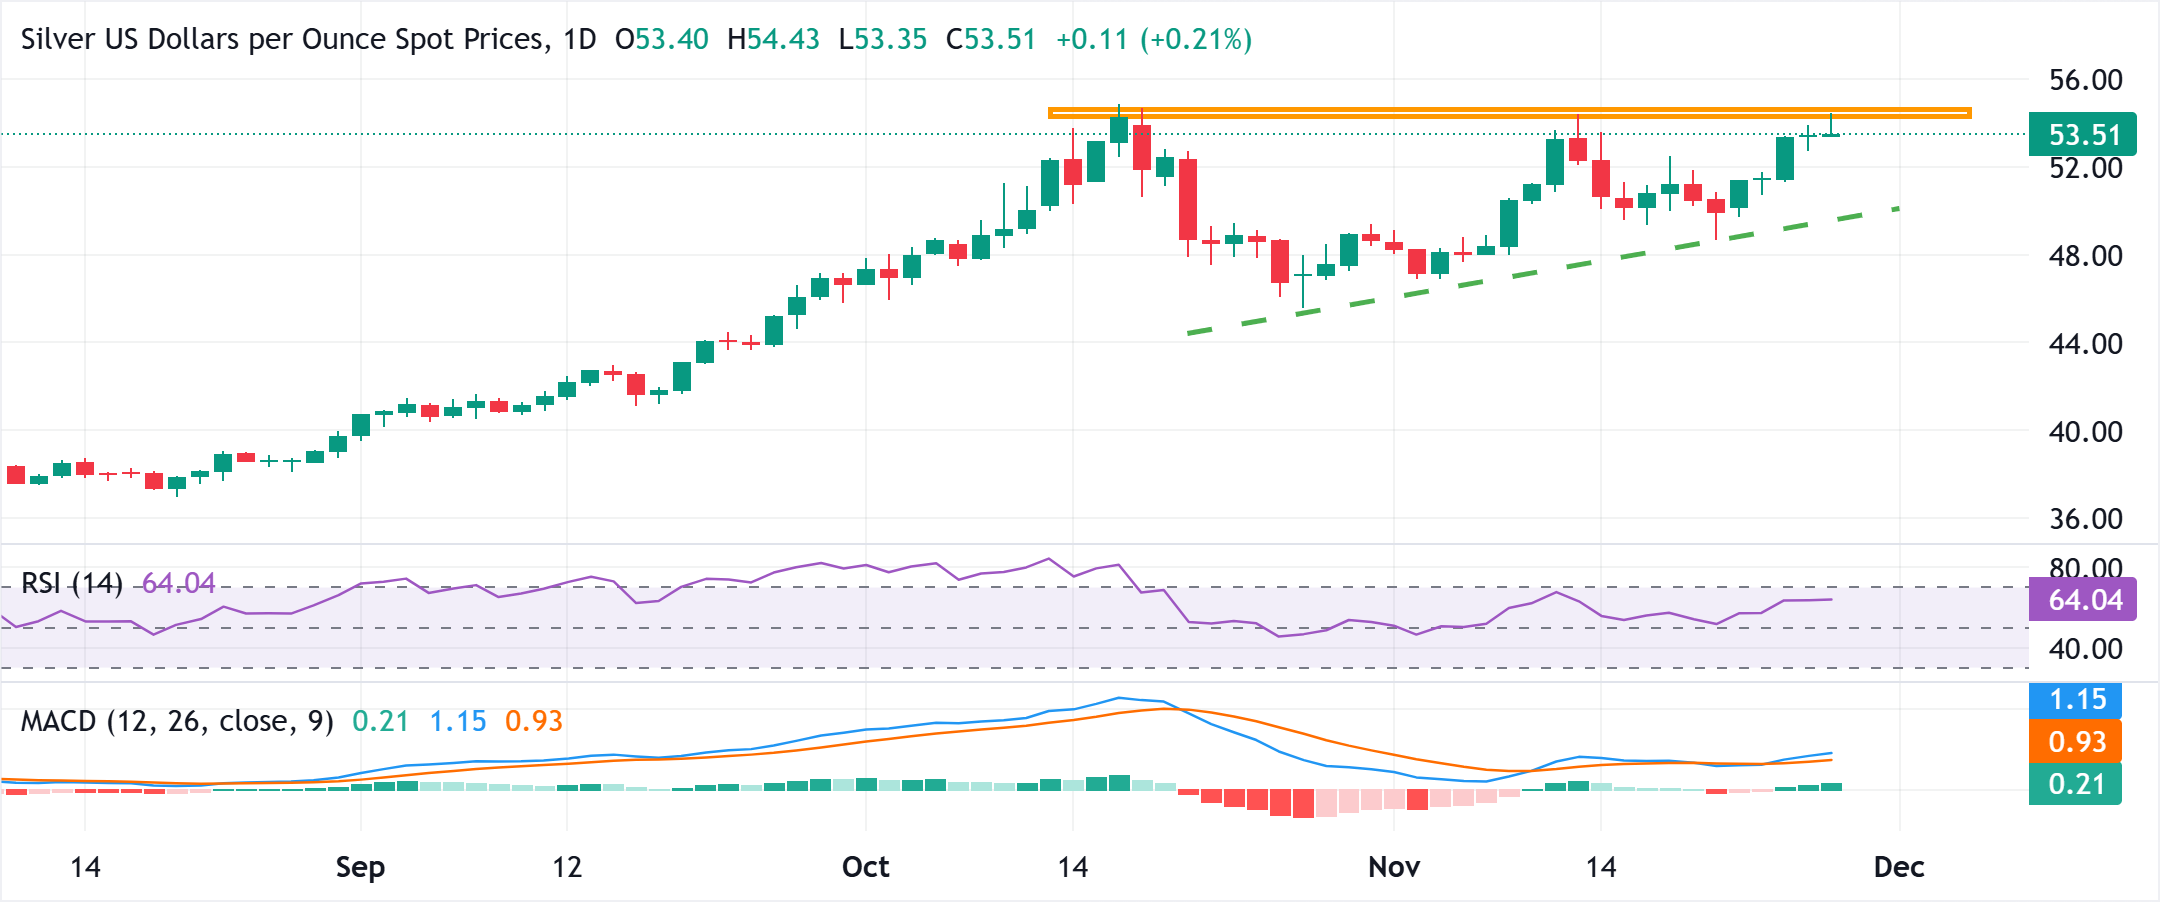
From a technical perspective, the recent repeated failures to find acceptance and build on the momentum beyond the $54.40-$54.50 horizontal barrier, in turn, constitute the formation of multiple tops on the daily chart. However, oscillators on the said chart are holding in positive territory and warrant some caution before confirming that the XAG/USD has topped out in the near term.
Hence, any subsequent pullback below the $53.25 zone, or the Asian session low, is more likely to attract fresh buyers near the $53.00 round figure. This should help limit the downside for the XAG/USD near the overnight trough, around the $52.70-$52.65 region. A convincing break below the latter could prompt some technical selling and drag the white metal further towards the $52.00 mark.
On the flip side, the $54.20-$54.25 region might continue to act as an immediate hurdle, above which the XAG/USD could aim to retest the all-time peak, around the $54.70-$54.75 region, touched in October. Some follow-through buying, leading to a further strength beyond the $55.00 psychological mark, will be seen as a fresh trigger for bulls and pave the way for a further near-term appreciation.
Silver daily chart
Silver FAQs
Silver is a precious metal highly traded among investors. It has been historically used as a store of value and a medium of exchange. Although less popular than Gold, traders may turn to Silver to diversify their investment portfolio, for its intrinsic value or as a potential hedge during high-inflation periods. Investors can buy physical Silver, in coins or in bars, or trade it through vehicles such as Exchange Traded Funds, which track its price on international markets.
Silver prices can move due to a wide range of factors. Geopolitical instability or fears of a deep recession can make Silver price escalate due to its safe-haven status, although to a lesser extent than Gold's. As a yieldless asset, Silver tends to rise with lower interest rates. Its moves also depend on how the US Dollar (USD) behaves as the asset is priced in dollars (XAG/USD). A strong Dollar tends to keep the price of Silver at bay, whereas a weaker Dollar is likely to propel prices up. Other factors such as investment demand, mining supply – Silver is much more abundant than Gold – and recycling rates can also affect prices.
Silver is widely used in industry, particularly in sectors such as electronics or solar energy, as it has one of the highest electric conductivity of all metals – more than Copper and Gold. A surge in demand can increase prices, while a decline tends to lower them. Dynamics in the US, Chinese and Indian economies can also contribute to price swings: for the US and particularly China, their big industrial sectors use Silver in various processes; in India, consumers’ demand for the precious metal for jewellery also plays a key role in setting prices.
Silver prices tend to follow Gold's moves. When Gold prices rise, Silver typically follows suit, as their status as safe-haven assets is similar. The Gold/Silver ratio, which shows the number of ounces of Silver needed to equal the value of one ounce of Gold, may help to determine the relative valuation between both metals. Some investors may consider a high ratio as an indicator that Silver is undervalued, or Gold is overvalued. On the contrary, a low ratio might suggest that Gold is undervalued relative to Silver.

FXStreet
Higit sa isang milyong user ang umaasa sa FXStreet para sa real-time market data, charting tools, expert insights, at Forex news. Ang komprehensibong economic calendar at educational webinars nito ay tumutulong sa mga trader na manatiling may alam at gumawa ng kalkuladong mga desisyon. Sinusuportahan ang FXStreet ng humigit-kumulang 60 propesyonal sa pagitan ng Barcelona HQ at iba’t ibang rehiyon sa buong mundo.
Read More


