
Solana Price Analysis: SOL extends slide amid bearish market sentiment
Ni Vishal Dixit
Petsa ng Pag-publish: 19 Jan 2026 | Petsa ng Pag-edit: 19 Jan 2026


Sikat na Artikulo

Solana (SOL) edges lower by 3% at press time on Monday, extending the 4% drop from Sunday amid US-Europe tensions over Greenland. Derivatives market data signals a downside bias, in line with the broader market pullback, expecting further decline in SOL.
- Solana is down 3% on Monday, extending the decline below the 50-day EMA.
- Derivatives data signal bearish bias among traders as market sentiment weakens amid US-Europe tensions.
- Technically, Solana could further deepen the pullback toward December lows.
Solana (SOL) edges lower by 3% at press time on Monday, extending the 4% drop from Sunday amid US-Europe tensions over Greenland. Derivatives market data signals a downside bias, in line with the broader market pullback, expecting further decline in SOL. Technically, momentum indicators show a surge in bearish pressure amid a sell signal.
Sentiments backing Solana weaken amid market tensions
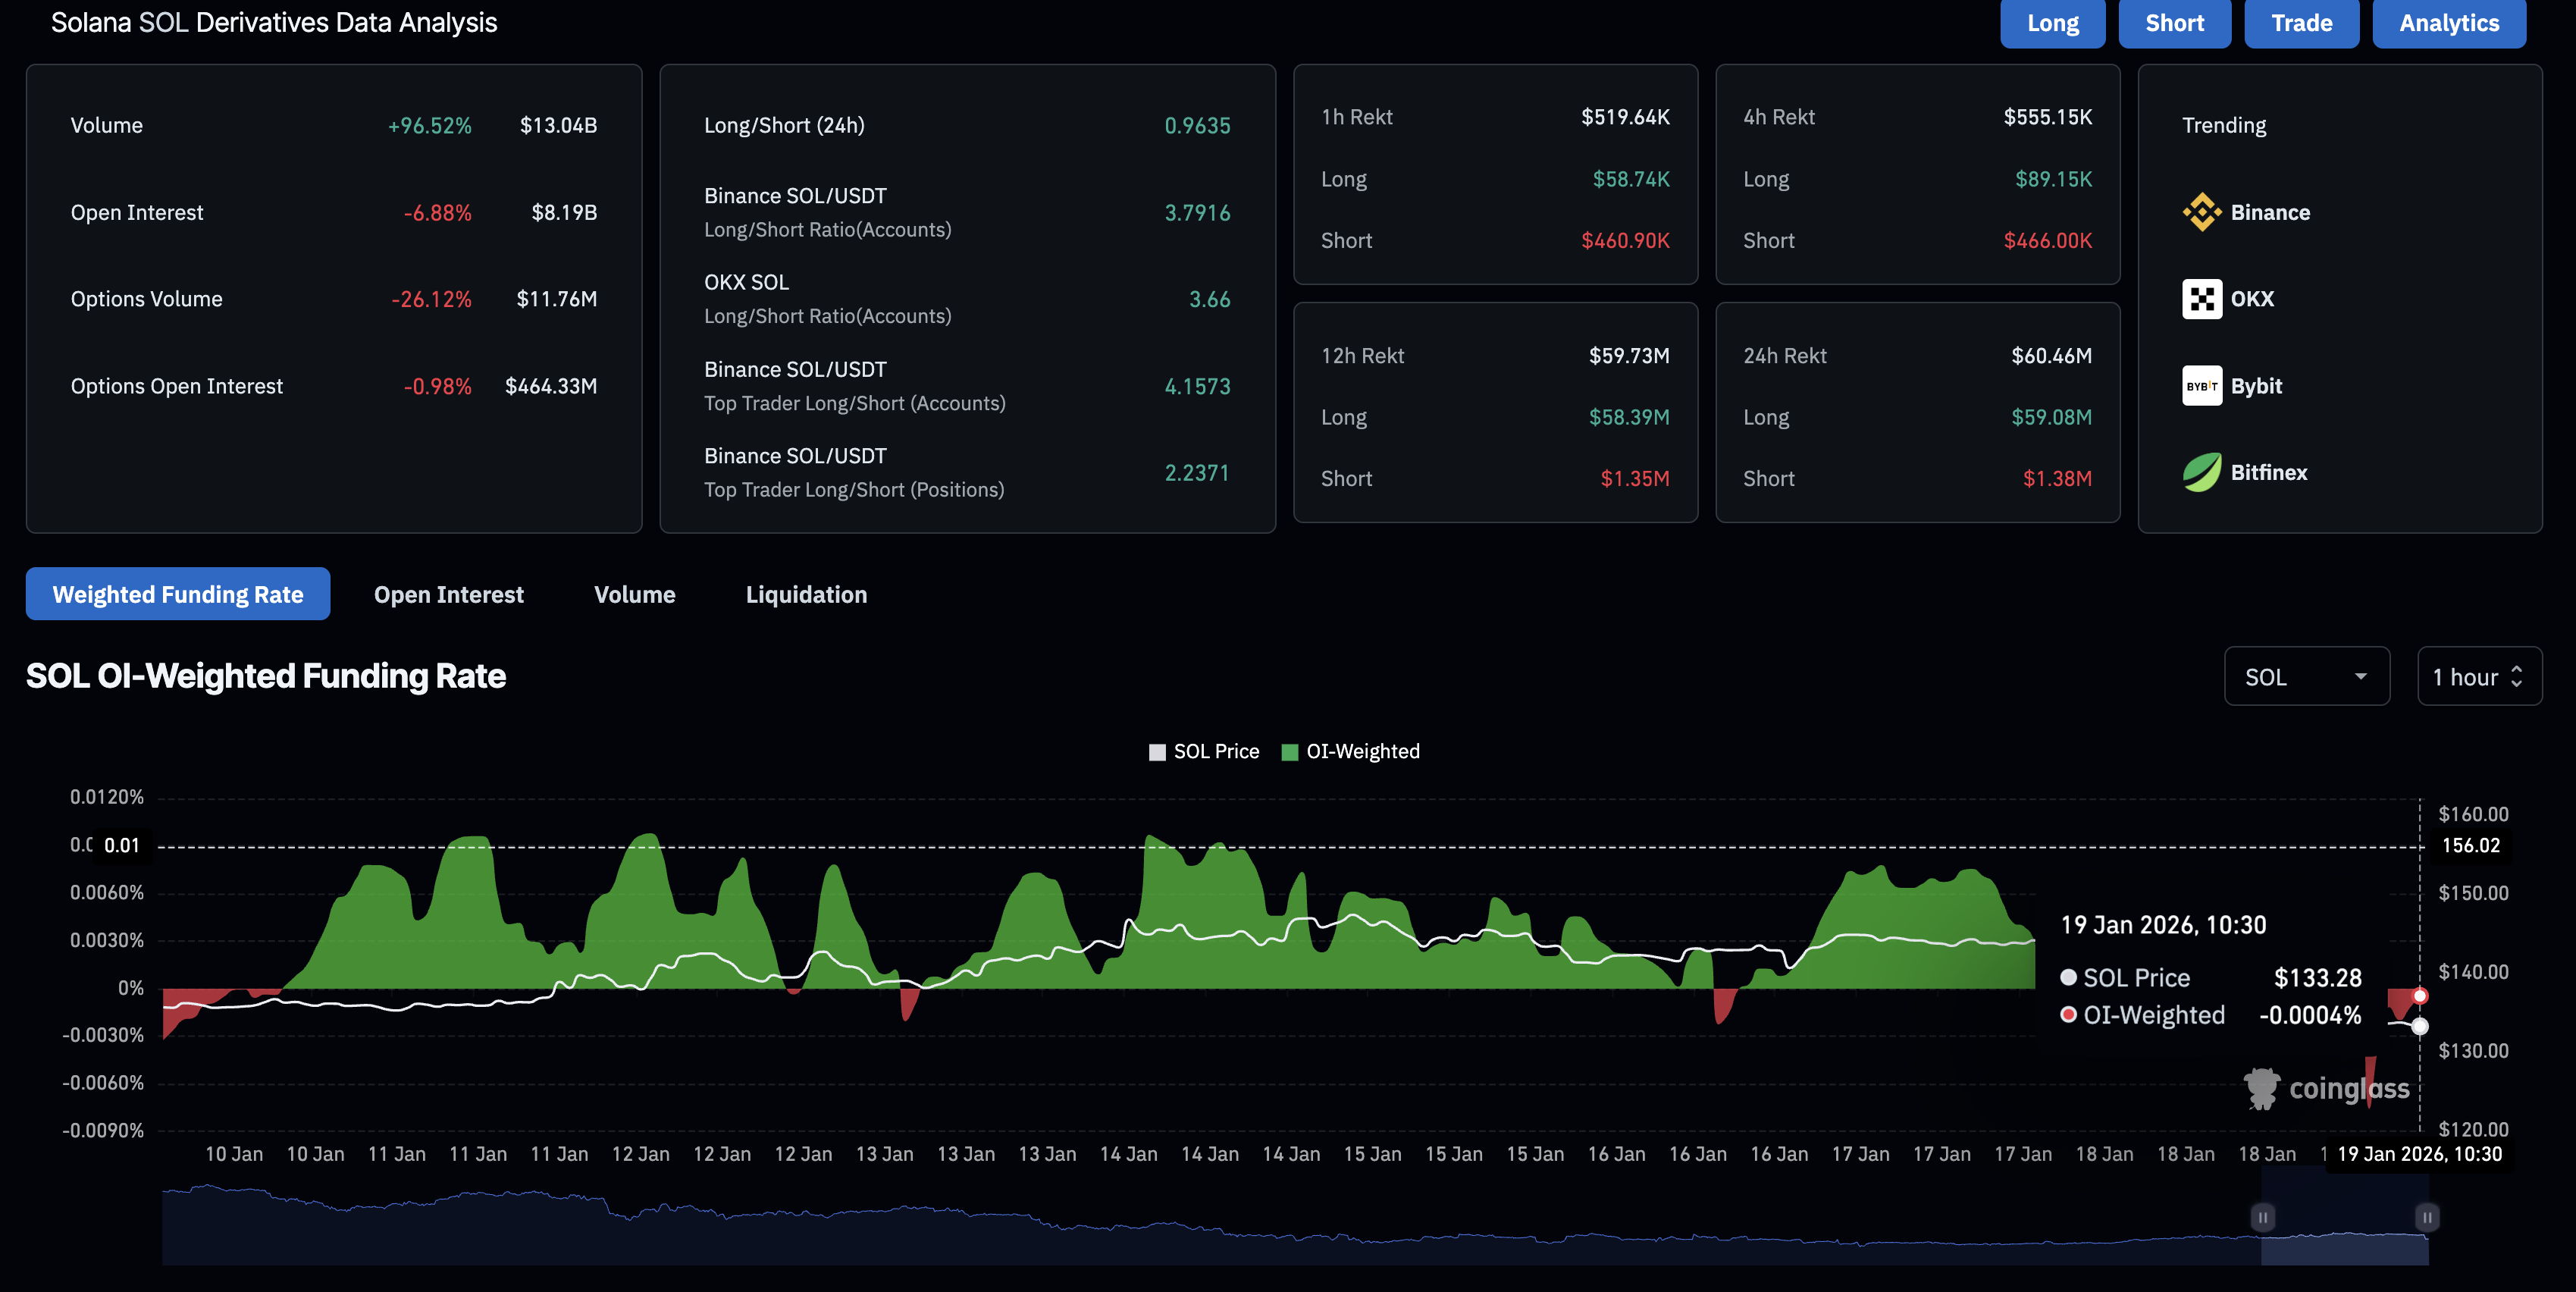
Solana derivatives record long liquidations of $59.08 million over the last 24 hours, significantly outpacing short liquidations of $1.38 million, reflecting a clear sell-side bias. The SOL futures Open Interest (OI) is down roughly 7% over the same time frame to $8.19 billion, consistent with the long liquidations. This reduction in capital at exposure in SOL derivatives reflects reduced risk appetite among traders.
Additionally, the funding rate of -0.0004% indicates a sell-side bias as traders build new positions.
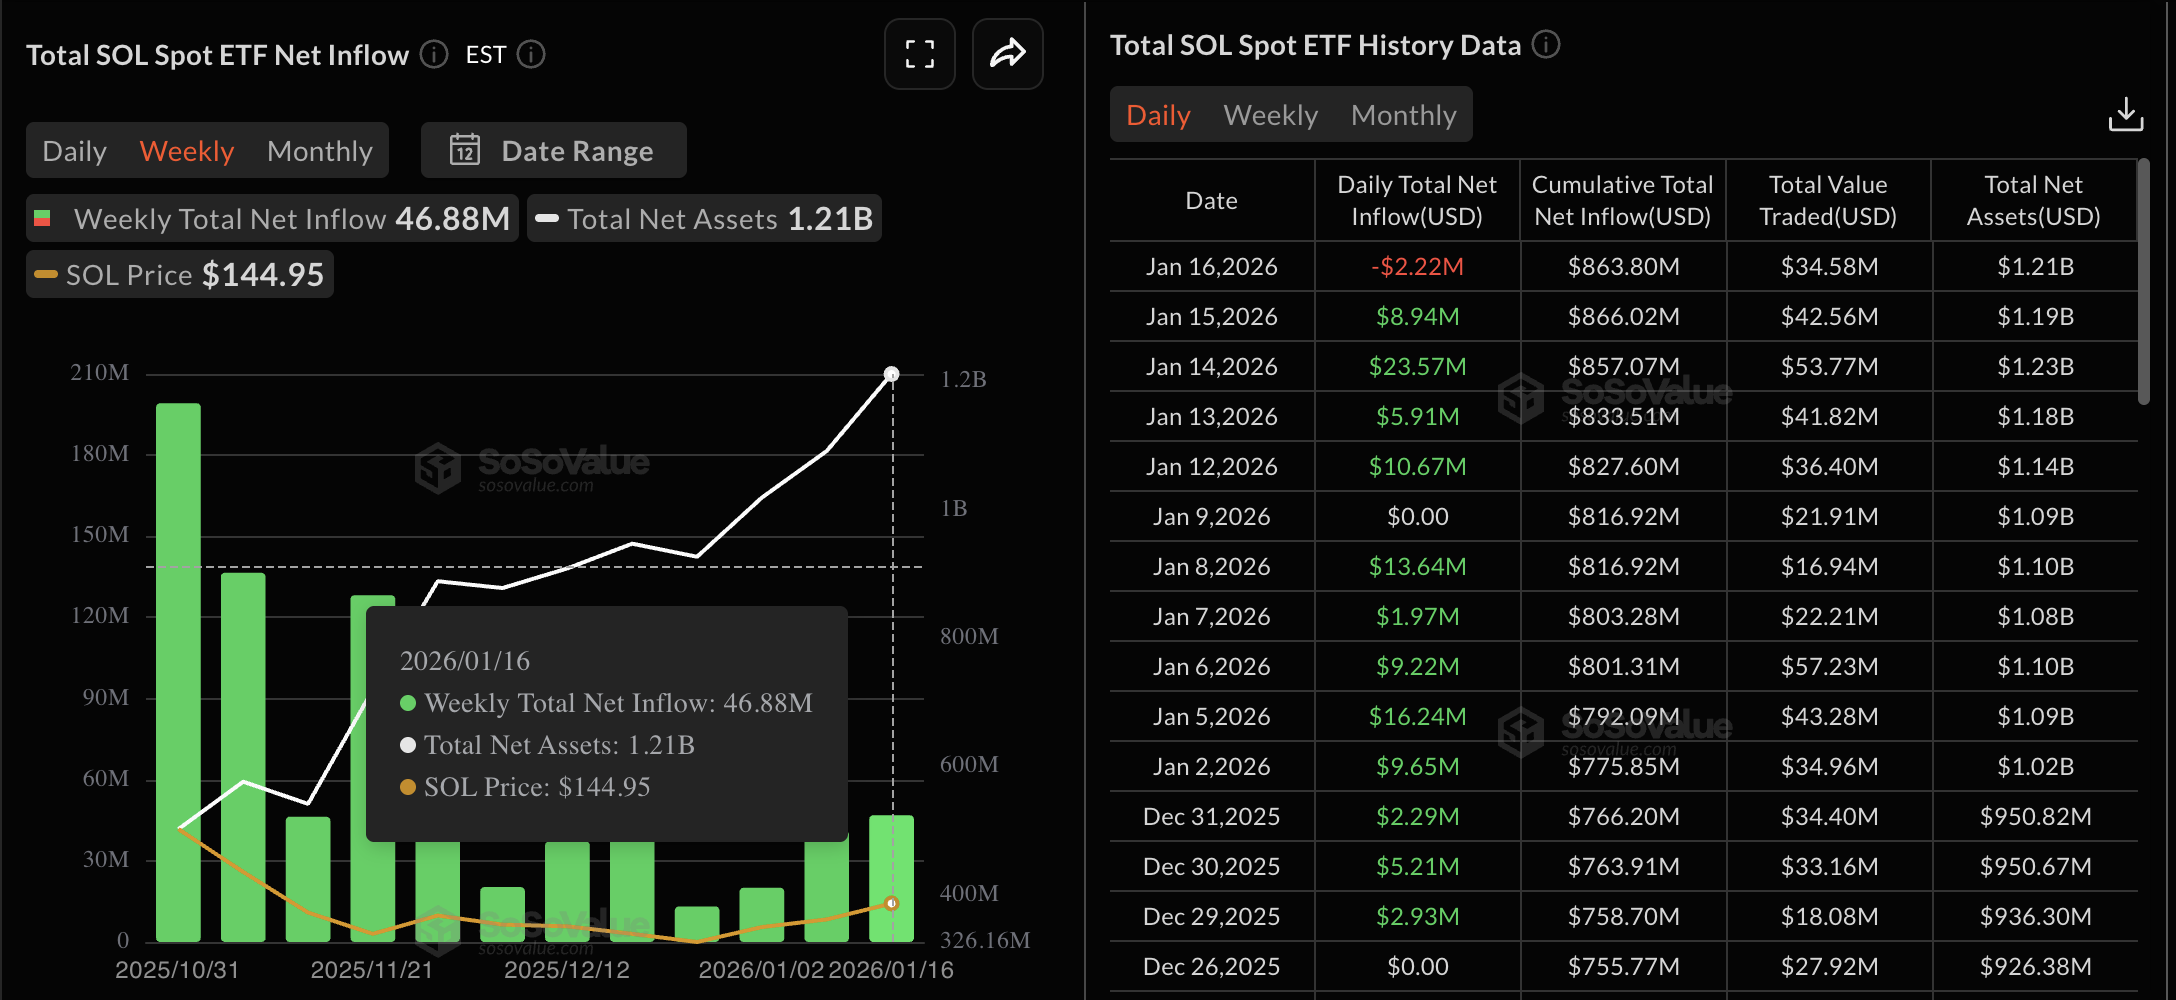
On the institutional side, the US spot SOL Exchange Traded Funds (ETFs) recorded $46.88 million in inflows last week. However, changes in market dynamics could negatively impact institutional confidence, risking further selling pressure on Tuesday. The US market is closed on Monday for Martin Luther King Jr. Day.
Technical outlook: Will Solana price crash to the December low?
Solana remains under intense selling pressure, trading near $130 and below the 20-day and 50-day Exponential Moving Averages (EMAs) at $137-$138, tilting the near-term bias lower. A steady downward trend in Solana could breakdown the rounding bottom chart pattern from the December 18 low at $116.
The Moving Average Convergence Divergence (MACD) indicator crosses below the signal line on the daily chart, with the histogram turning negative and suggesting strengthening bearish momentum. The Relative Strength Index (RSI) at 45 is easing below the halfway line, reinforcing an increase in bearish momentum.
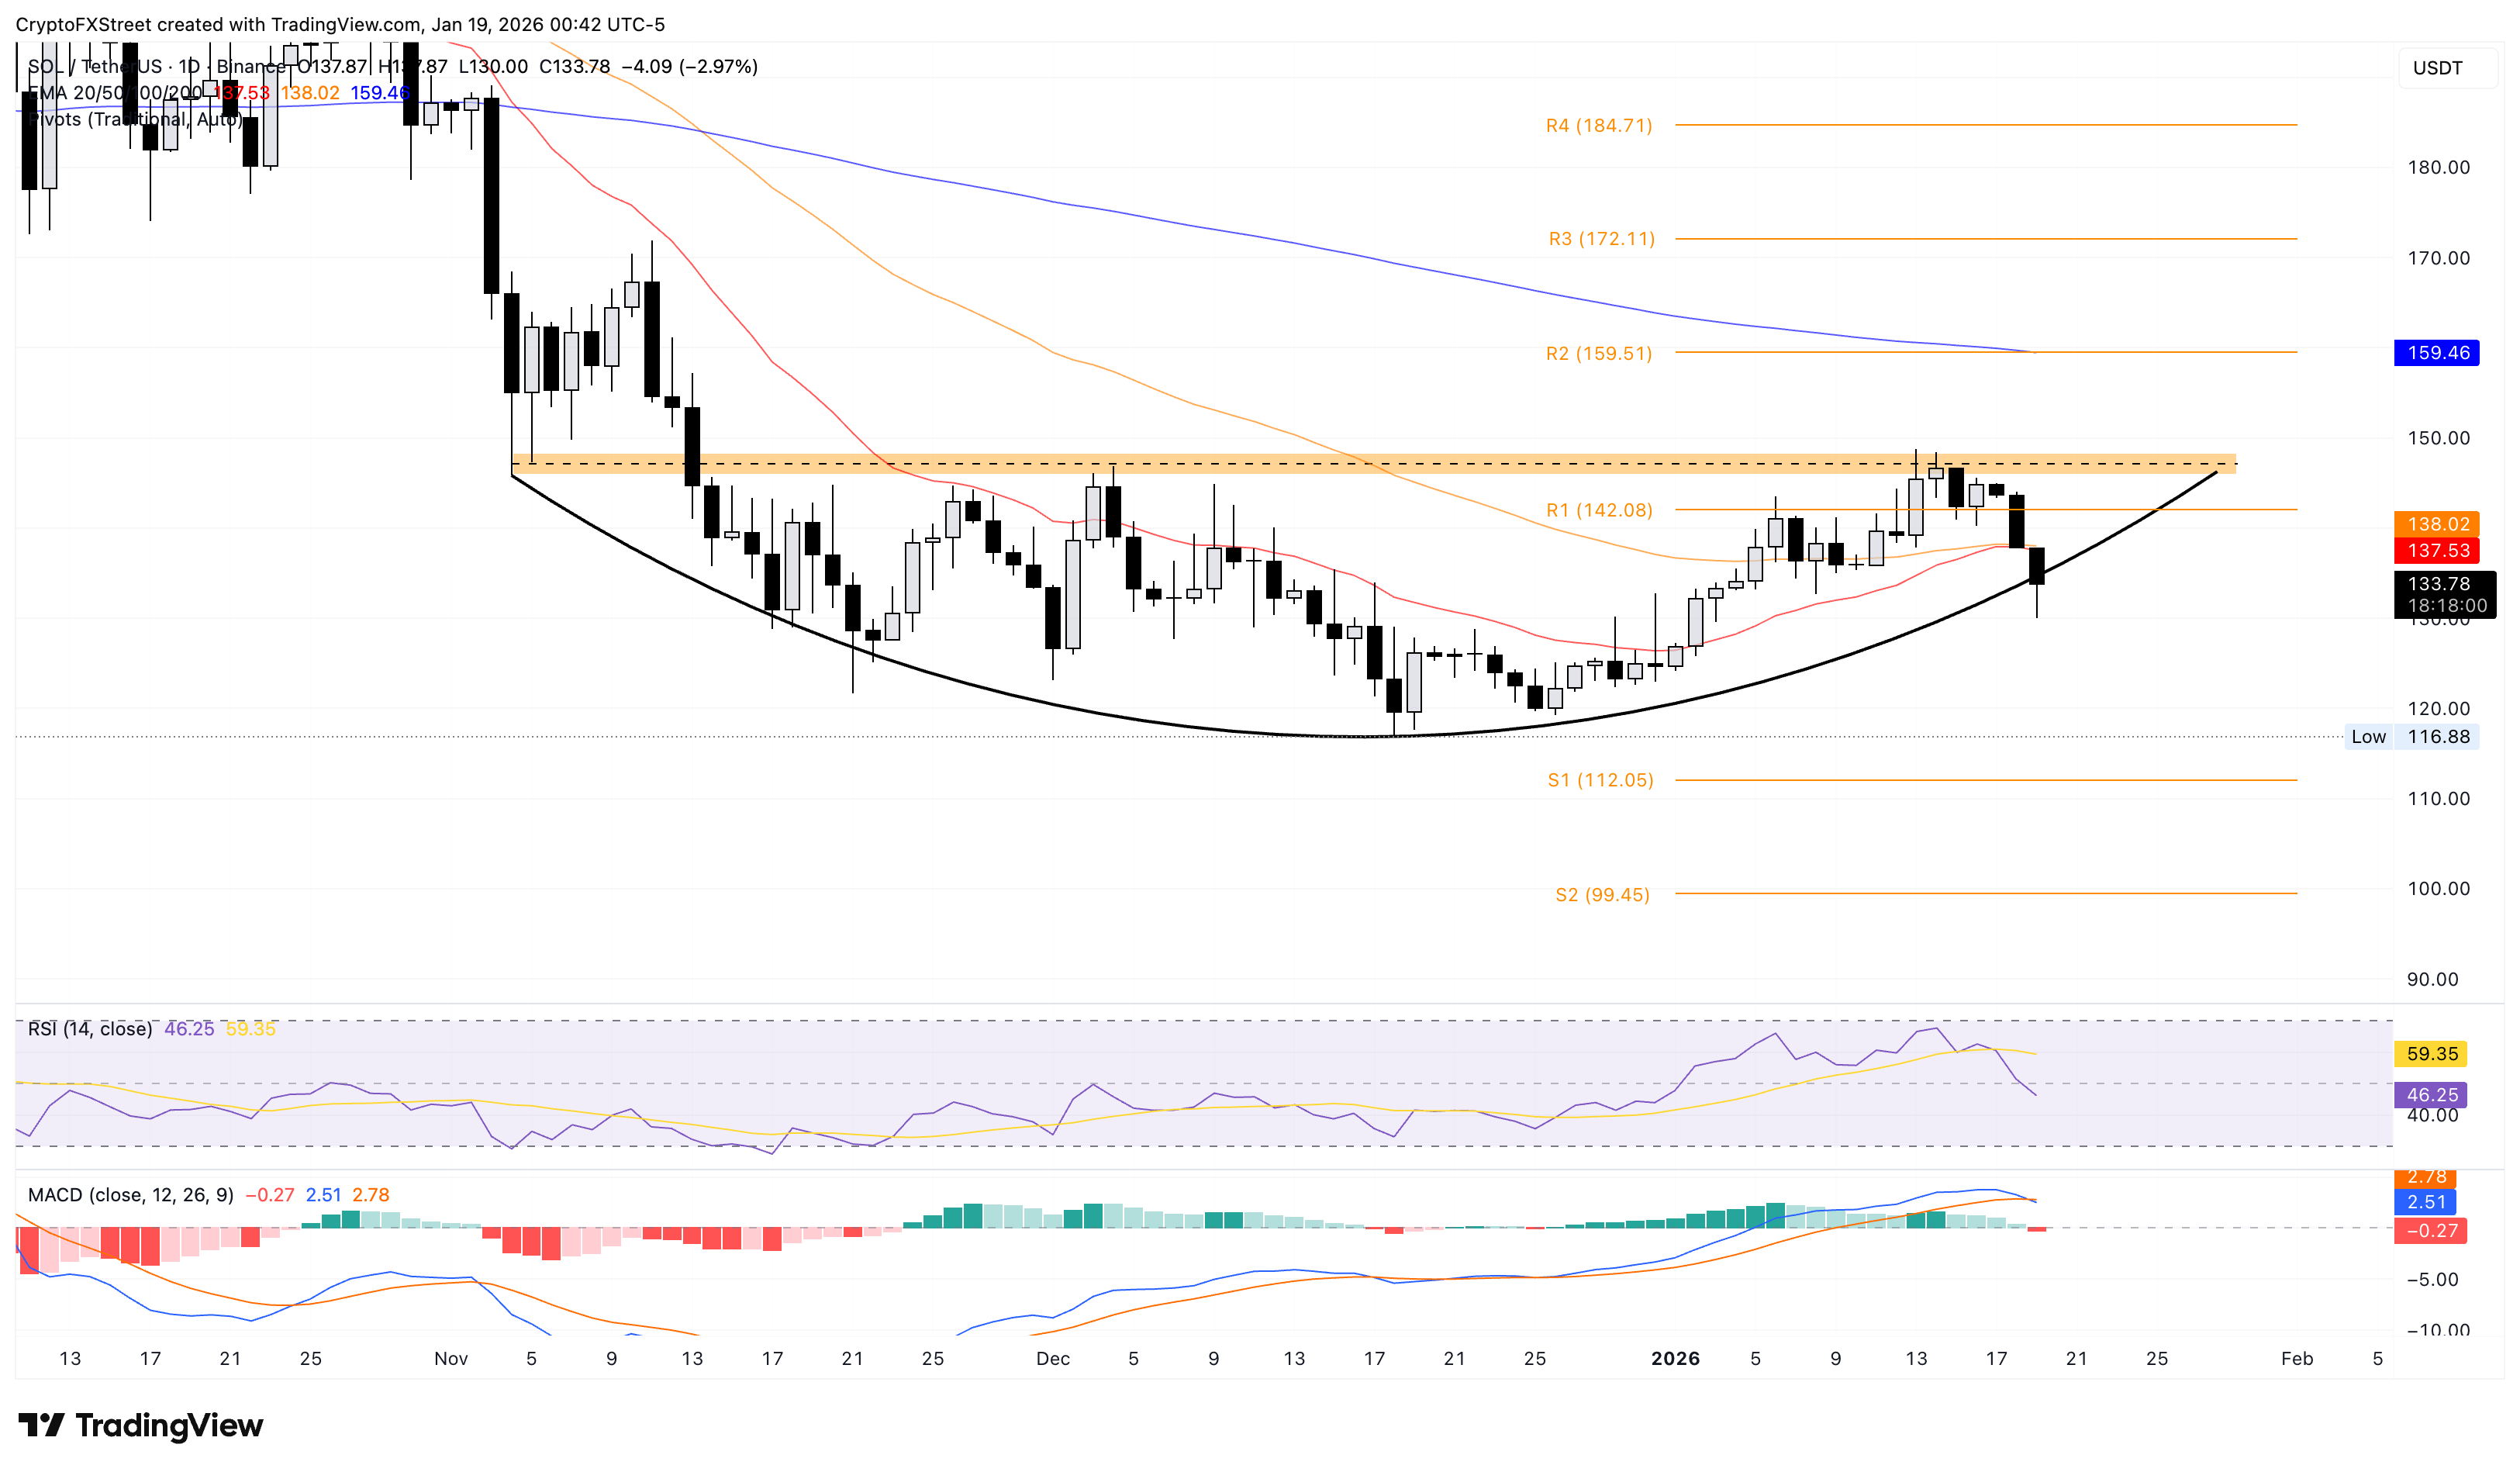
On the upside, the initial resistance sits at the supply zone near $148, and a sustained break above it could open room toward the 200-day EMA at $159.
(The technical analysis of this story was written with the help of an AI tool.)

Higit sa isang milyong user ang umaasa sa FXStreet para sa real-time market data, charting tools, expert insights, at Forex news. Ang komprehensibong economic calendar at educational webinars nito ay tumutulong sa mga trader na manatiling may alam at gumawa ng kalkuladong mga desisyon. Sinusuportahan ang FXStreet ng humigit-kumulang 60 propesyonal sa pagitan ng Barcelona HQ at iba’t ibang rehiyon sa buong mundo.
Magbasa pa


