
Trade The World
Solana Price Forecast: SOL rebounds as retail demand resurfaces, ETFs hold steady
Ni Vishal Dixit
Petsa ng Pag-publish: 6 Nov 2025 | Petsa ng Pag-edit: 6 Nov 2025


POPULAR ARTICLES

Solana (SOL) trades above $160 at press time on Wednesday, holding steady after 4% rise on the previous day, underpinned by the broader market recovery. Corroborating with steady institutional demand, the retail demand is resurfacing, suggesting further gains for Solana.
- Solana bounced back from the $155 support zone by 4% on Wednesday, potentially testing the $174-$177 zone.
- Retail interest in Solana resurfaces as open interest and funding rates rebound.
- Solana ETFs maintain a steady stream of inflows for the sixth consecutive day.
Solana (SOL) trades above $160 at press time on Wednesday, holding steady after 4% rise on the previous day, underpinned by the broader market recovery. Corroborating with steady institutional demand, the retail demand is resurfacing, suggesting further gains for Solana.
However, the declining stablecoin liquidity on the Solana network could risk lower on-chain demand.
Retail and institutional demand hold for Solana
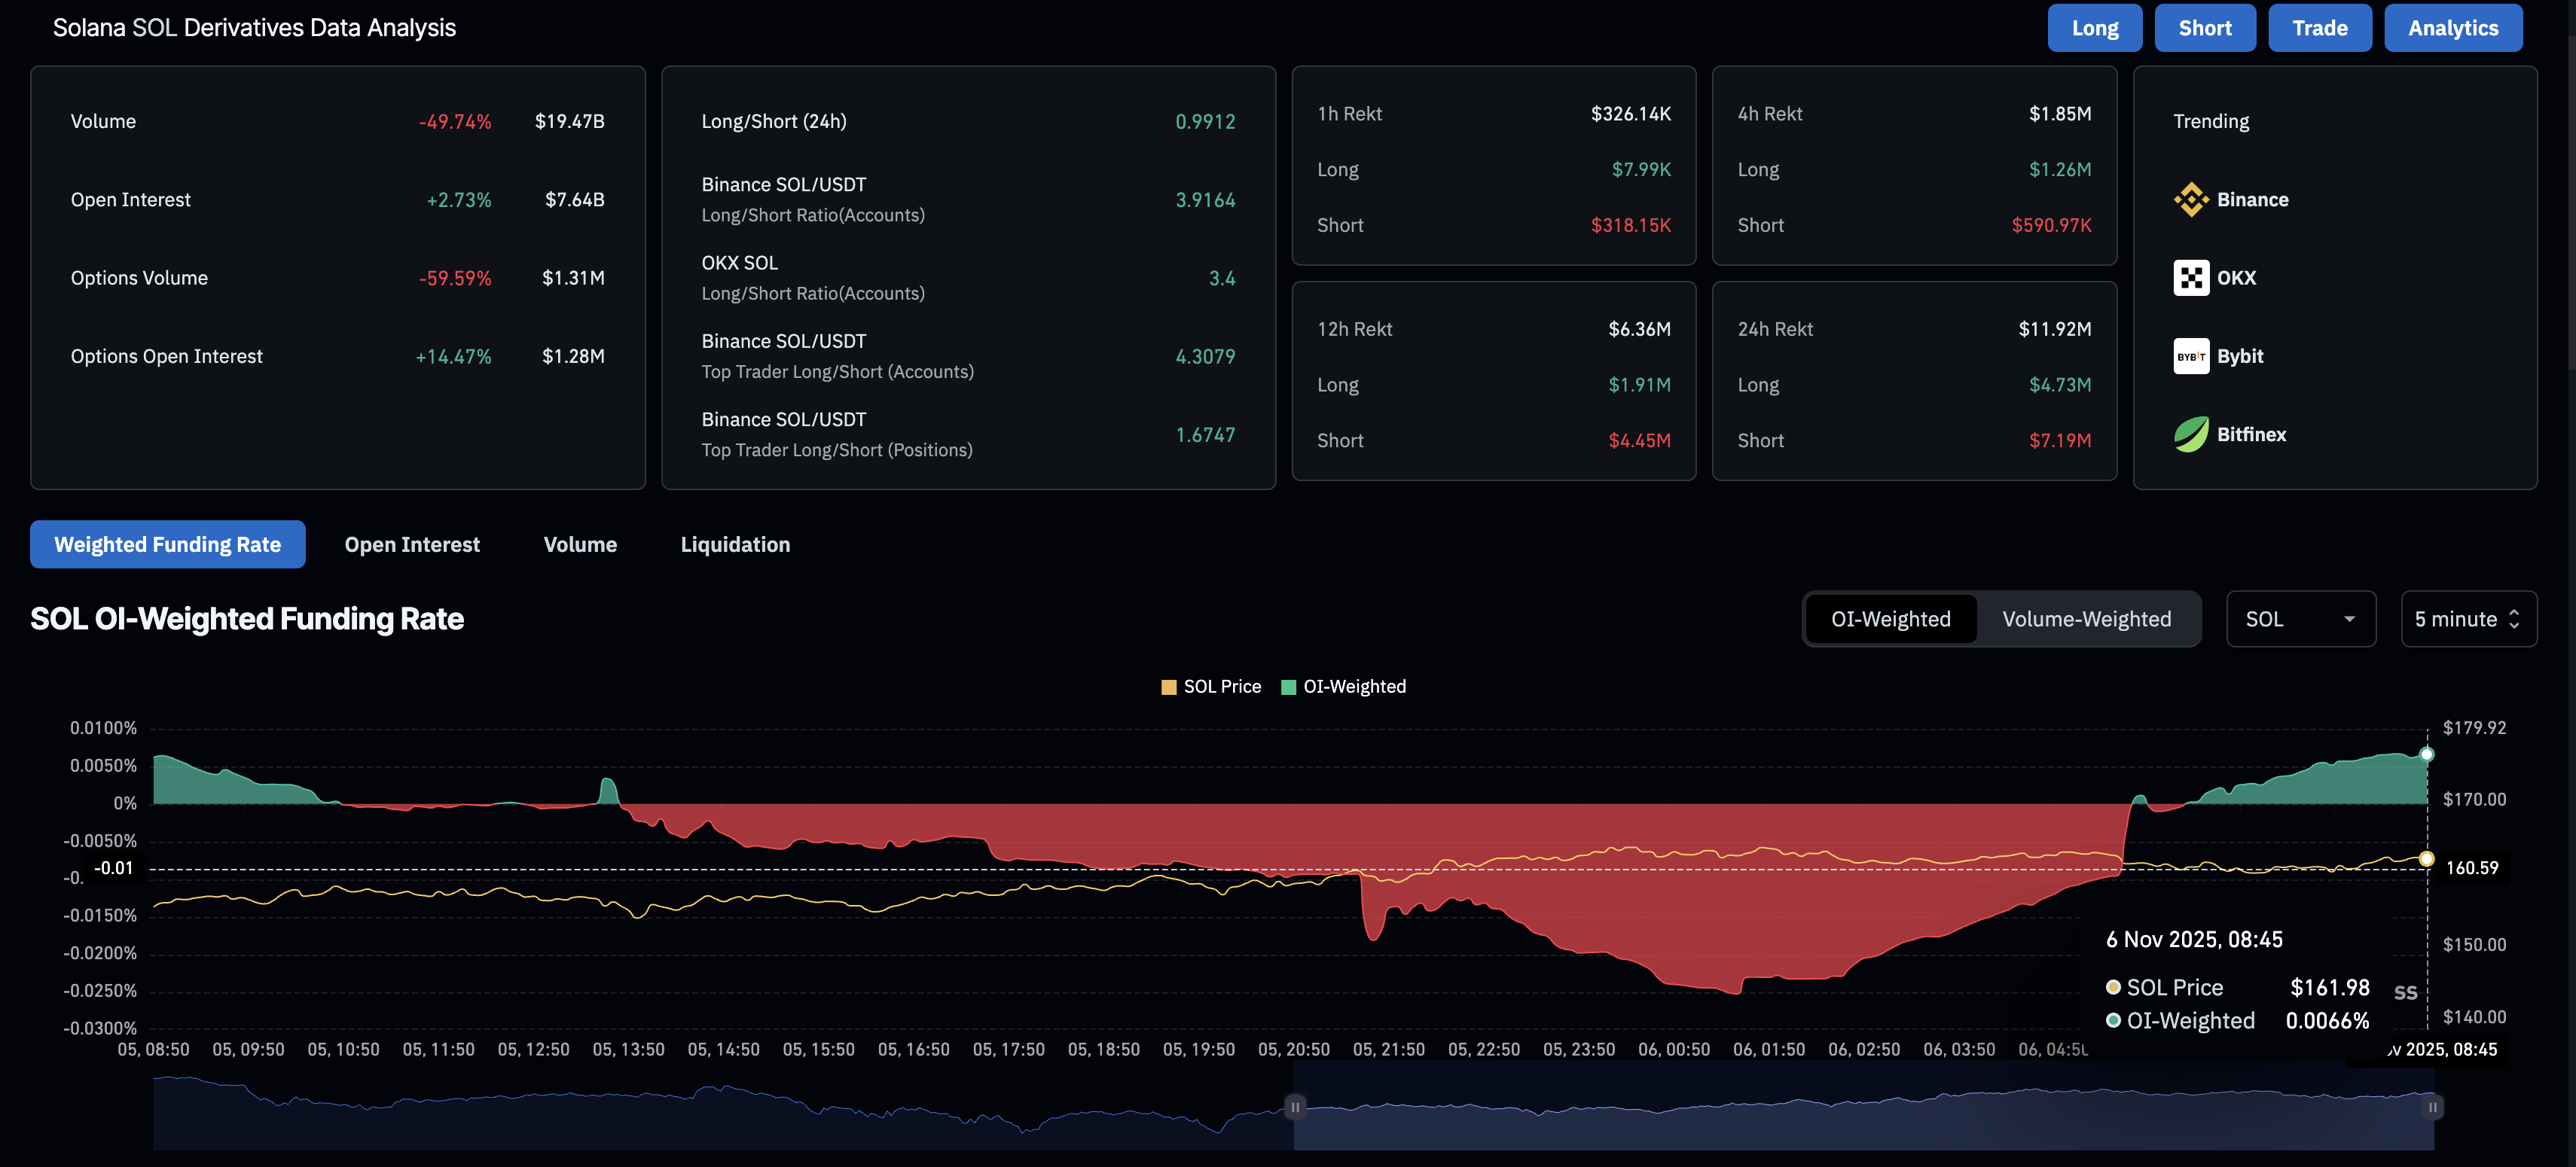
Solana is regaining the interest of retail investors after a rough start to the week. CoinGlass data shows that the SOL futures Open Interest (OI) has increased by 2.73% in the last 24 hours to $7.64 billion, indicating a rise in futures contracts or leverage.
At the same time, the OI-weighted funding rate has flipped positive to 0.0066% from -0.0253% earlier in the day, indicating a rise in traders' bullish intent.
Corroborating the sentiment shift, short liquidations of $7.19 million in the last 24 hours bypass the $4.73 million in long liquidations, indicating a wipeout of overleveraged bearish positions. This increases the long-to-short ratio to 0.9912, as excess short positions are forcibly liquidated.
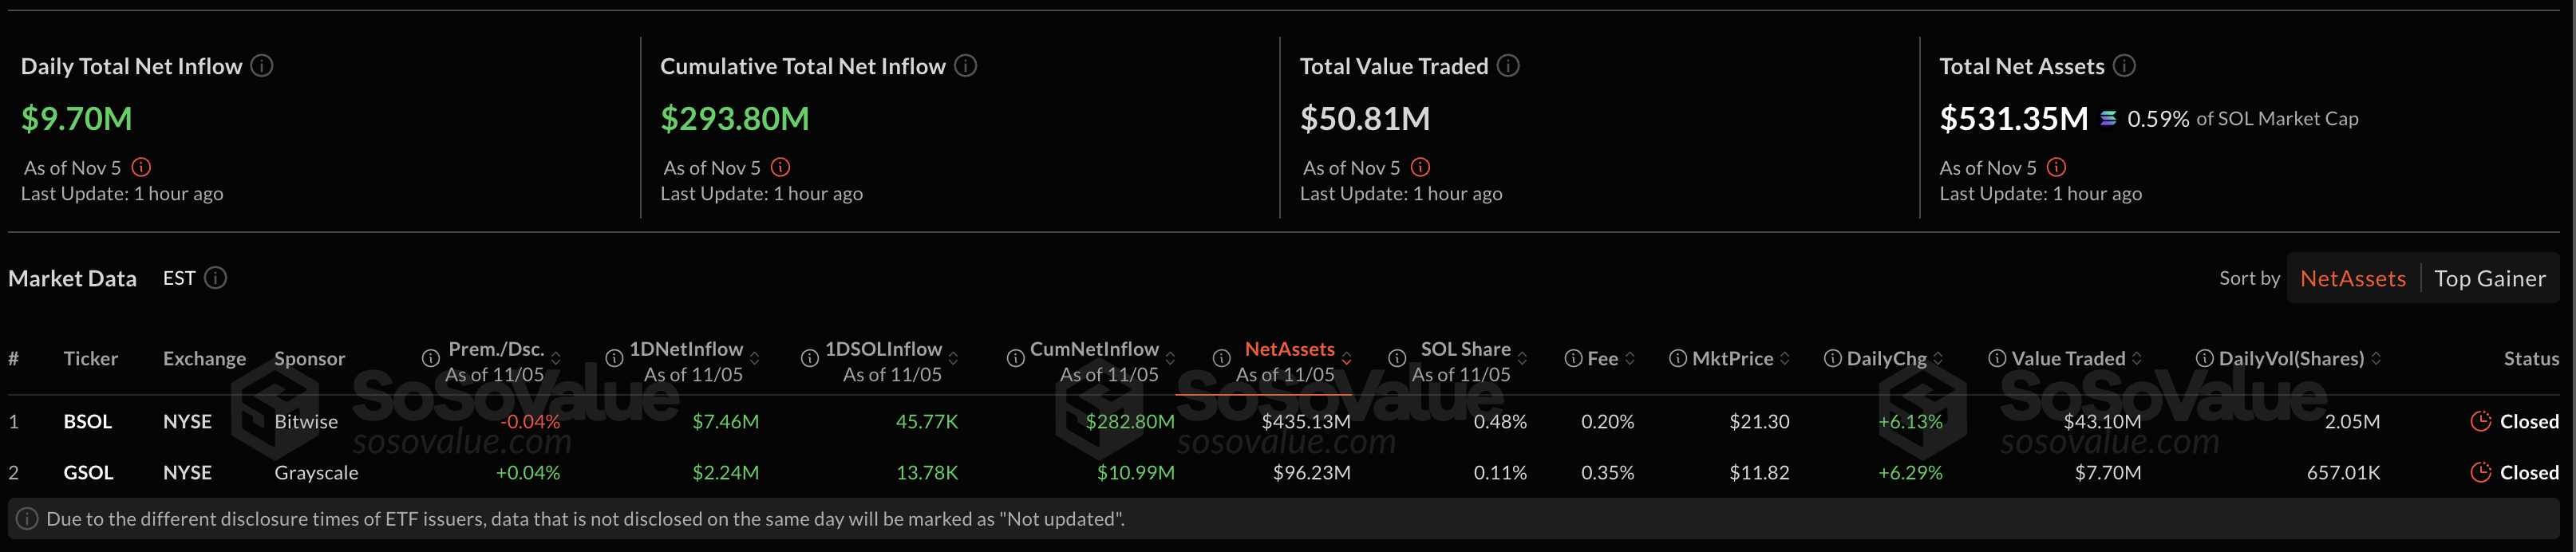
In the same line, the institutional demand for Solana remains steady as the US spot SOL Exchange Traded Funds (ETFs) recorded $9.70 million worth of net inflow on Wednesday.
If the retail and institutional demand sustains, Solana could extend the recovery from Wednesday.
Is a liquidity trap brewing in the Solana network?
DeFiLlama data shows that the Total Value Locked (TVL) on Solana increased 2.27% in the last 24 hours, reaching $10.215 billion, after briefly dropping below $10 billion previously this week. Still, a steady downtrend in the TVL trend shows a consistent outflow of digital assets from the network as user demand wanes.
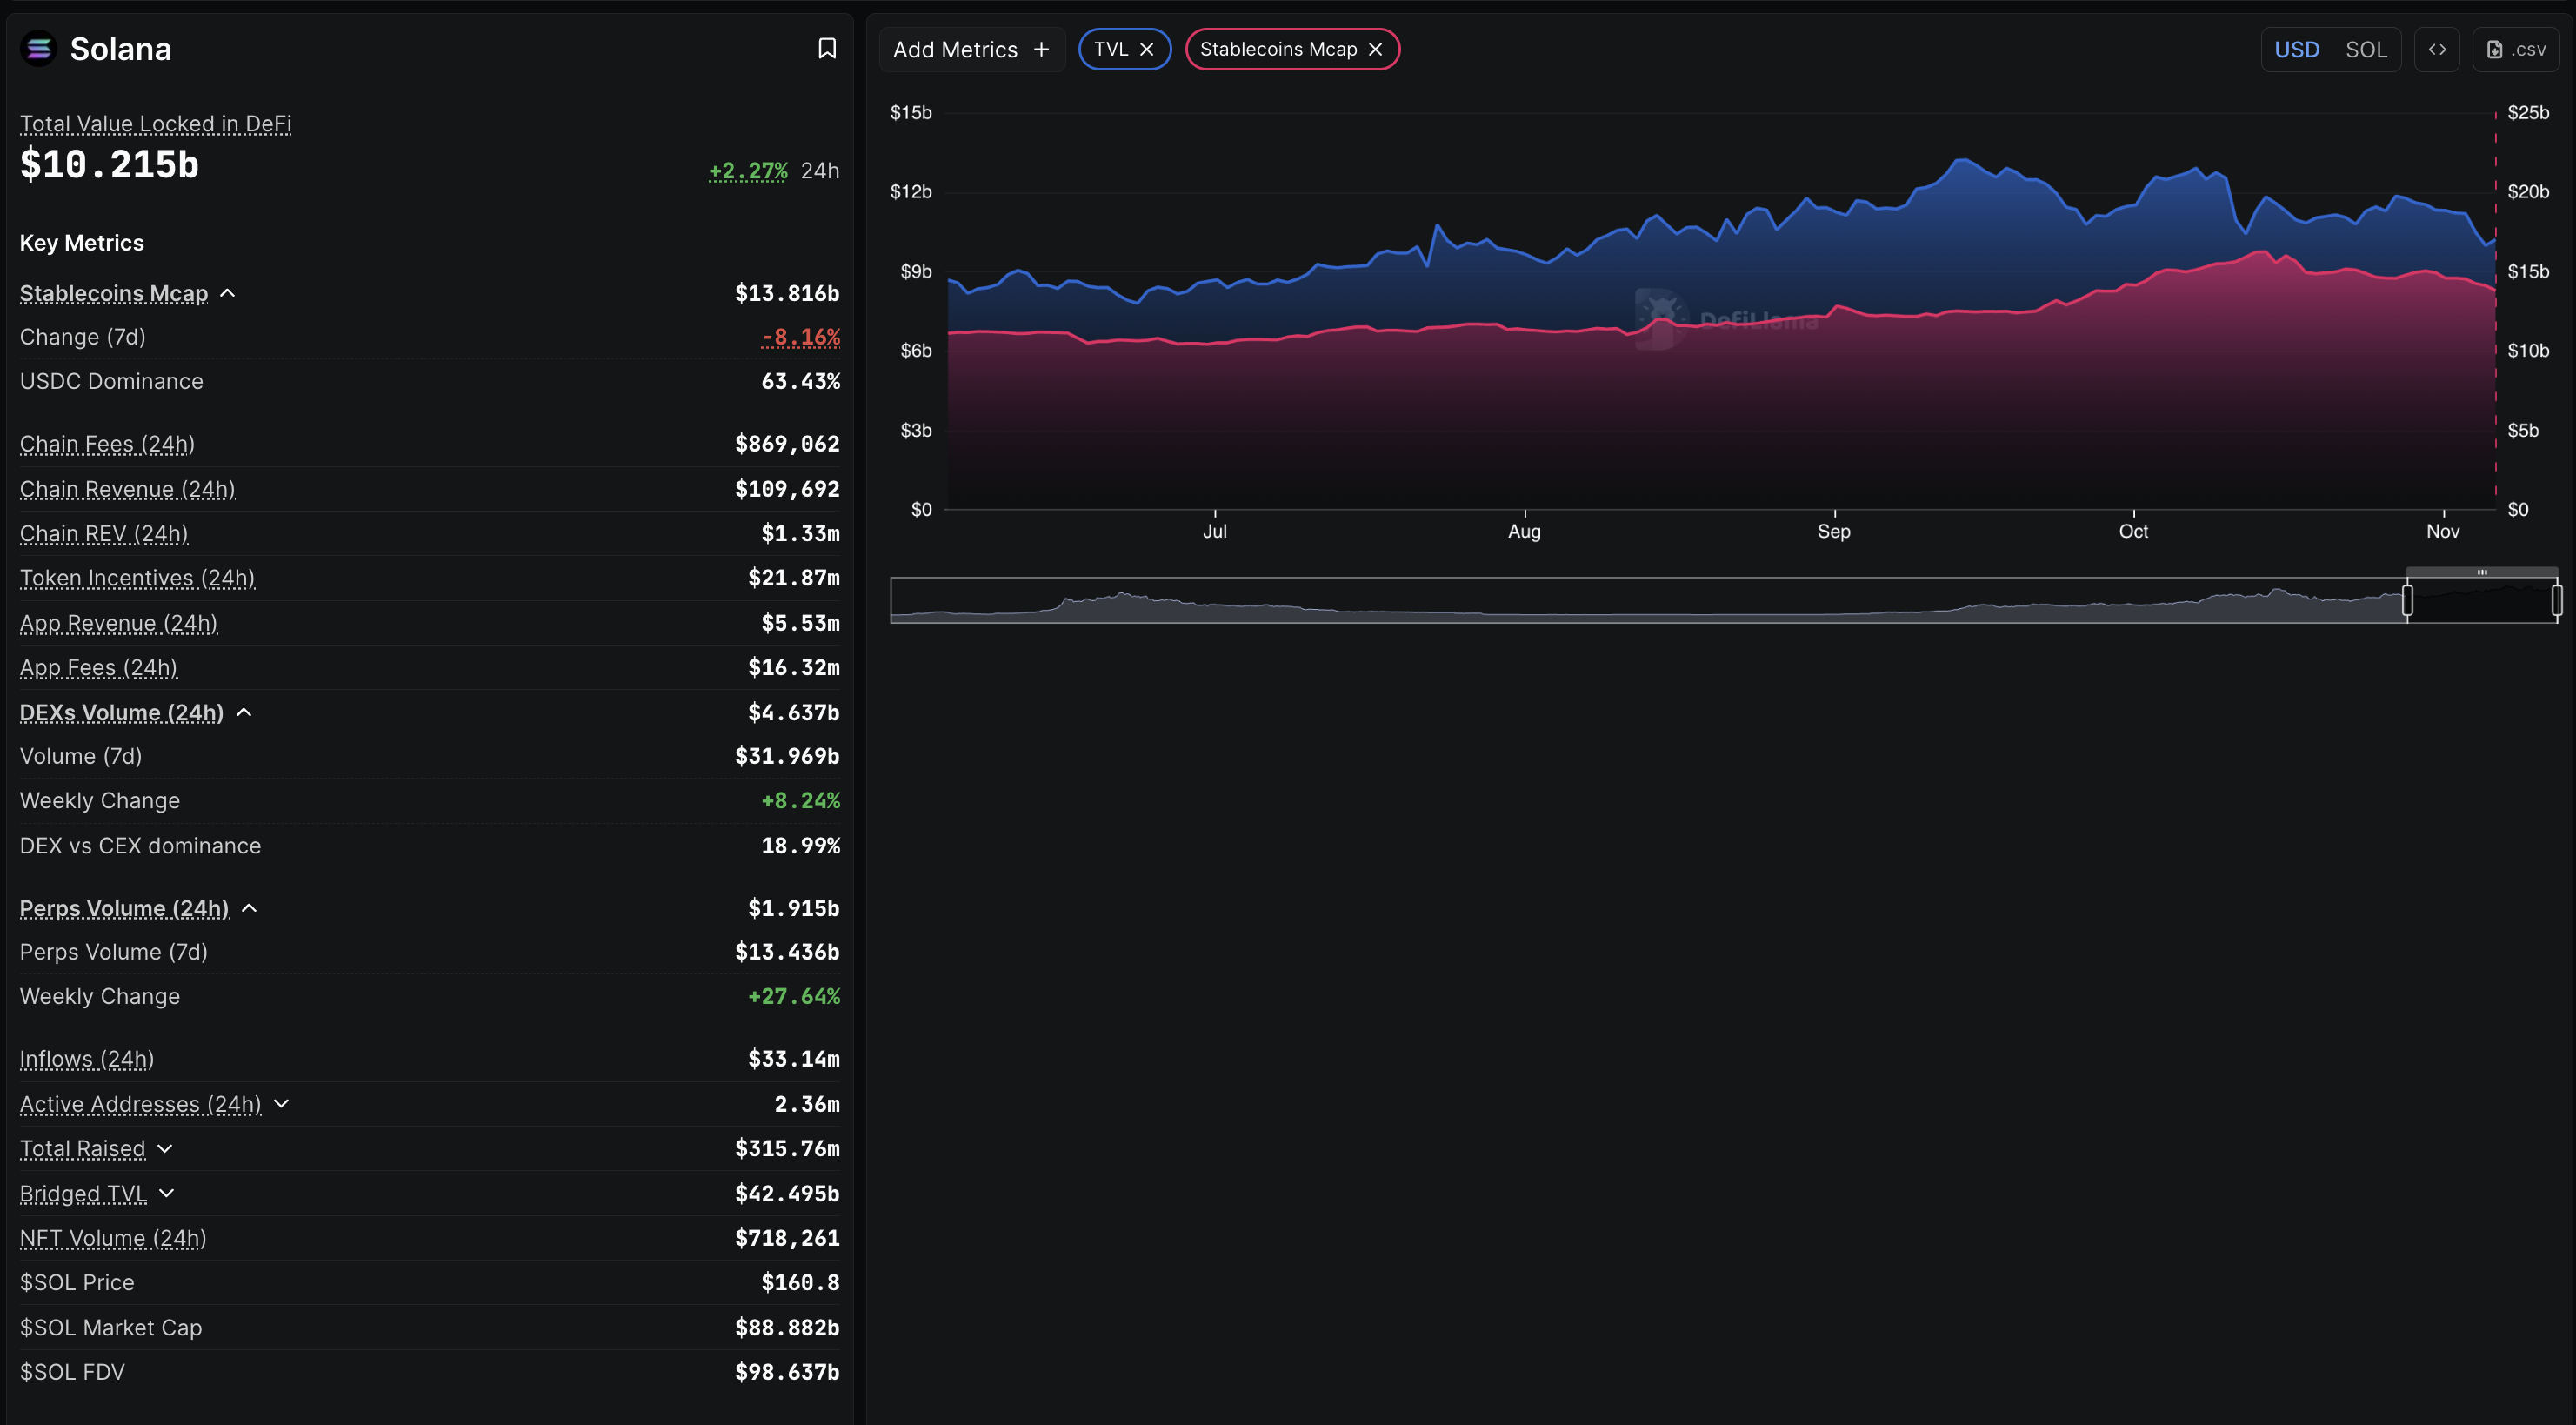
On a more negative note, the stablecoin market capitalization on Solana has decreased by 8.16% over the past week to $13.816 billion, indicating a decline in liquidity. If the liquidity continues to evaporate, it could reduce the on-chain demand for SOL, negatively impacting its market price.
Technical outlook: Will Solana hold above $155?
Solana dropped from the 200-day Exponential Moving Average (EMA) at $186 to $155 support at the start of this week, as anticipated by FXStreet. Furthermore, the pullback broke below the support trendline formed by connecting the July 1 and October 10 lows.
Still, Solana stabilizes above the demand zone with a 4% rebound on Wednesday. If the recovery extends, SOL could retest the $174-$177 demand-turned-supply zone.
However, the technical indicators on the daily chart suggest intense selling pressure as the Relative Strength Index (RSI) at 34 lingers near the oversold zone. Meanwhile, the Moving Average Convergence Divergence (MACD) maintains a downward trend with the signal line, indicating high bearish momentum.
In parallel, the declining 50-day EMA converges with the 100-day EMA, signaling a bearish crossover that indicates a firm short-term bearish trend.
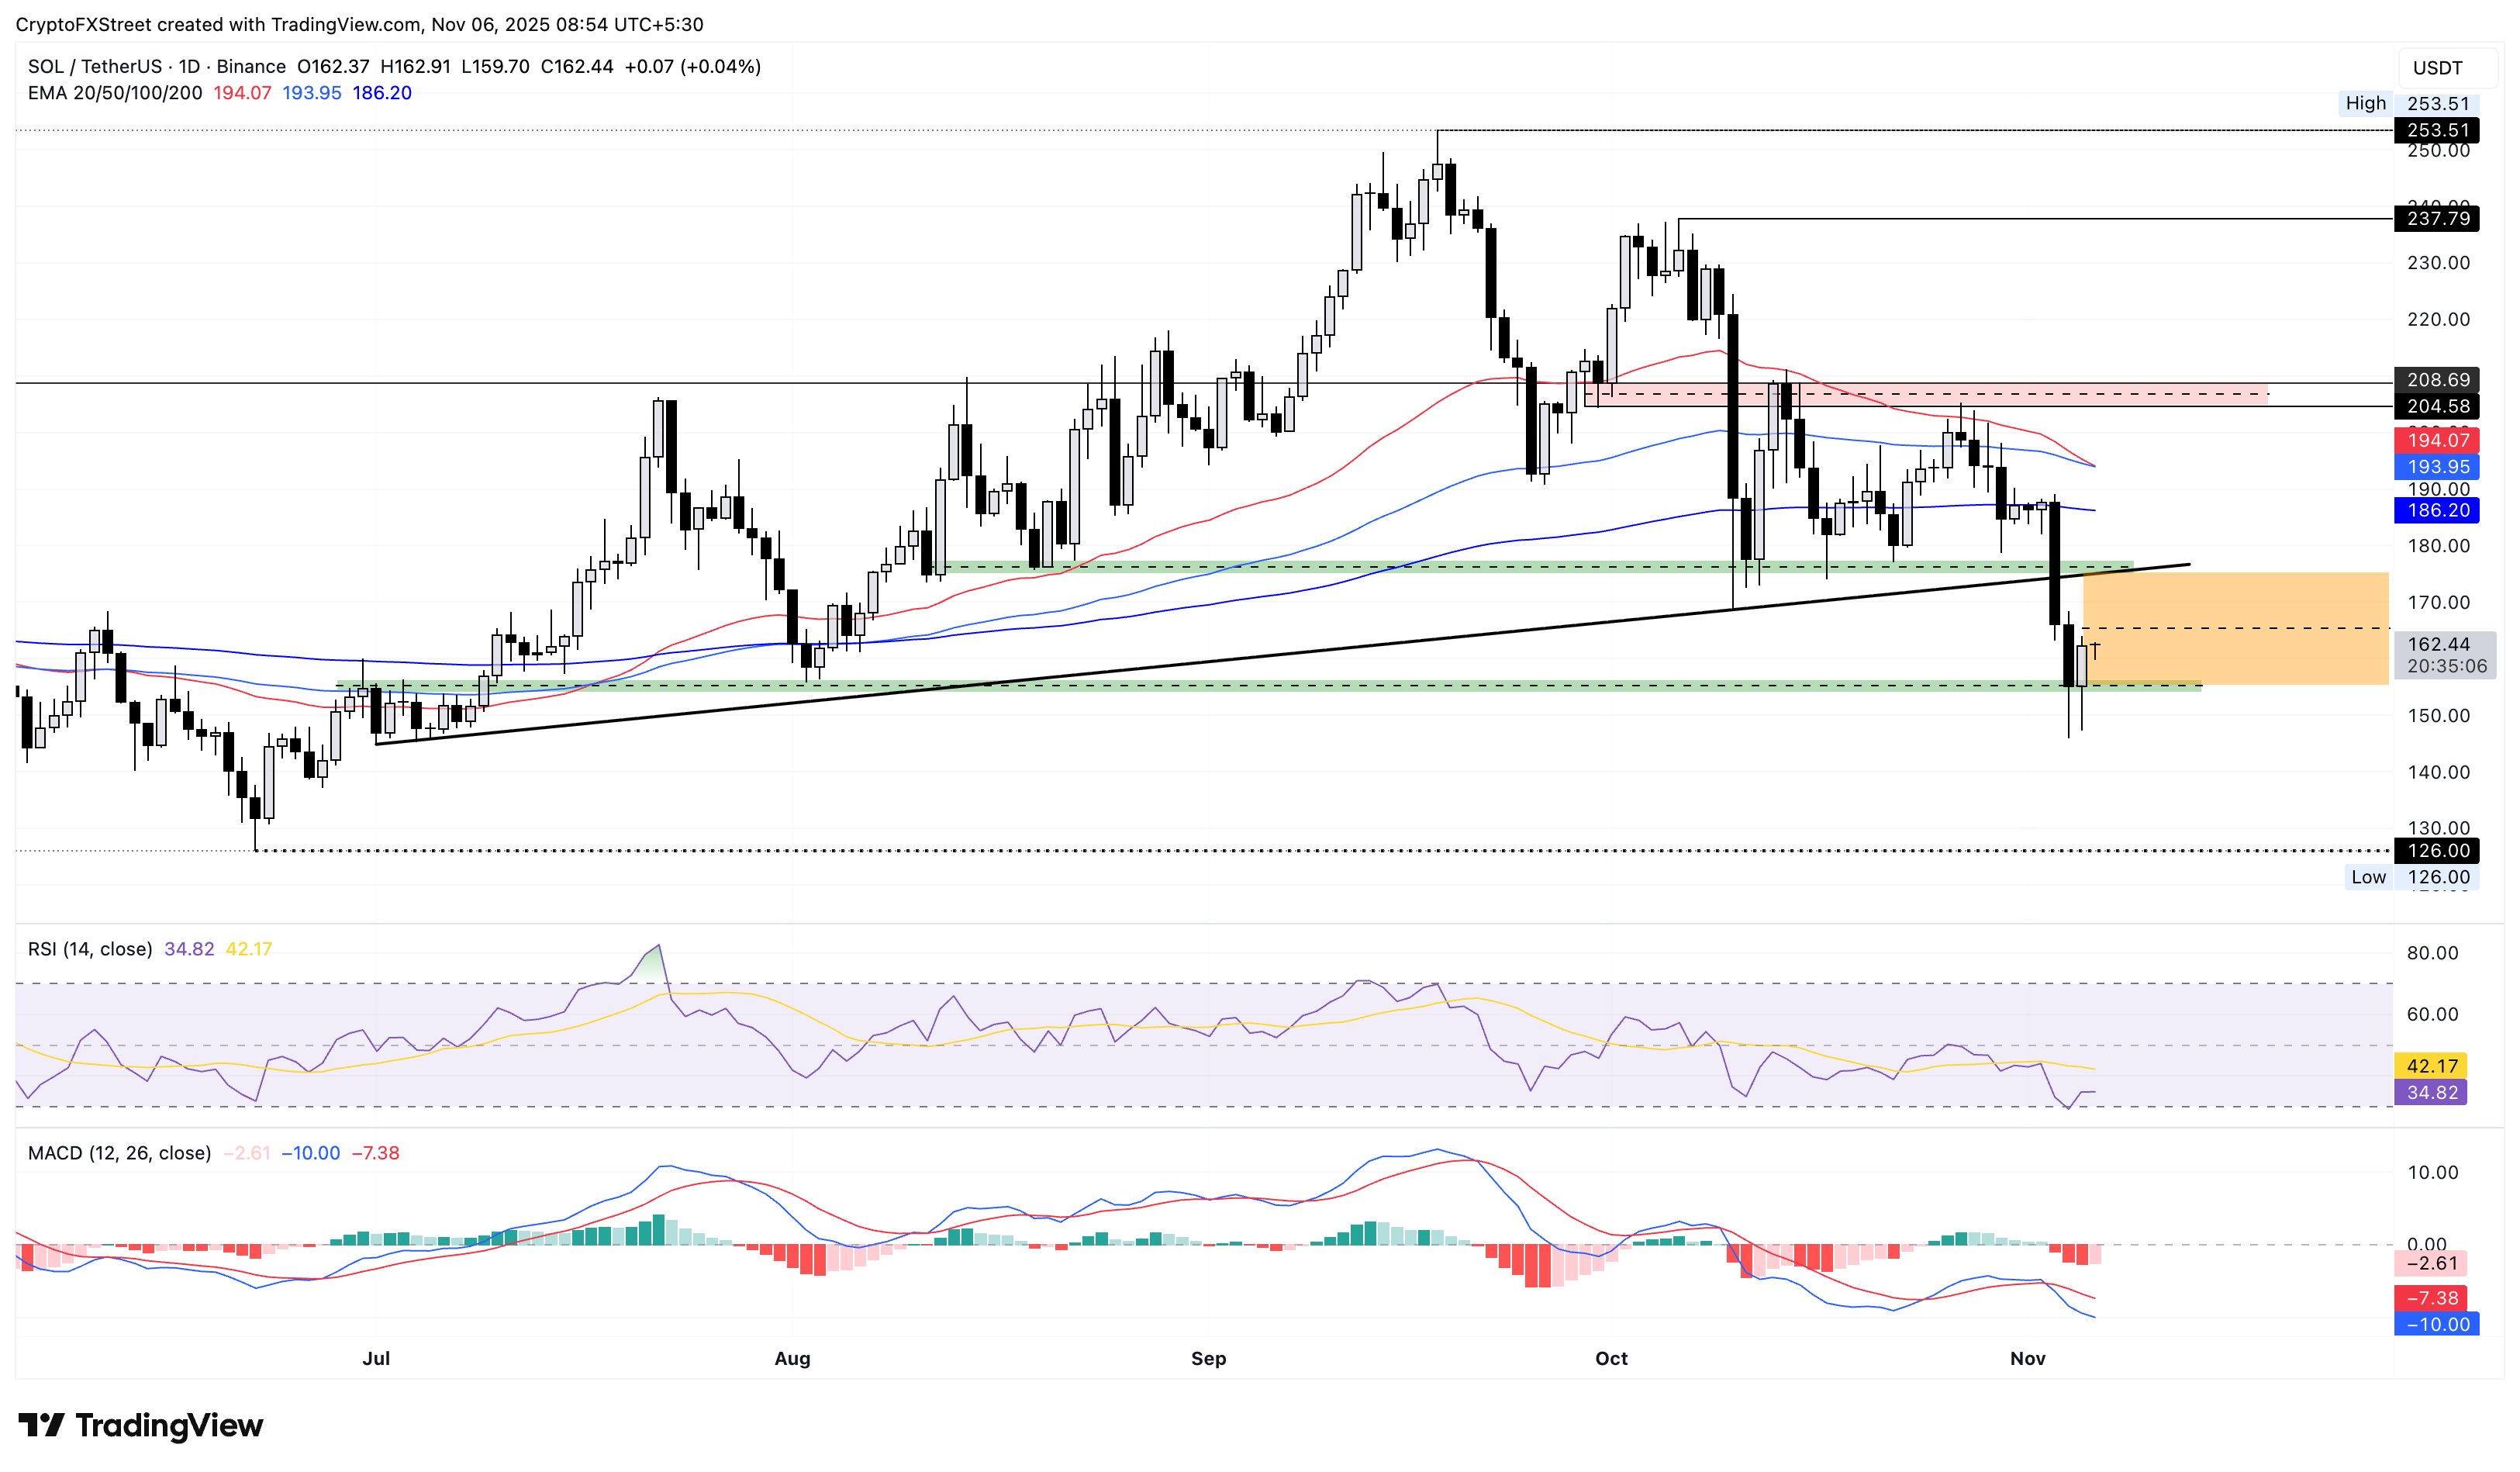
If SOL fails to hold above $155, it could extend the decline to the $126 level, marked by the June 22 low. So, a decisive close below $155 could alert a sell opportunity for sideline traders.

FXStreet
Higit sa isang milyong user ang umaasa sa FXStreet para sa real-time market data, charting tools, expert insights, at Forex news. Ang komprehensibong economic calendar at educational webinars nito ay tumutulong sa mga trader na manatiling may alam at gumawa ng kalkuladong mga desisyon. Sinusuportahan ang FXStreet ng humigit-kumulang 60 propesyonal sa pagitan ng Barcelona HQ at iba’t ibang rehiyon sa buong mundo.
Read More


